

Conditions across MO today are relatively quiet for this time of day. LAP stability indices are getting elevated (CAPE 2100, TT mid-50s, LIs -6 ish, K 32-35) but the bulls-eye for that is remaining in eastern KS. H7-H5 LR remain 6-7 thru midnight, after which will be appchng 8 thru mid-morn across west central MO. This is a result of genesis of a shallow SFC Low in West Central MO in early morning hours that drifts across MO thru EOP. So still forecasting early evening, ISOLD TS across the MO during that time as TT, LI and CAPE indices are elevated then as well. VWP indicating weak LL shear at this time. All thing considered, severe threat is low thru EOP. 
Category: Live Blogs
Real-time posts made during testbed nowcast and warning operations.
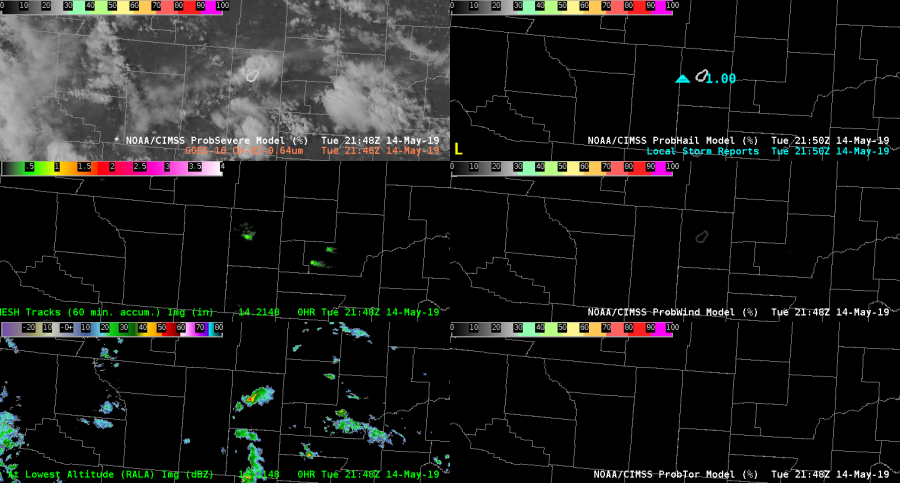
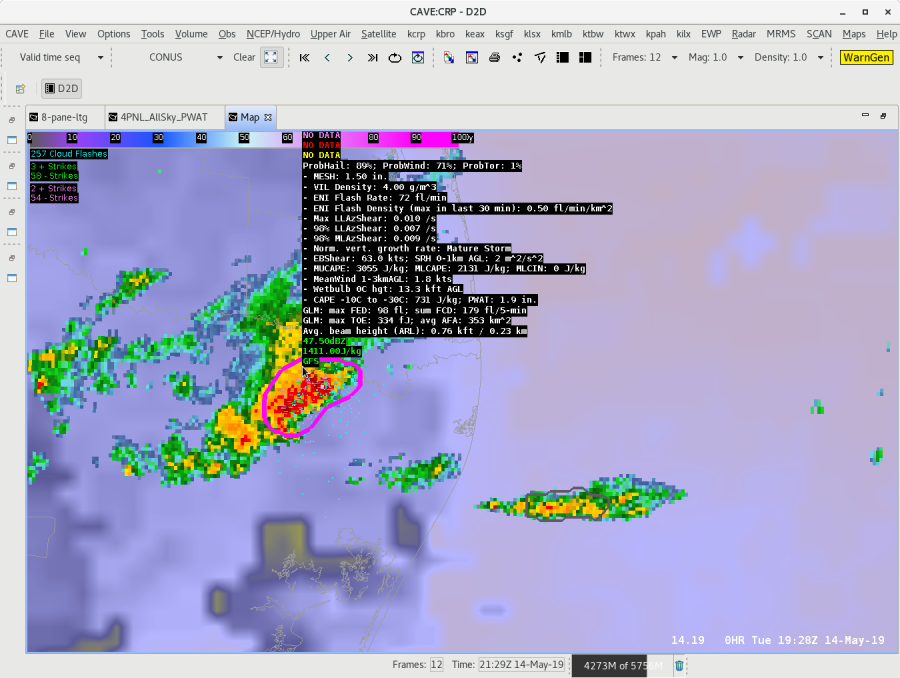
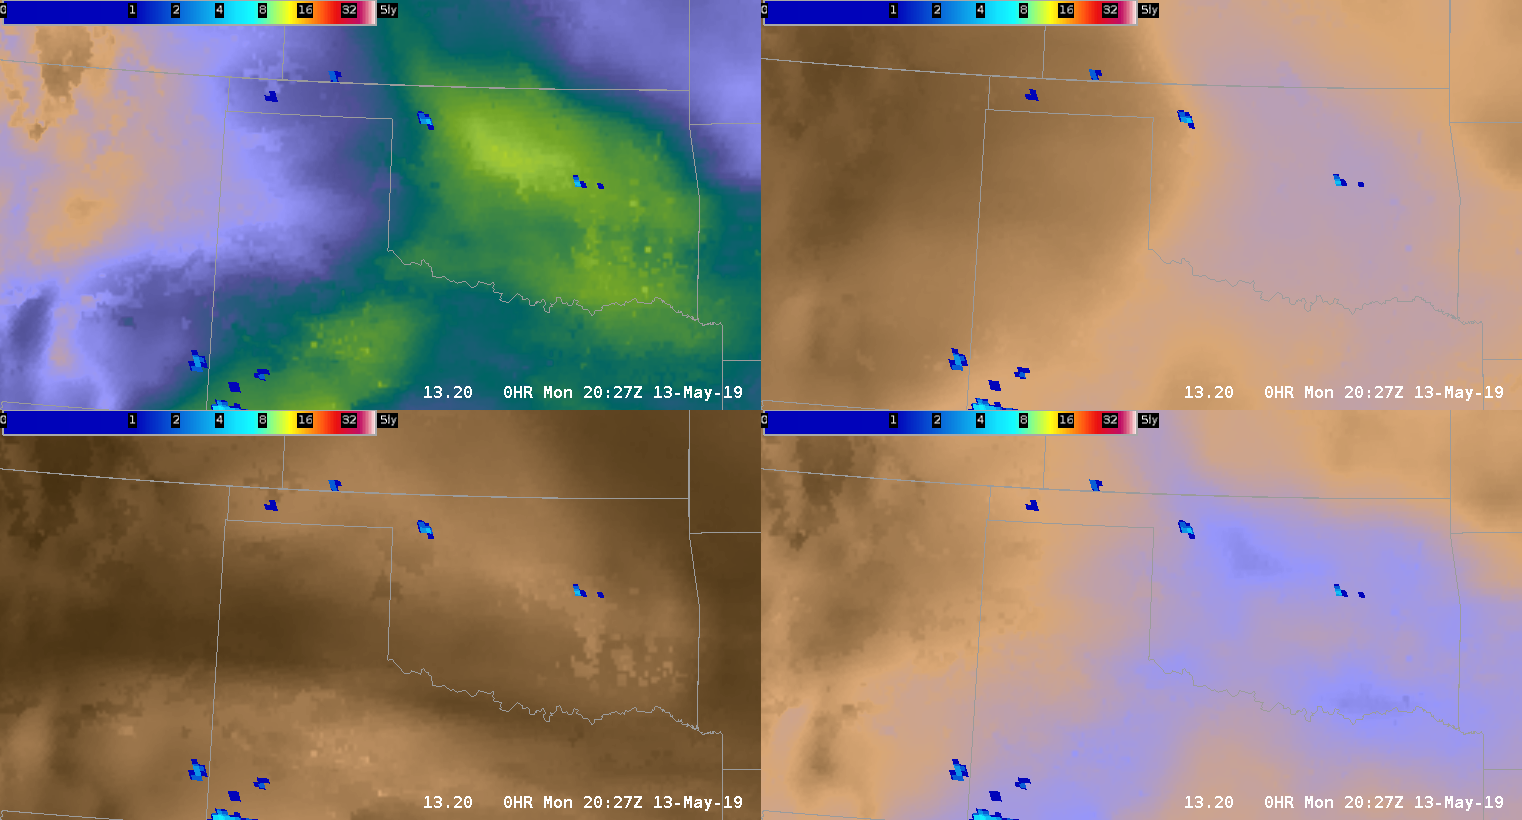
Separating threats in D2D with ProbSevere2
It’s nice to break out ProbHail, ProbWind, and ProbTor as separate displays (right hand column below) – something that is not even possible with the ProbSevere v2 placefiles.
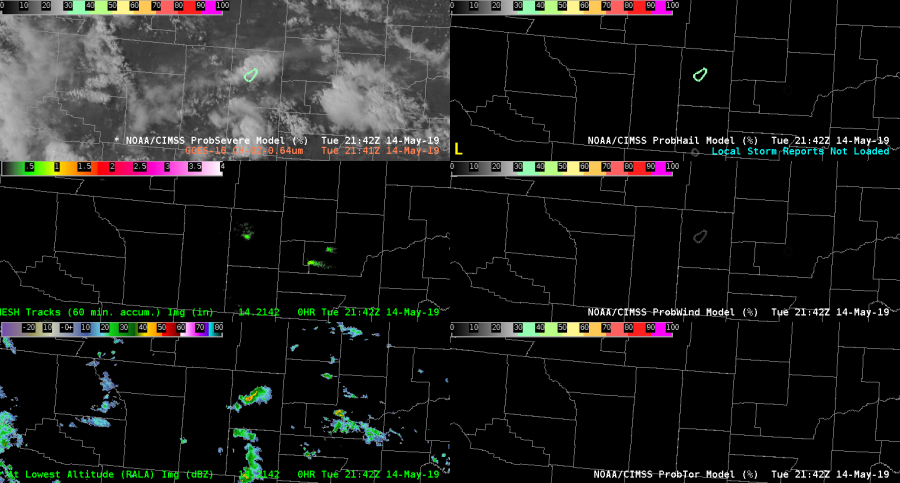
ProbHail was the greatest threat (far upper left panels), topping out around 33%, and culminating in a quarter size hail report (below, upper right). It’s been pointed out that ProbSevere has been much harder to calibrate out west where there are fewer reports and thermodynamics are different. So, it’s really all about trends instead of quantities.
#MarfaFront
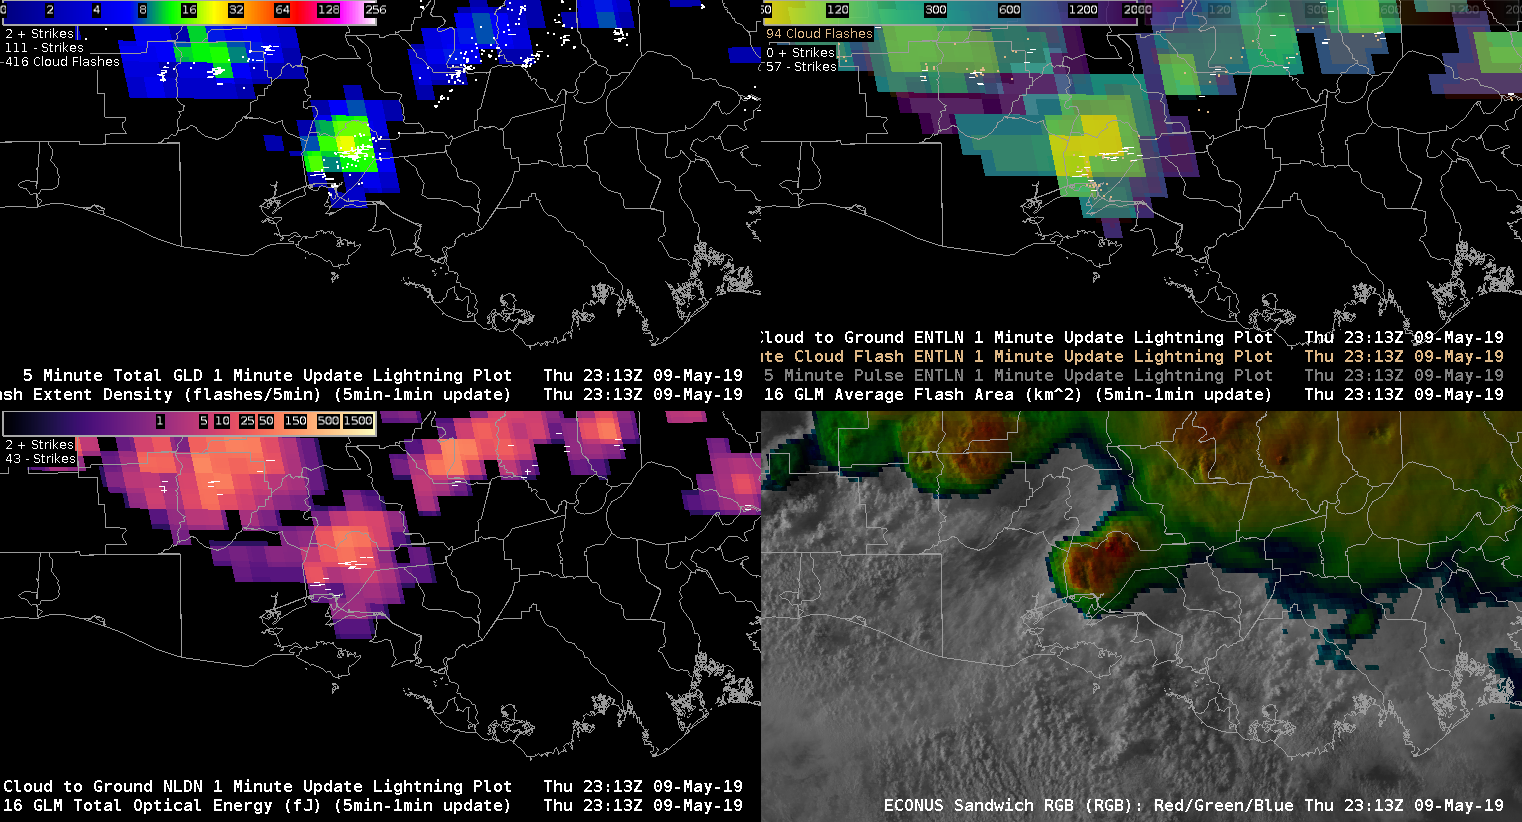
Wrappin’ my head around some other GLM stuff
Upper Left: 1-minute visible with 5 minute cloud flash (1-min update)
Upper Right: Total Optical Energy
Lower Left: GLM Average Group Area
Lower Right: Event Density
Bright yellow/orange colors on lower left depict a smaller average group area associated with a tighter concentration of flashes. We are intermittently seeing greater concentrations at the southern extent in an area otherwise associated with little activity.
Now taking a look at a specific time below…
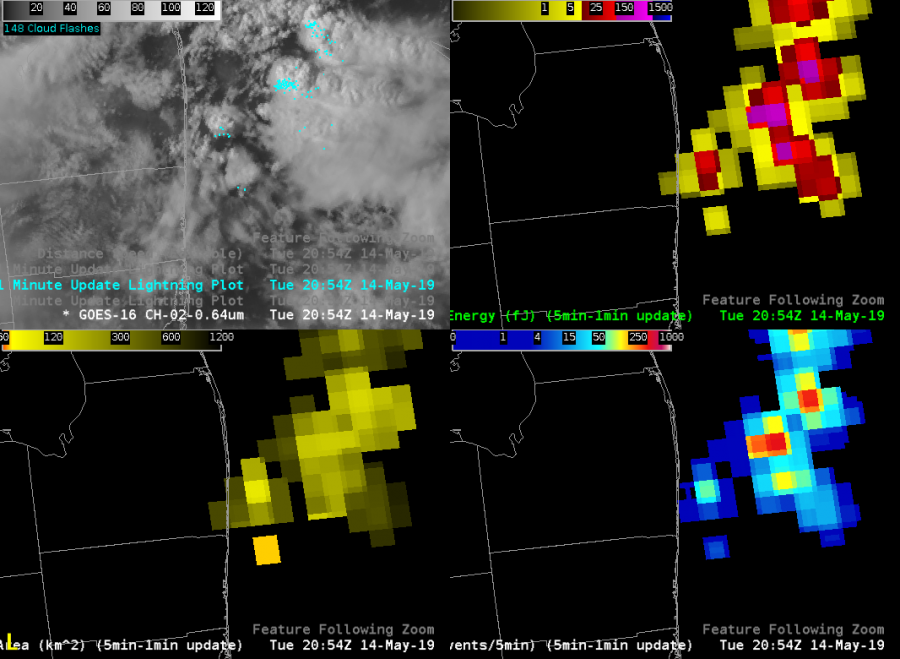
We see a single pixel of orange (lower part of lower left panel) corresponding with a small group area. This appears to be associated with two fairly isolated ENTLN flashes (upper left). Total Optical Energy (upper right) and Event Density values (lower right) are not overly impressive, which is not surprising, given the limited activity.
Now for something else that’s rather striking (ha ha) in the eastern half of this area. ENTLN cloud flashes depict two active areas in the northeast corner but little if any activity to the southeast beyond that. Shown another way…
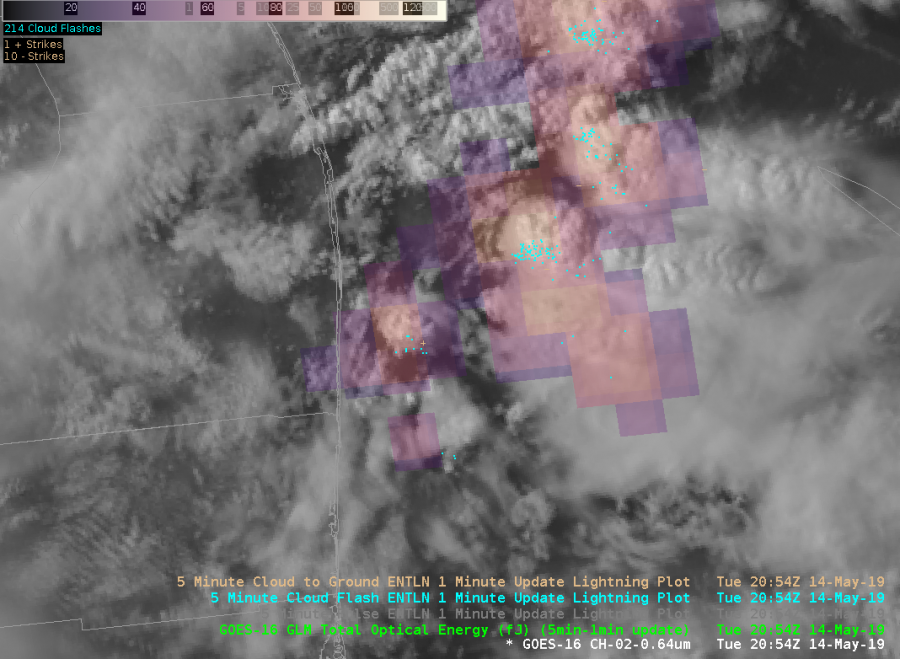 So, we see good connectivity in probable electrification from northwest to southeast that is not otherwise apparent in the flash data. So, I’m slowly coming around to the idea that this can be helpful for IDSS applications when lightning is a concern with multi-cell clusters featuring extensive anvil coverage.
#MarfaFront
AllSky vs. ProbSevere: Which MLCAPE is best and where?
When utilizing the AllSky CAPE image product (MLCAPE), and comparing it to the ProbSevere MLCAPE values for reliability purposes of both tools, it is noticeable the differences between the two when there’s precip. This is due to the fact that most rain areas will not be able to be sampled by the satellite (clear/cloudy), and will be utilizing the GFS data in these areas where ProbSevere is located.
One way around this difference reliability issue is to scan the surrounding areas that are utilizing satellite data (preferably a “clear” spot), and in those cases, the MLCAPE values sampled seemed more comparable to the ProbSevere MLCAPE (RAP) of the storm than that of the GFS sampled MLCAPE data. The GFS sampled locations almost always show a lower MLCAPE value than the ProbSevere MLCAPE. The downside of sampling farther away from the storms/precip areas is that you are sampling rather far away from the storm environment. It’s also difficult to say that the ProbSevere MLCAPE is more accurate or not and what the reliability factors may be.
Below is an example of a storm over TX that is sampling the MLCAPE of the GFS (green text) and of the ProbSevere RAP (white text). -shearluck
Fun 30 minutes of storms in Florida
There was a nice area of convection moving off the east coast of Florida with storms forming off an apparent outflow boundary moving to the south. As the storms moved off the coast they increased intensity exponentially. Focusing on these storms as they moved over water reflectivity showed max dBzs in the low to mid 60s with tops 45-50k ft high. GOES-16 Event density (5min-1min update) showed a value of 247 suggesting a nice updraft, which AzShear seems to further support with a bright white color and value of .007s^-1 exactly where the max dBzs/echo tops/GLM data is. In addition,prob severe did a good job of tracking the storms…but with the storms moving off the coast it is impossible to get any storm reports to verify its accuracy.
Utilizing all of this data I would most definitely want to issue a localized small craft or some sort of marine advisory or warning…if there was one for this are. -Desmond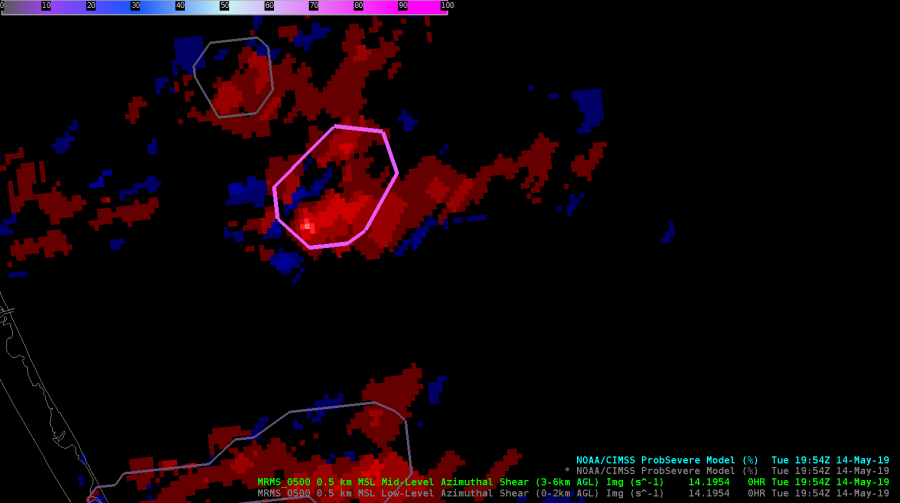
AzShear .007s^-1
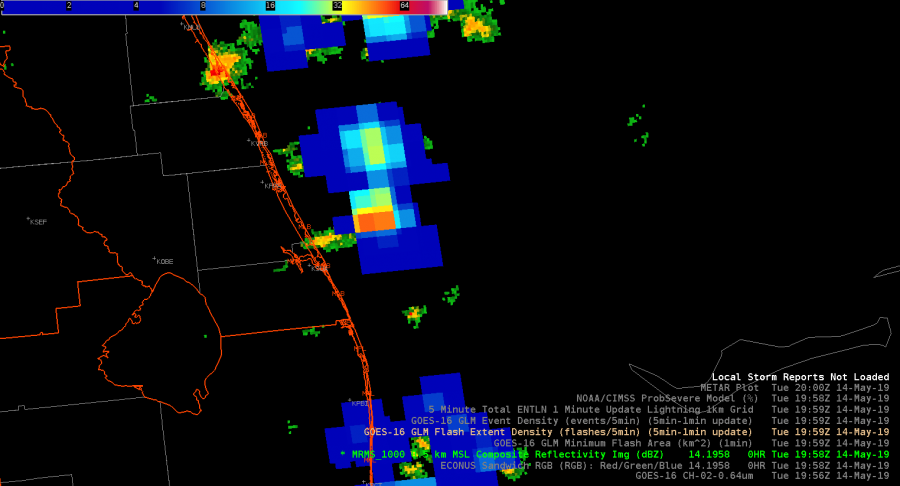
GOES-16 Event density (5min-1min update)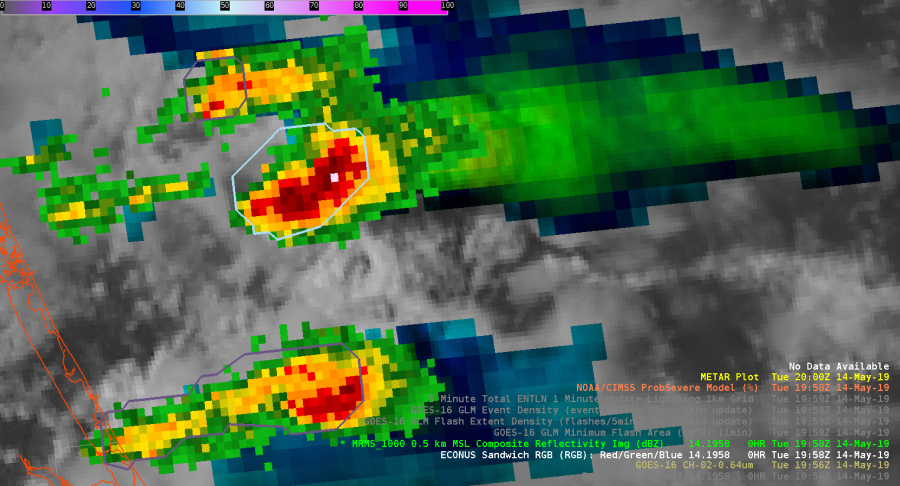
Max dBzs in the low to mid 60s
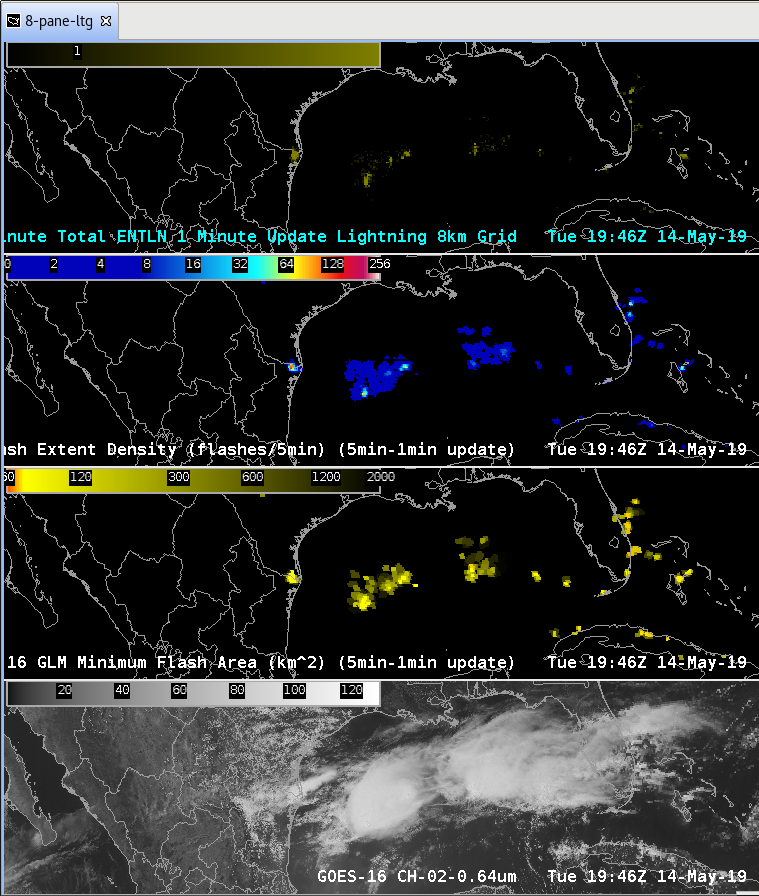
GLM detection efficiency over the Gulf of Mexico
When life hands you lemons (or for that matter, a bleak, moisture-starved convective environment draped over the entire CONUS) we can still make lemonade on this particular day by focusing on the Gulf of Mexico.
A question I’m asking all week when evaluating experimental products is: “How does this meaningfully improve upon what’s already operationally available?” My initial impression of GLM was that it’s merely duplicating efforts of ENTLN (except of course over the ocean where it’s unquestionably important given the lack of ground sensors exist). One of the better examples of this I’ve seen is below. In the panels below, looking south of Mobile, we see a much weaker signal in ENTLN total lightning grids compared to off the TX coast, whereas Flash Extent Density shows much more similarity between the two areas.
Another thing that was pointed up during discussion this morning: ENTLN pulse detection efficiency is *highly* variable across even the interior CONUS. This is because sensors are more clustered around metropolitan areas and therefore the number of pulse detections (and to a lesser extent, flash detections) can fluctuate quite significantly for completely non-meteorological reasons. So, I’m becoming increasingly convinced that GLM data might be a more useful sanity check than I previously thought.
Part of this experiment is to evaluate minimum flash area (botttom pane). To be continued…
#MarfaFront
Marginal Day in the HWT
Forecasters are beginning the day located in both the Melbourne, FL and Kansas City/Pleasant Hill, MO CWAs each with very different environments.
Ongoing convection with a focus on lightning is in store for forecasters in the MLB location. A (semi-stationary) frontal boundary across central Florida combined with the sea-breeze and plenty of low-level moisture is providing a decent environment for storms capable of producing lightning and high winds.
Forecasters beginning in the EAX region will likely be diagnosing the environment and pre-convective initiation products for the first half, if not majority of the operational hours today. Later today, we expected isolated convection to develop with enhanced lapse rates and associated increase in CAPE as well as increased low-level moisture. The HRRR doesn’t initiate convection until ~0200 UTC, but hopefully we will see activity a bit earlier.
-Kristin Calhoun
Convection on LL PW Gradient
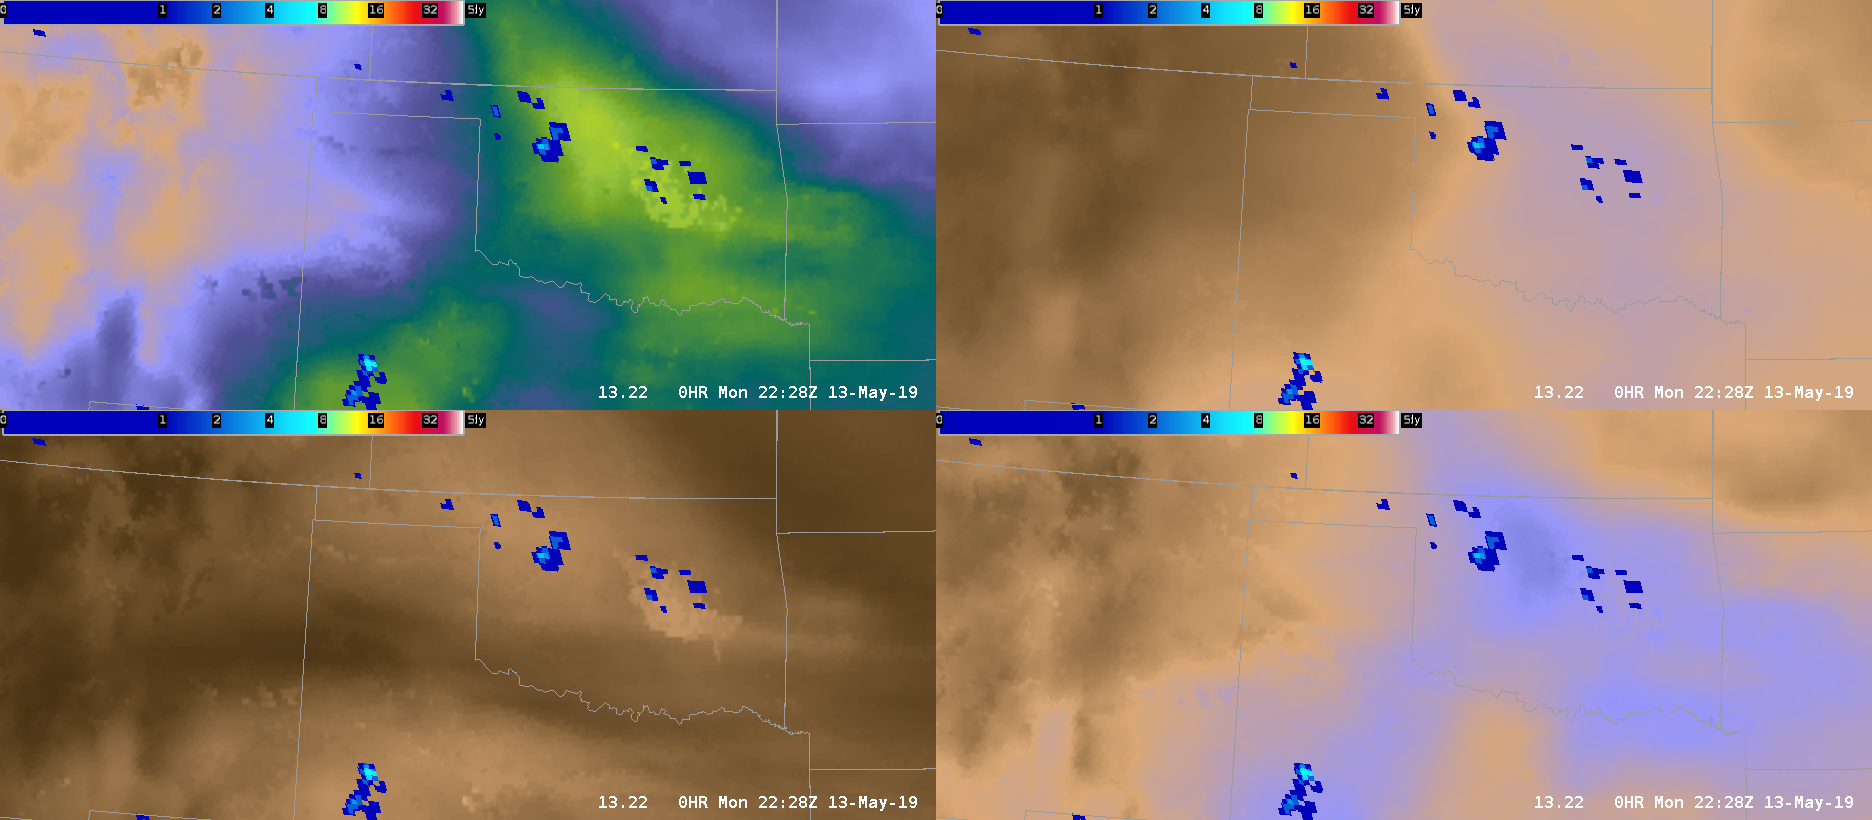
Convection began along a low level PW gradient across NW OK per GLM Flash Extent Density. Expected forecast: Based on steering flow, the storms should move into a more moisture rich environment and expand in coverage.
A little while later…Storms continued to expand eastward along the gradient into the more moisture rich environment.
-Tempest Sooner
unstable NUCAPS soundings east-southeast of TX convection
The 1921Z NOAA-20 overpass is now in and there are many valid soundings to east-southeast of convection in west Texas. Several soundings indicate CAPE above 1500 J/kg with a few soundings over 2000 J/kg. Below is a short loop of GOES-16 channel differences between 1.6-2.1 microns and the NUCAPS sounding quality control.
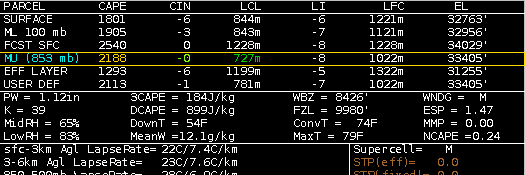
The black circle indicates the selected NUCAPS sounding depicted below with MUCAPE of 2188 J/kg.
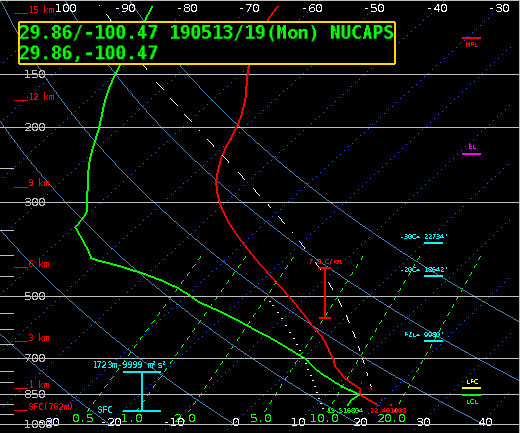
This sounding (centered on Edwards County) as well as neighboring soundings were obtained over fairly homogeneous terrain and surface topography doesn’t appear to be complex and therefore problematic for near surface layers. These soundings are near the edge of the NOAA-20 swath, thus they are much larger than the nominal 45-km spatial resolution at the center of the swath.
Brian Kahn
WHOA NUCAPS!
As we were wrapping up the work for the day, an updraft rapidly grew over part of the CWA we were in. I went back and looked at NUCAPS FCAST CAPE data that I had originally discounted as discussed in a previous blog post. While it appeared at the time that the NUCAPS FCAST CAPE values weren’t viable from a forecast perspective, turns out this storm fired off the edge of the CAPE gradient that the NUCAPS FCAST represented better than the RPM13.
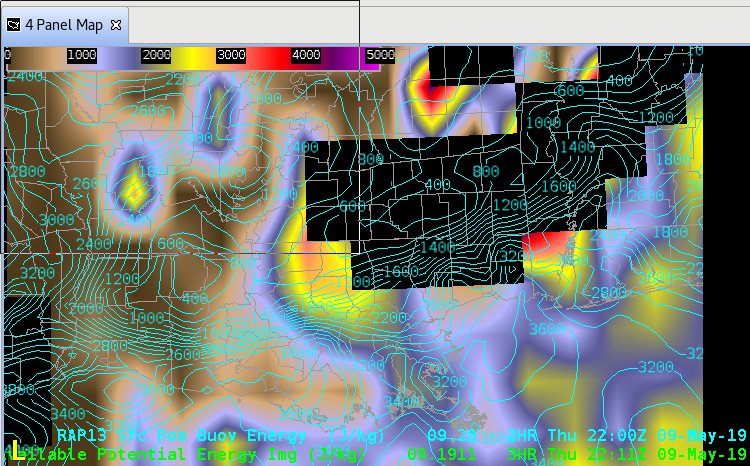 This was my first exposure to NUCAPS FCAST this week as it wasn’t available….it’s worth a second look. It’s also an indication that you need to work hard and diligently through the end of the shift!
-icafunnel