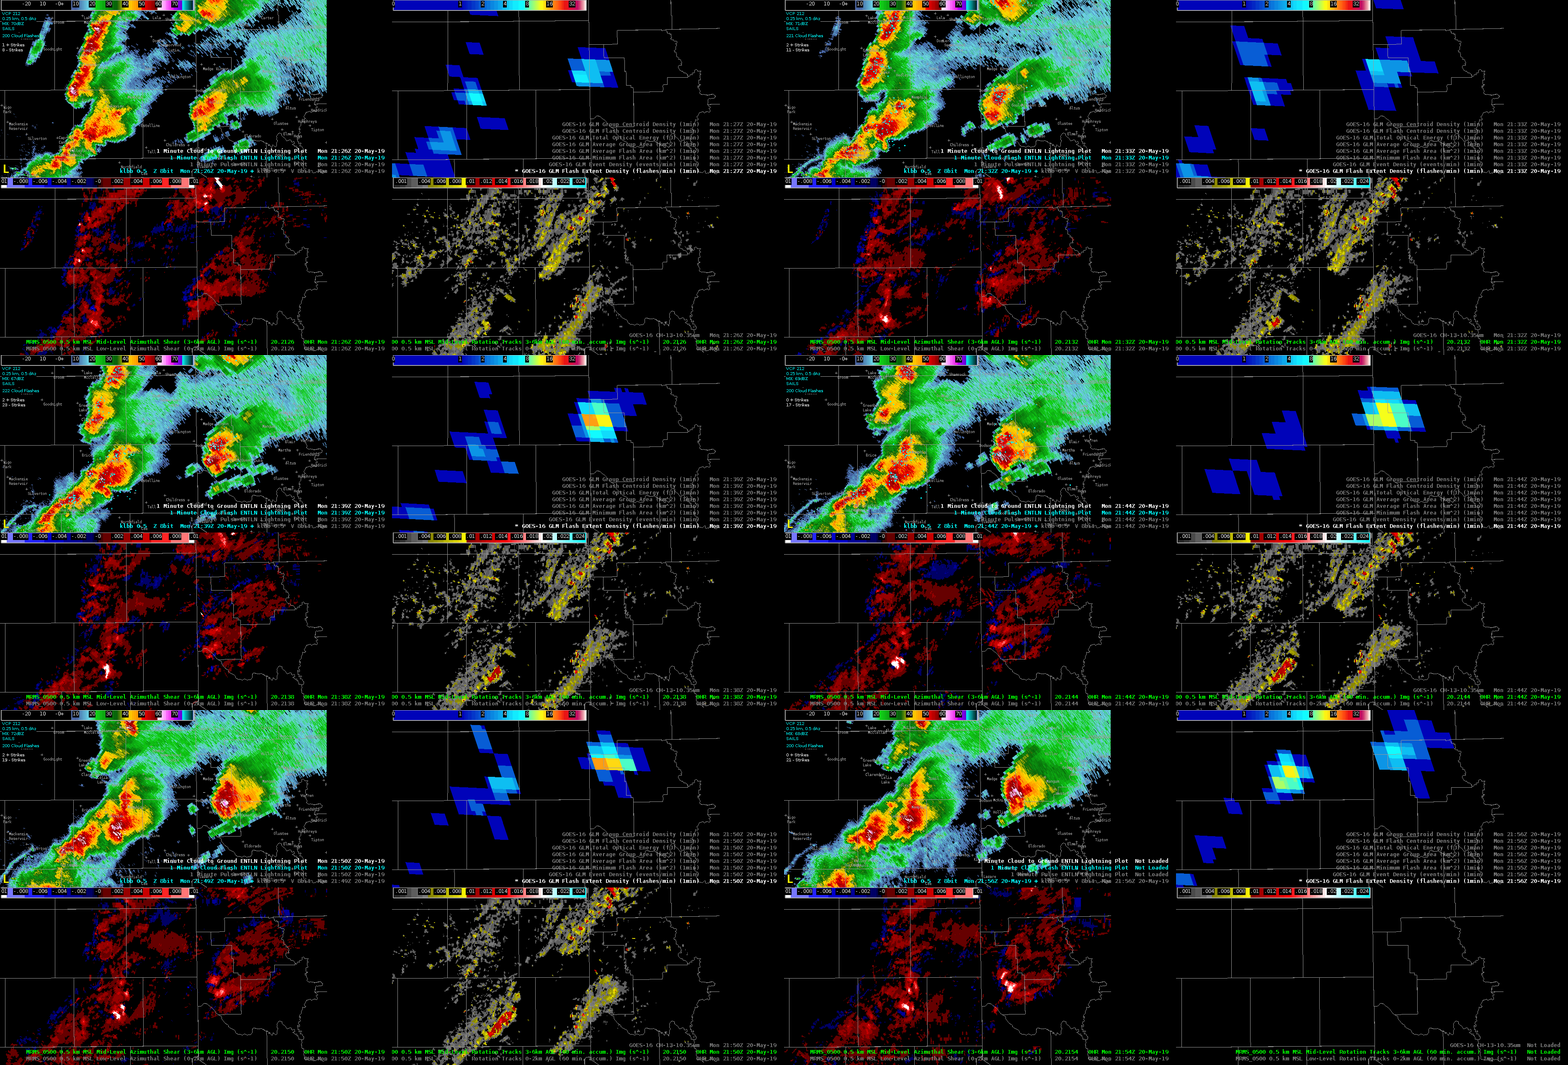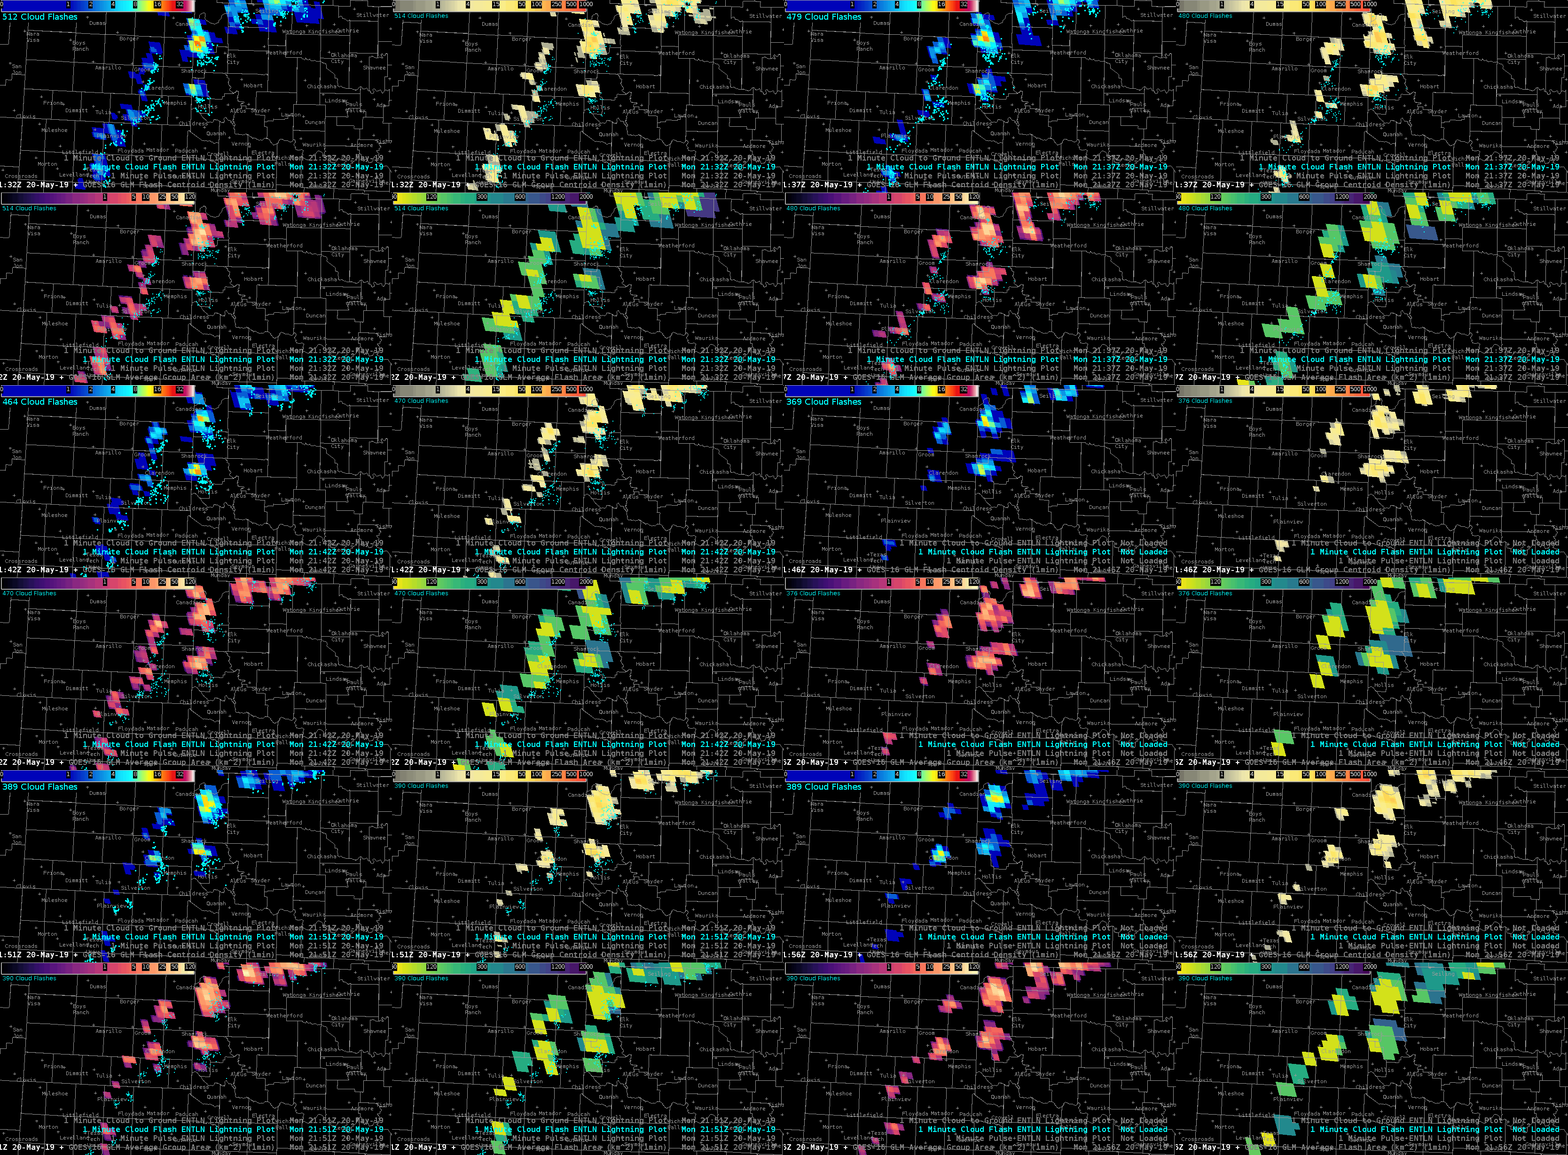
 Storm of interest is the supercell NW of Childress, TX. Increase in ENTLN lightning occurred before a substantial increase in the 0-2 km and 3-6 km MRMS azimuthal shear. The signal in the GLM flash extent density product was muted in comparison to ENTLN data. ProbTor went from 12% at 2124Z to 52% at 2130Z. At 2140Z, ProbTor peaked at 91%, which corresponded with the maximum 0-2 km MRMS azimuthal shear (0.20 S-1) associated with this rotation track. I frequently use the ENTLN data in operations and am trying to incorporate GLM products.
So far, the most useful GLM components, largely because of their visual representation and relationship to updraft growth rate or intensity, are the flash extent density and total optical energy. These two products helped me maintain situational awareness on individual storm intensity trends. Plotting the flash extent density and total optical energy in a four panel with GOES IR imagery and base radar data, I can quickly decipher which storms pose the greatest risk for severe weather. Roy
