
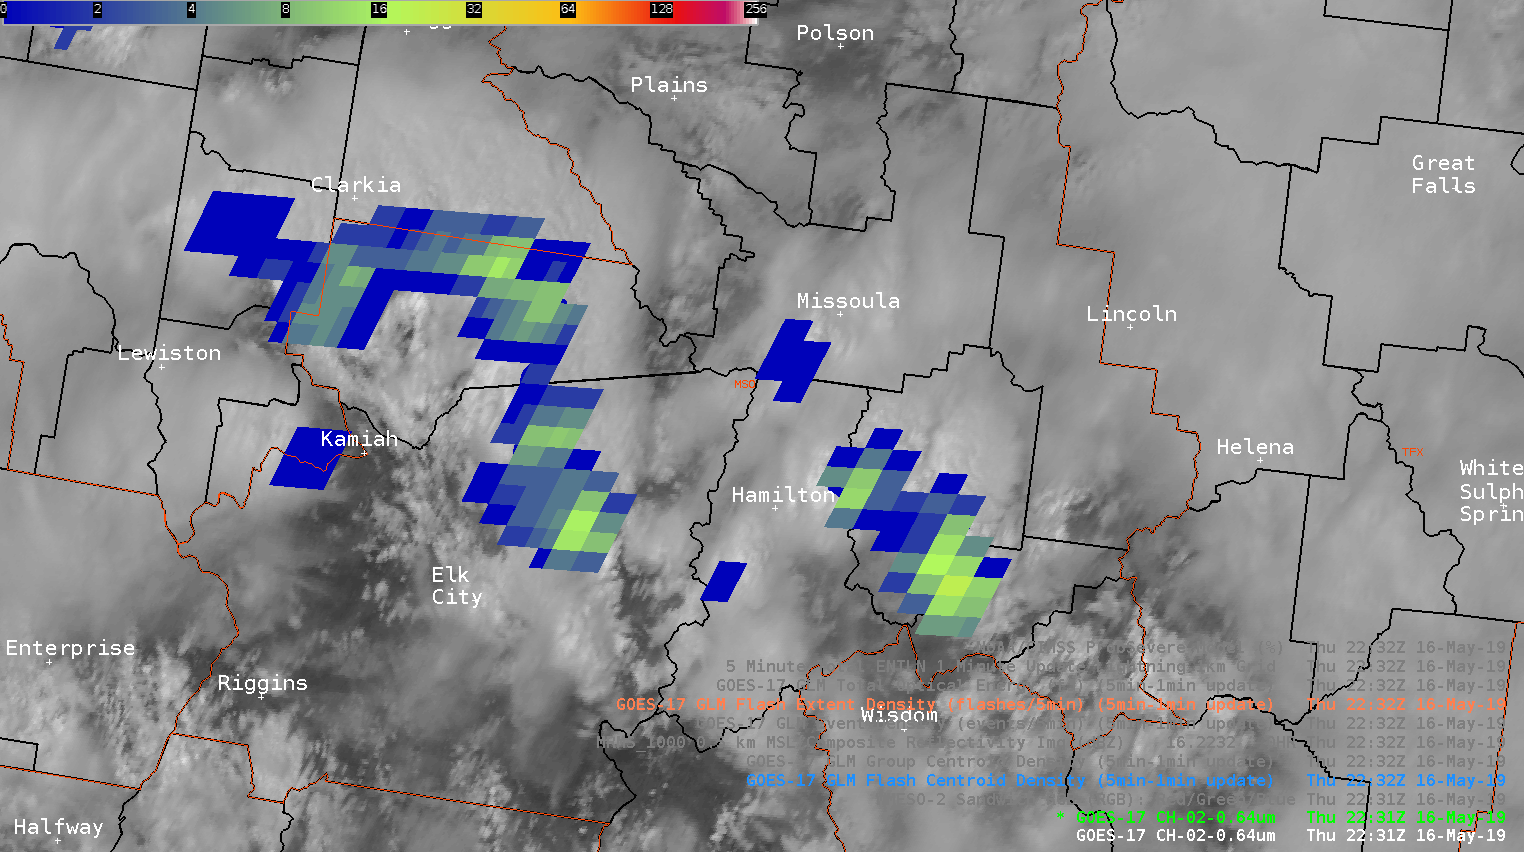
Viewing some marginal severe storms in northern Idaho from GOES 17 in this example. In the first image is the traditional Flash Extent Density product. However, have modified the color curve (User -> Awips -> GLM_FED_DC) to provide some enhancement to the lower values as detection efficiency seems to remain lower over ID/MT as we have found in MT/WY in previous days. While this is overall helpful in picking out some stronger storms, the large 8km grid boxes take up a lot of screen real estate when viewing over background satellite imagery. Also the strongest storms are somewhat lost in the lightning data of the surrounding storms.
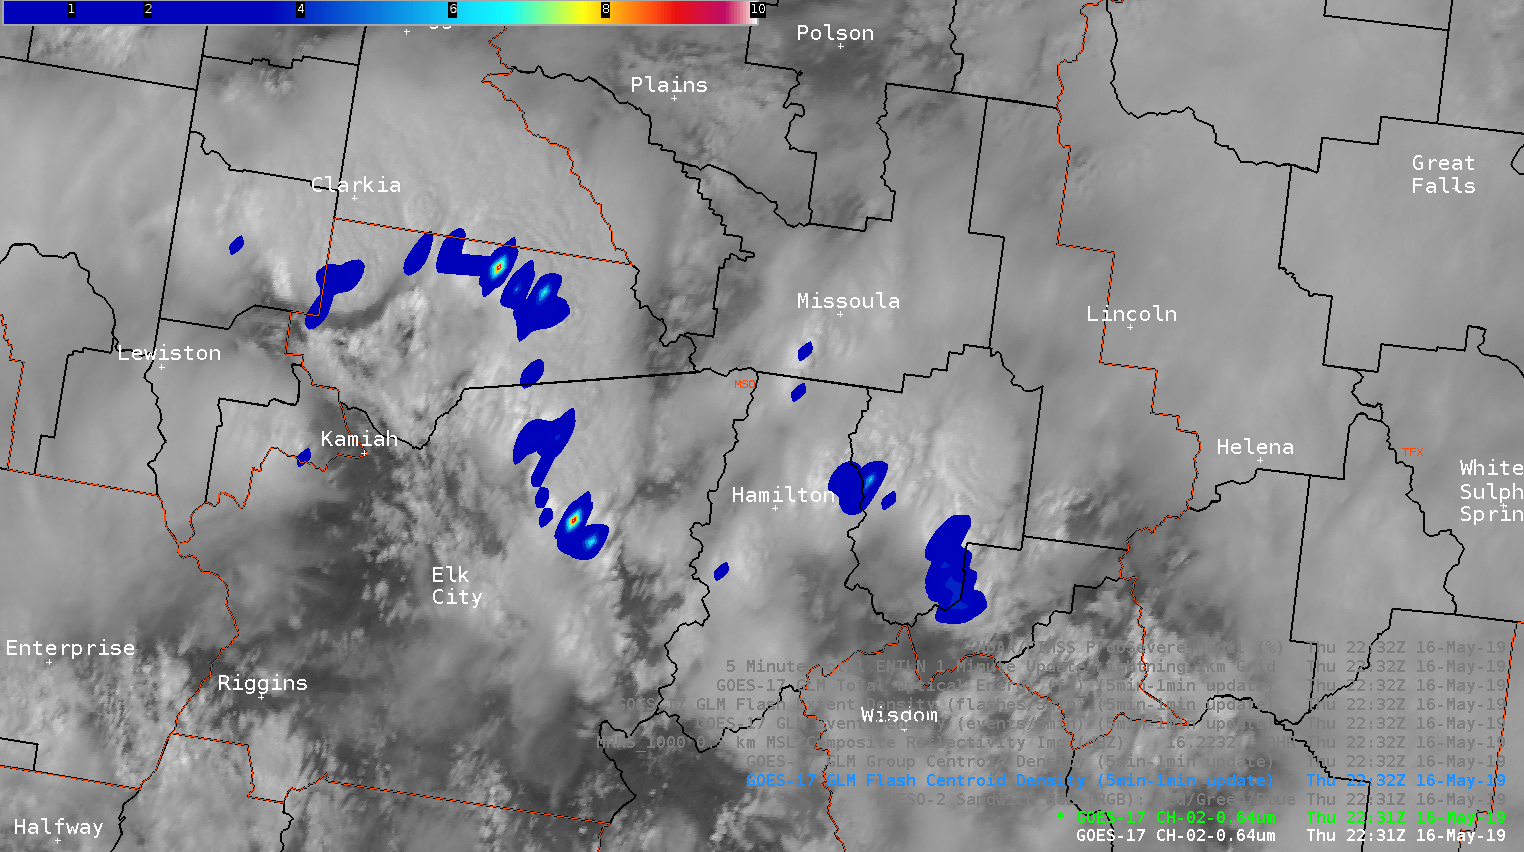
As an experiment, tried loading up the Flash Centroid Density Product. By turning on the interpolation and setting the max value to 10, this really helped to isolate and highlight the strongest cells. Of note is the cell moving toward the north, west of Missoula. Picking out the lightning jump in this storm was easier viewed on this Flash Centroid Density product, and comparing its strength to surrounding storms was also easier. It is also helpful that the product has overall small footprint.
— warmbias —