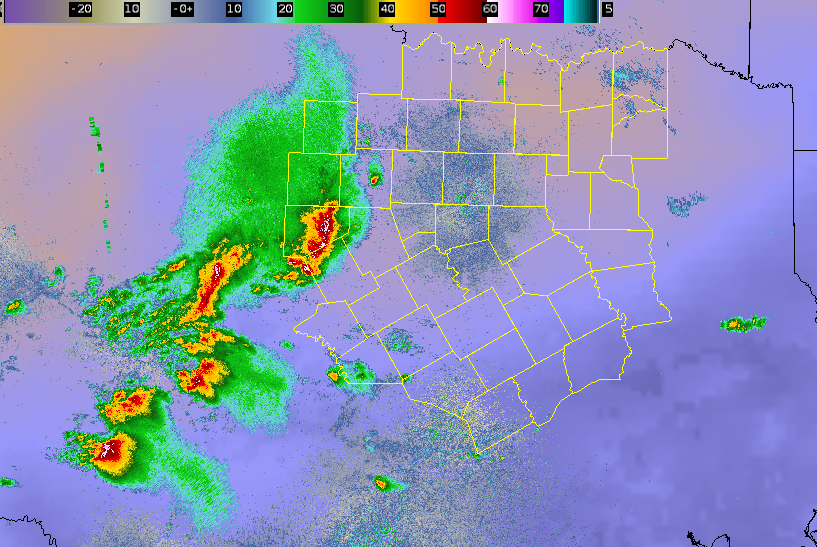
This loop shows how AllSky LAP CAPE behaved as convection evolved through the event. You can see which cold pools related to which thunderstorm events. Allsky Lap captured several of these cold pools including a large one over central texas.

This loop shows how AllSky LAP CAPE behaved as convection evolved through the event. You can see which cold pools related to which thunderstorm events. Allsky Lap captured several of these cold pools including a large one over central texas.
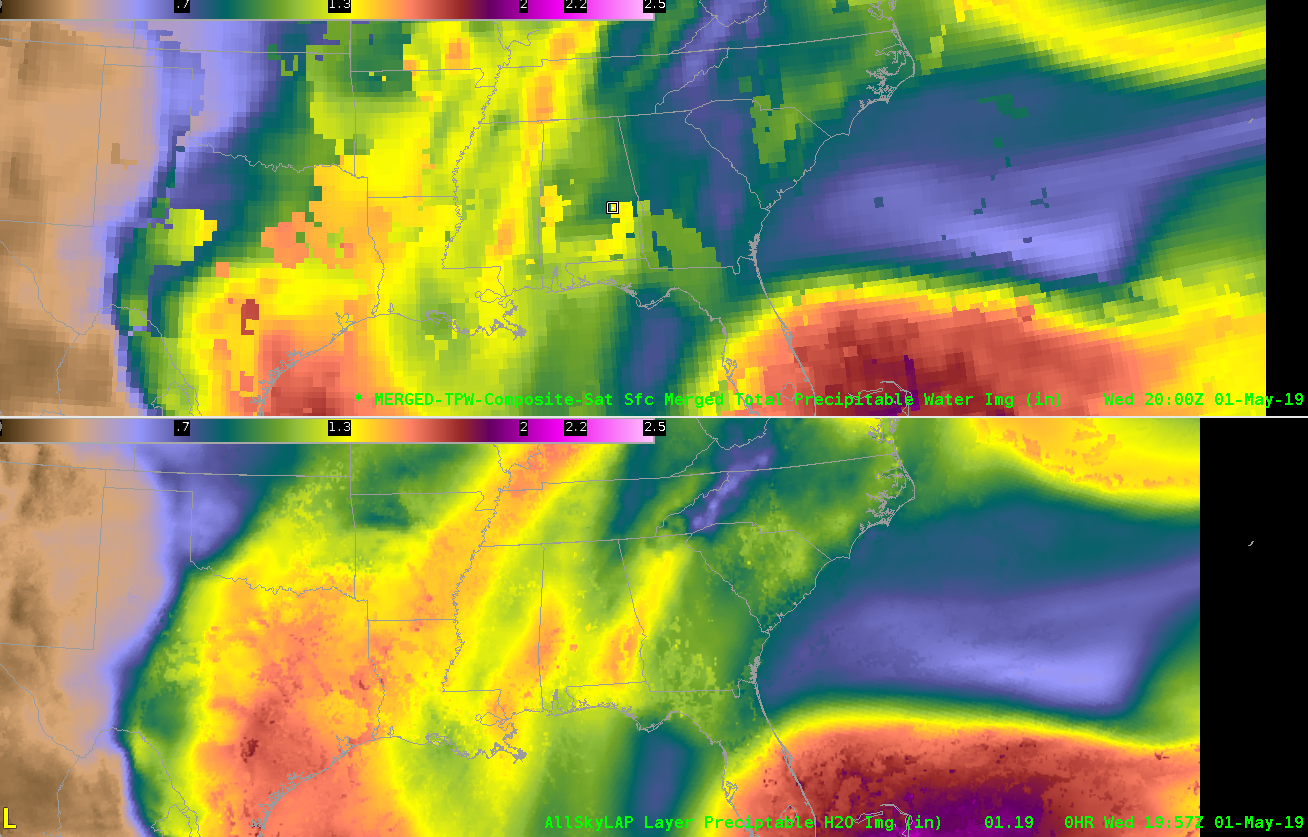
There has been considerable examination of the All-Sky LAP products (PW and CAPE) this week, and for good reason – they’re quite good. I wanted to take a quick look at how the All-Sky LAP total PW compared with the merged TPW product. The All-Sky product is on the left and TPW on the right. I overlaid the 20z 1 hour RAP PW forecast for comparison. Ignoring the higher resolution of the All-Sky, the very broad distribution of enhanced and depressed values are similar in location between the two products. However, the TPW values are considerably lower than both the All-Sky and the RAP forecast. Further, pulling the 21z SPC mesoanalysis PW shows that the All-Sky tends to be the better of the two satellite products.
The TPW seems good for very broad generalizations, but if given a choice between the two in operations, I’ll take the All-Sky, All-Day Every-Day.
–Stanley Cupp


The AllSkyLAP PWAT compared fairly well with surface conditions and the merged product however it struggled in the wake of the front/dryline and was too generous with the PWAT values when compared to earlier UA obs. Values in the warm sector were more representative (higher) than the merged product.
— SCoulomb
The AllSkyLap CAPE captured the overall footprint of the CAPE when compared to the SPC mesoanalysis even down to the cold pool in the wake of the disorganized MCS north of EWX CWA. Values themselves were however much lower than actuality.
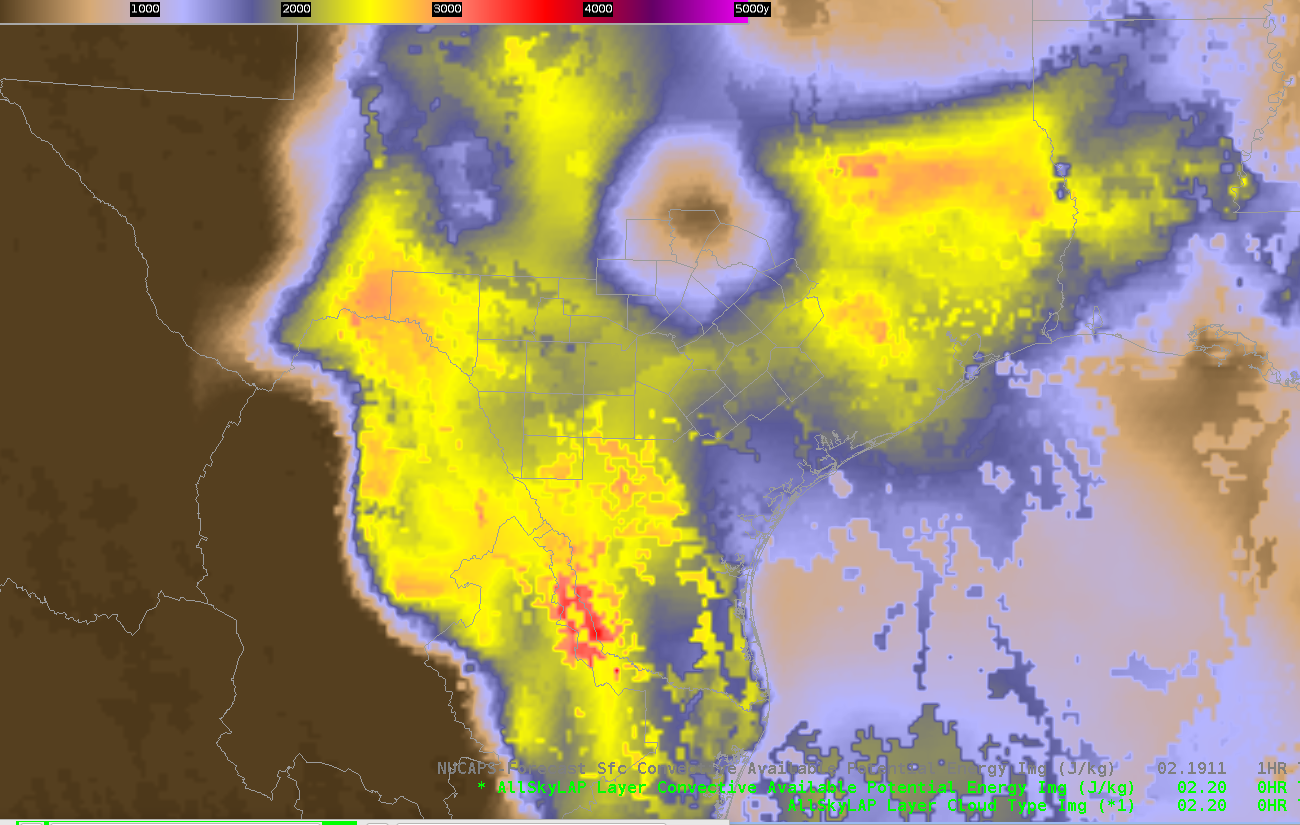
AllSkyLAP CAPE
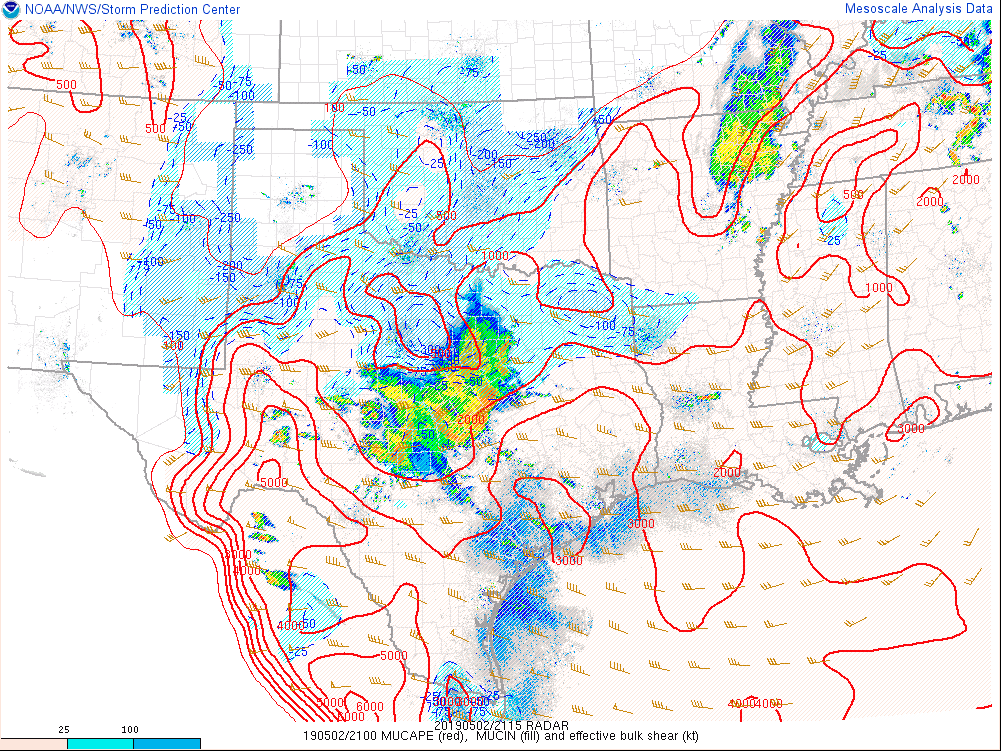
SPC Mesoanalysis MUCAPE
— SCoulomb
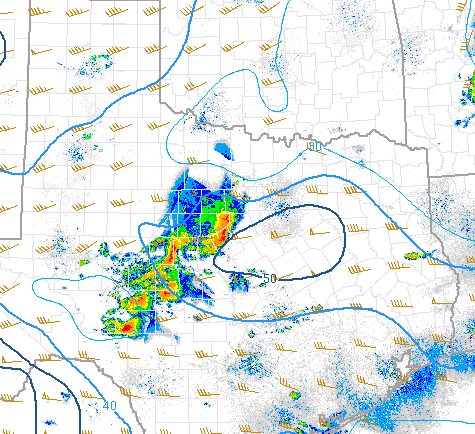
Favorable 0-6km shear aloft from SPC Mesoanalysis page above across FWS CWA
All Sky Total PW above shows deeper moisture in southern FWS CWA.
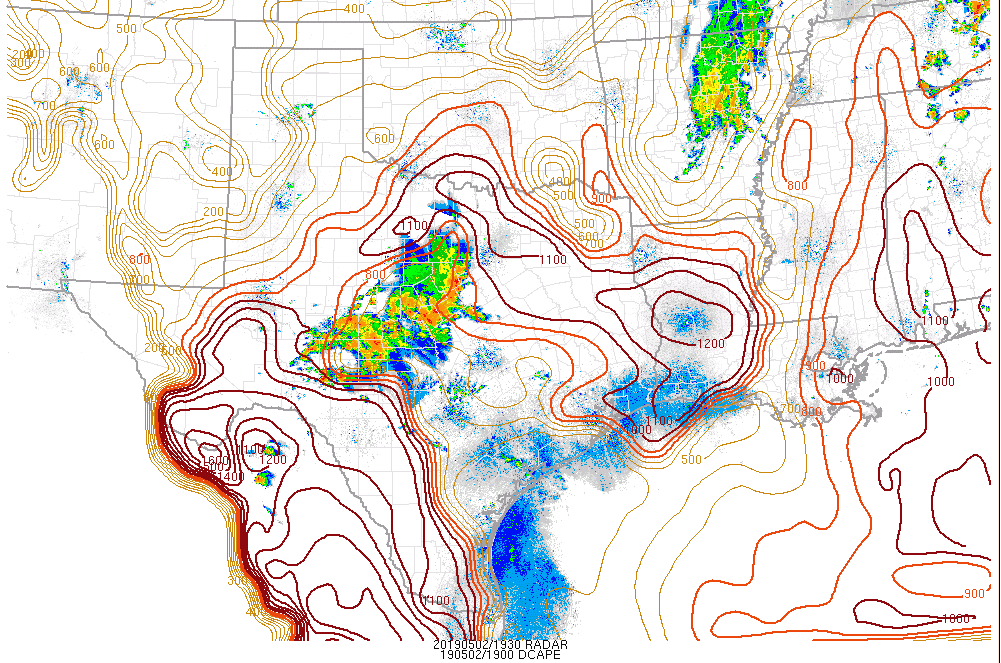
High DCAPE values across the FWS area per SPC mesoanalysis page above

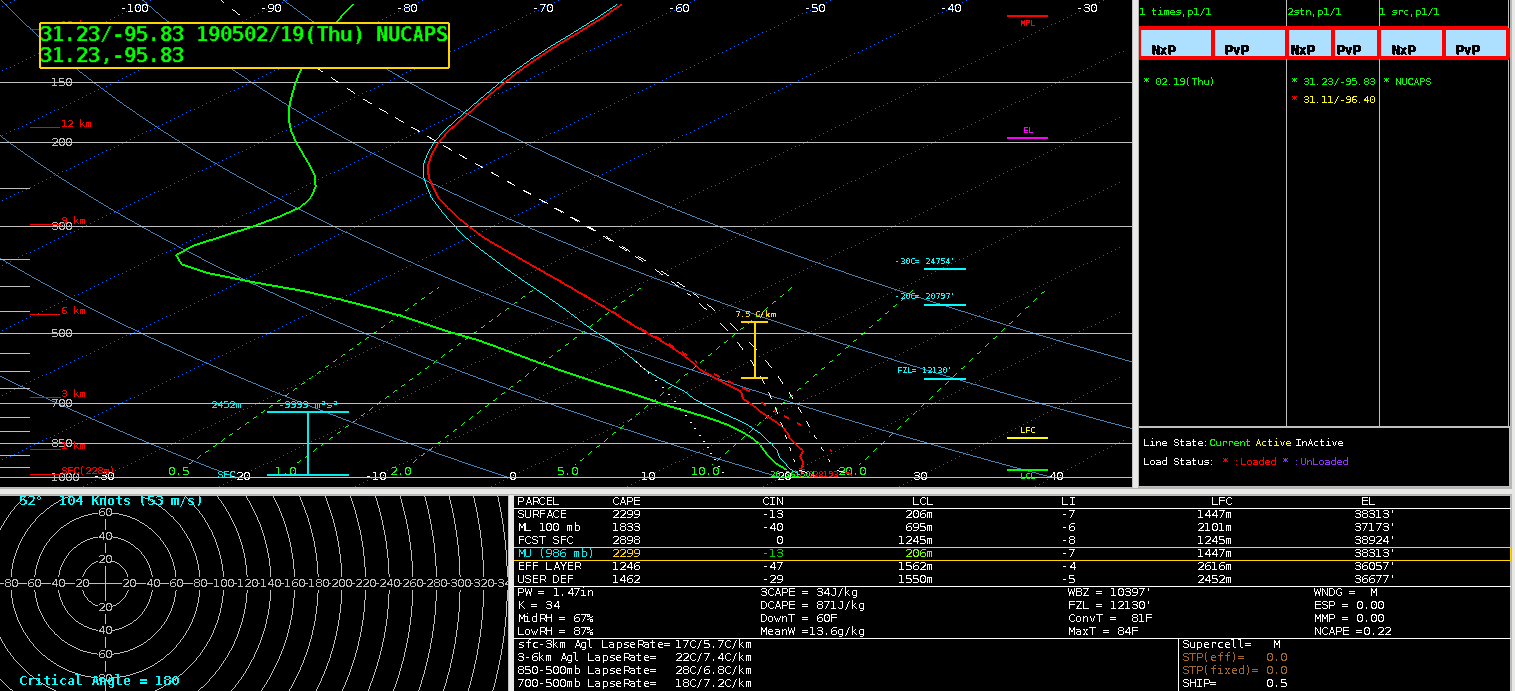
Mesoscale Discussion…40-50kts of wind shear aloft and high DCAPE values show conditions favorable for severe winds to occur, mainly for locations where All Sky total PW shows strong moisture gradient along surface front in southern part of the CWA.

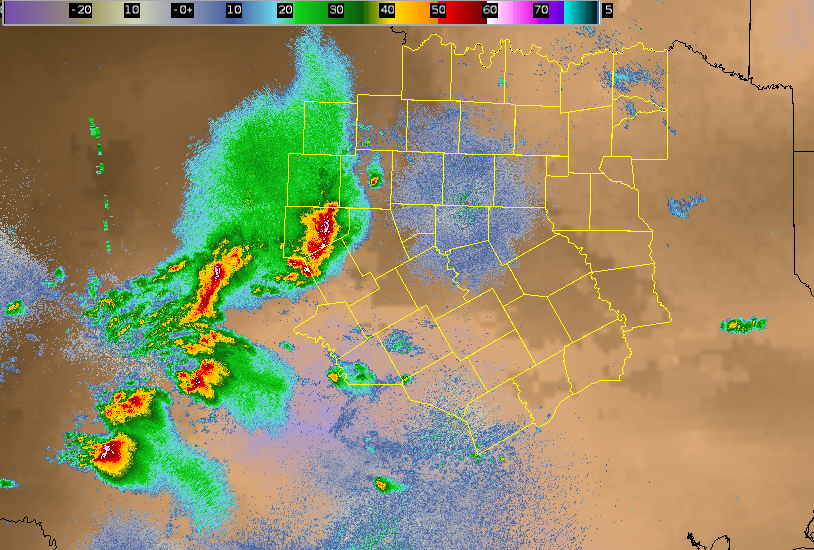
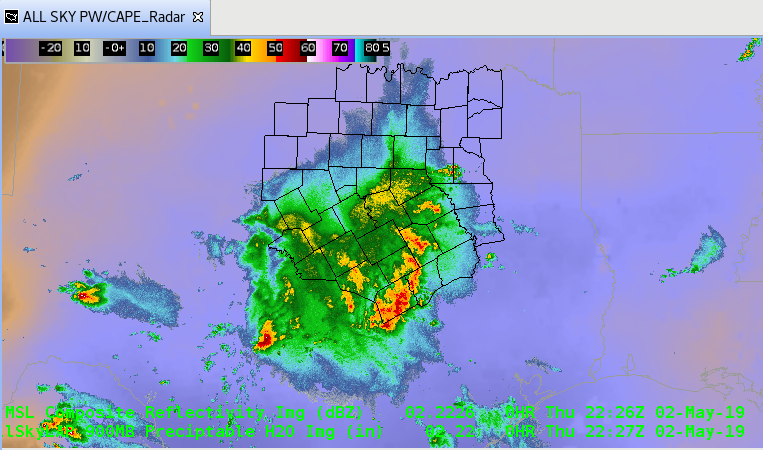
This is a loop of radar and All Sky LAP CAPE. Notice the higher CAPE values in the southern part of the CWA. This is were linear convection could grow upscale become surface based and capable of produce damaging winds. -Jake Johnson
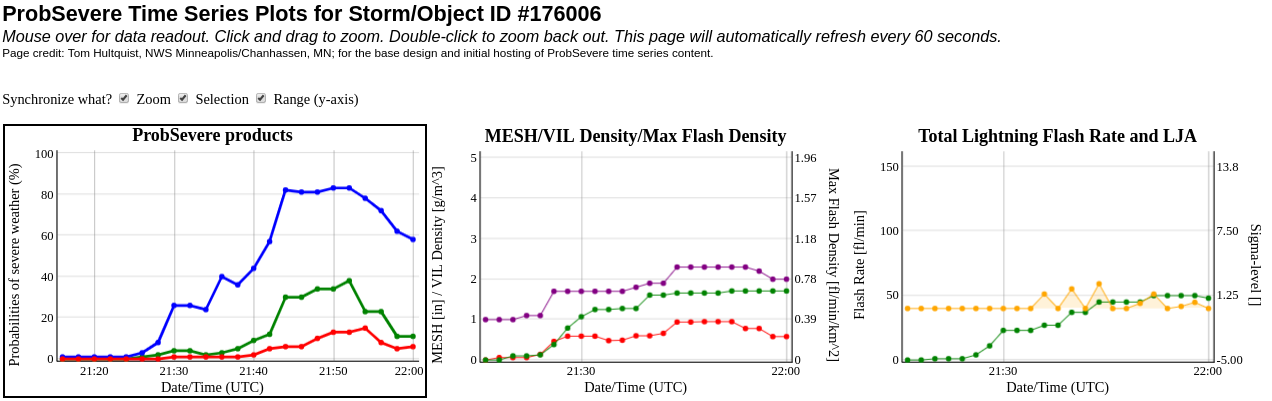
The ProbSevere Wind spiked to 80% with a thunderstorm that later moved across southern FWS CWA, which was our area of concern.
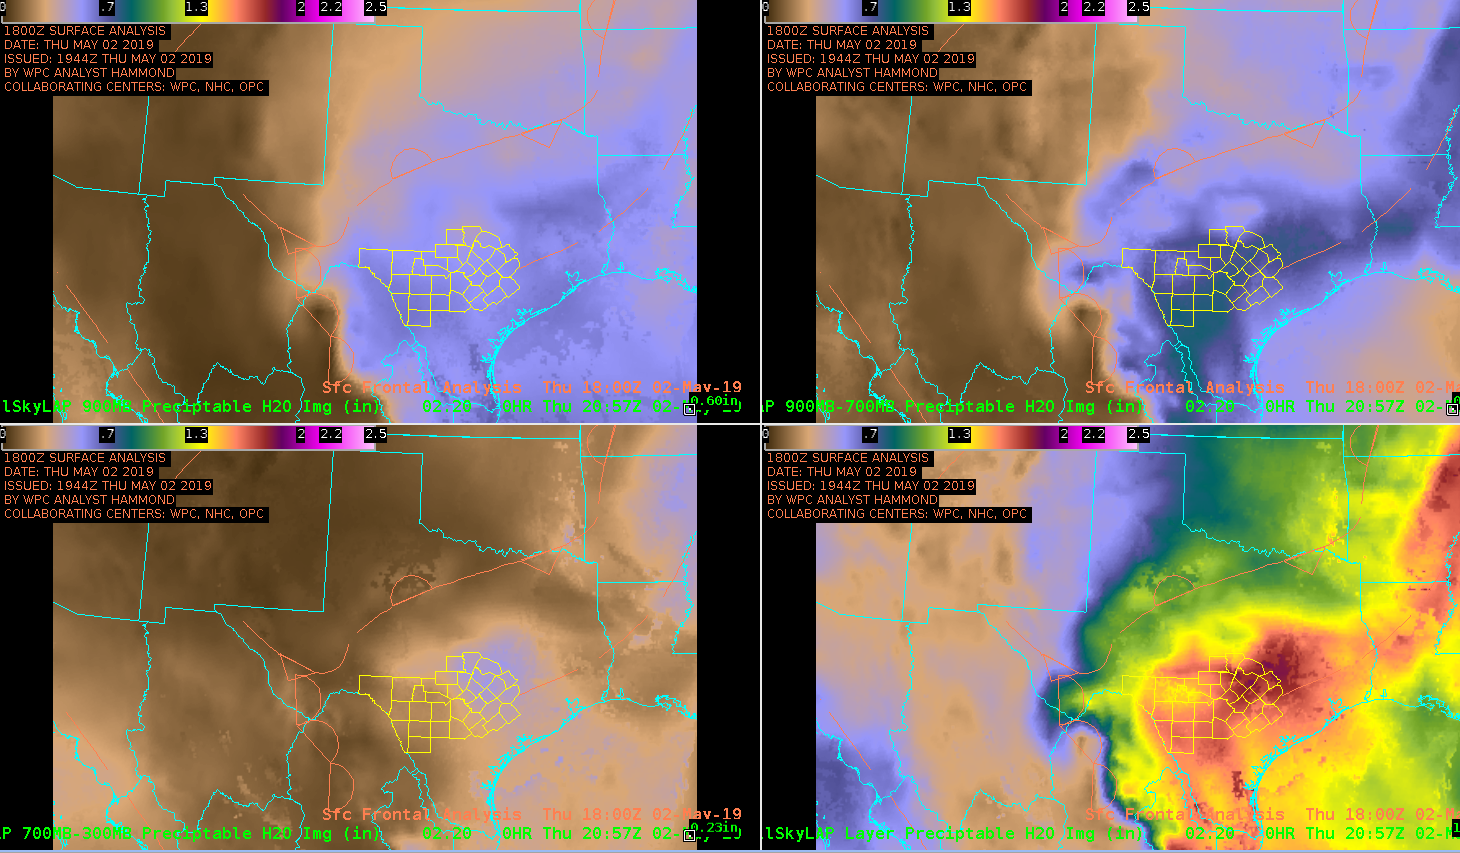
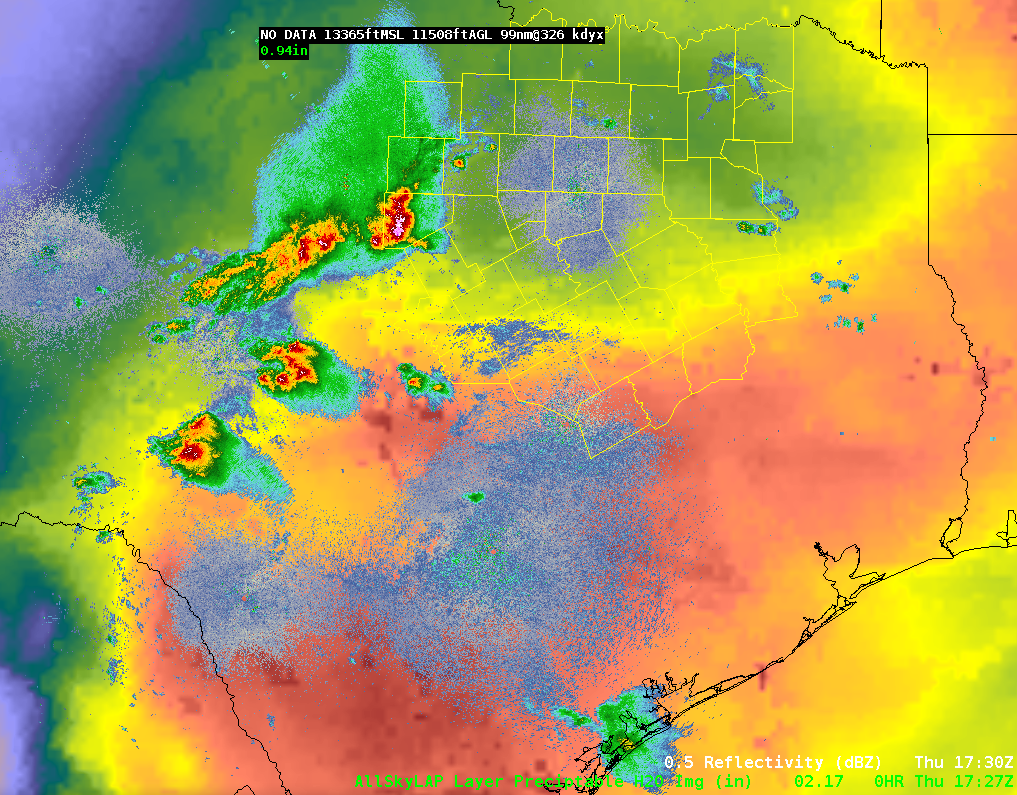
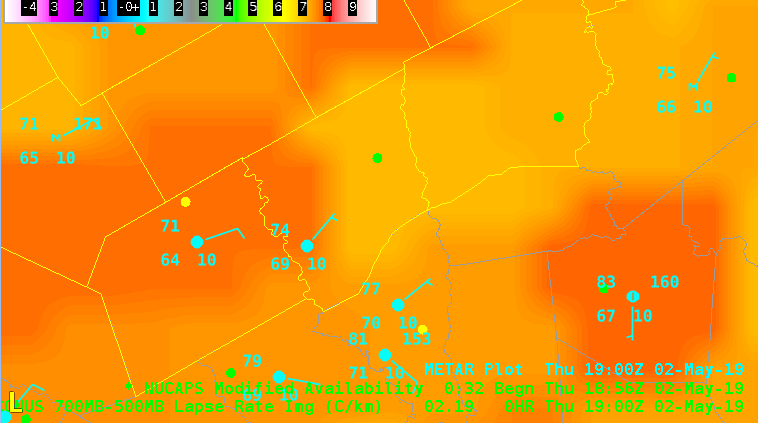
Monitoring environment downstream of convection entering FWD forecast area around 1830 UTC on May 2. Top image is the sfc-900 mb ALLSkyLaps PW illustrating higher moisture over southern portion half of the FWD CWA. Bottom image is the 700-300 ALLSky Laps PW illustrating much drier air above suggesting convective instability. SPC Mesoanalysis RAP downdraft CAPE (not shown) also suggests axis of highest DD Cape in this region suggesting environment supportive for damaging winds as line segments moves across the FWD area later this afternoon. – Quik Twip


All Sky Layer PW Surface-900mb All Sky 900-700mb layered PW

700mb analysis from SPC Mesoanalysis, shows good warm air advection across Dallas/Forth Worth CWA. The All Sky 900-700mb layered PW product shows good west to east moisture gradient across the central part of the CWA associated with the 700mb warm air advection signal. -Jake Johnson
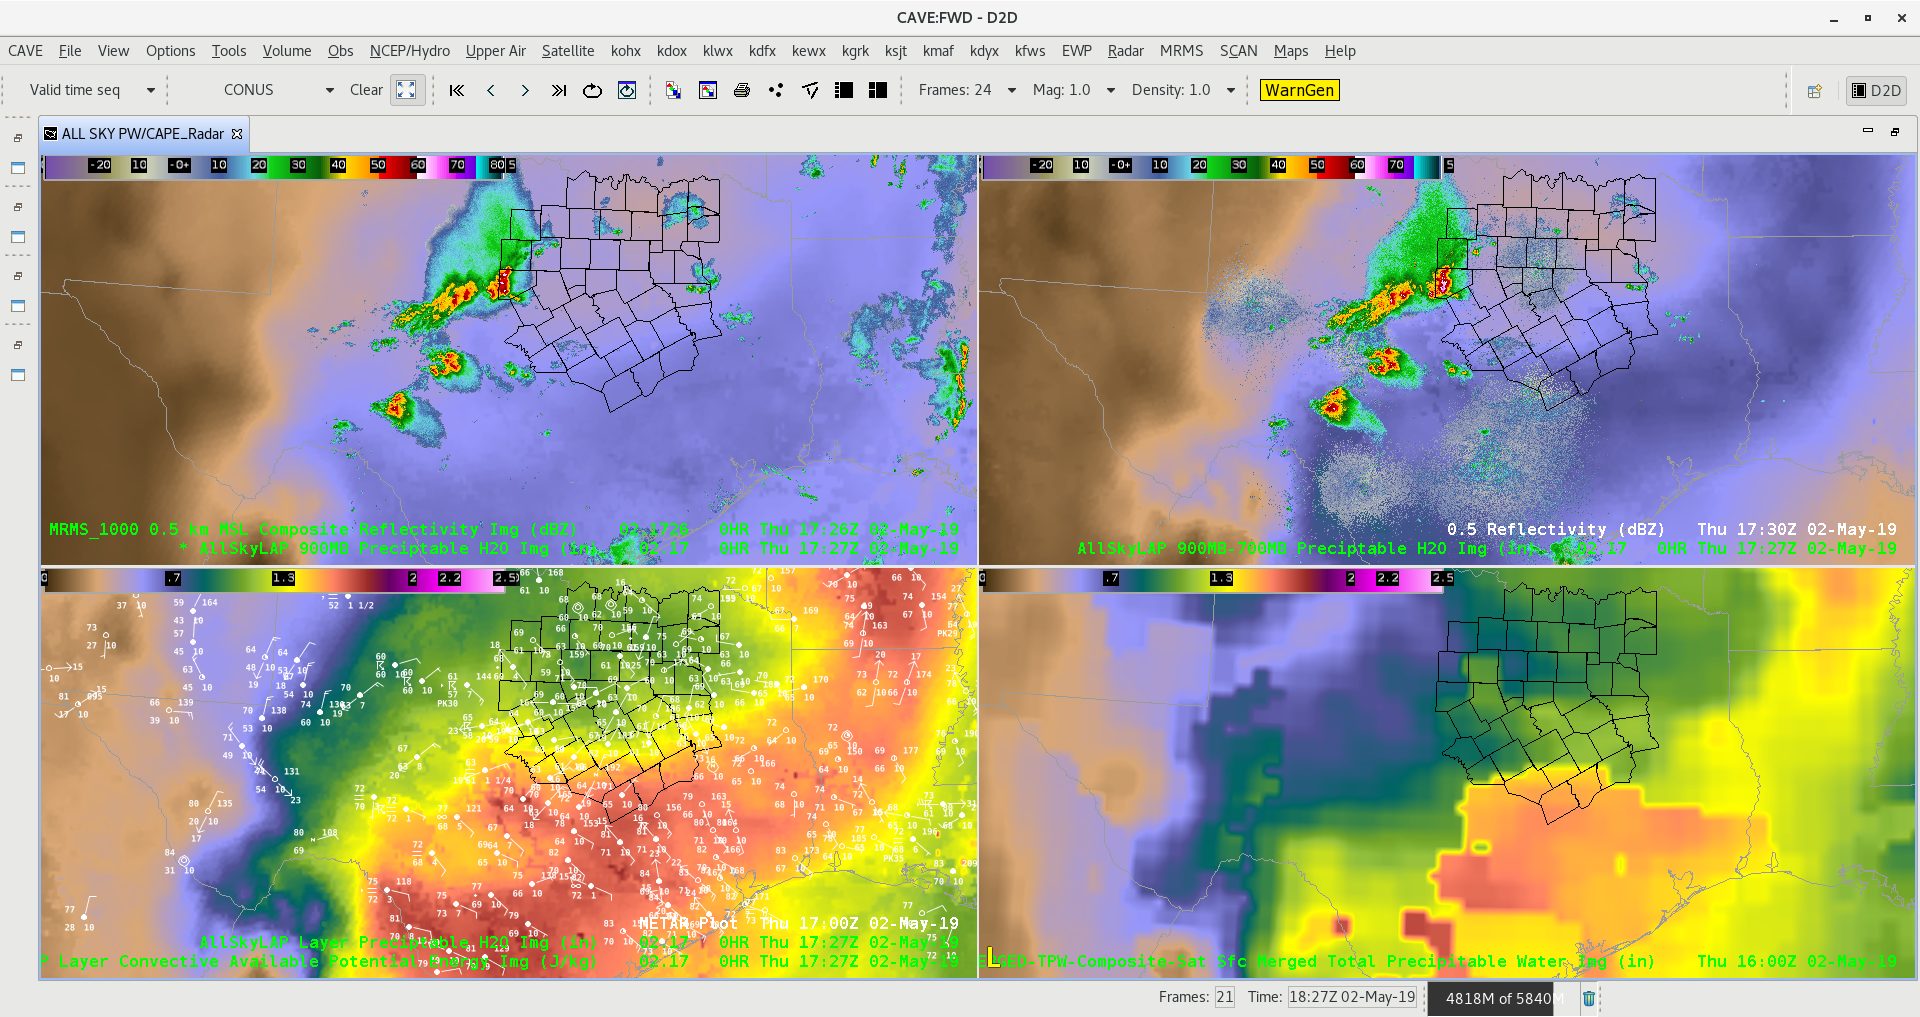
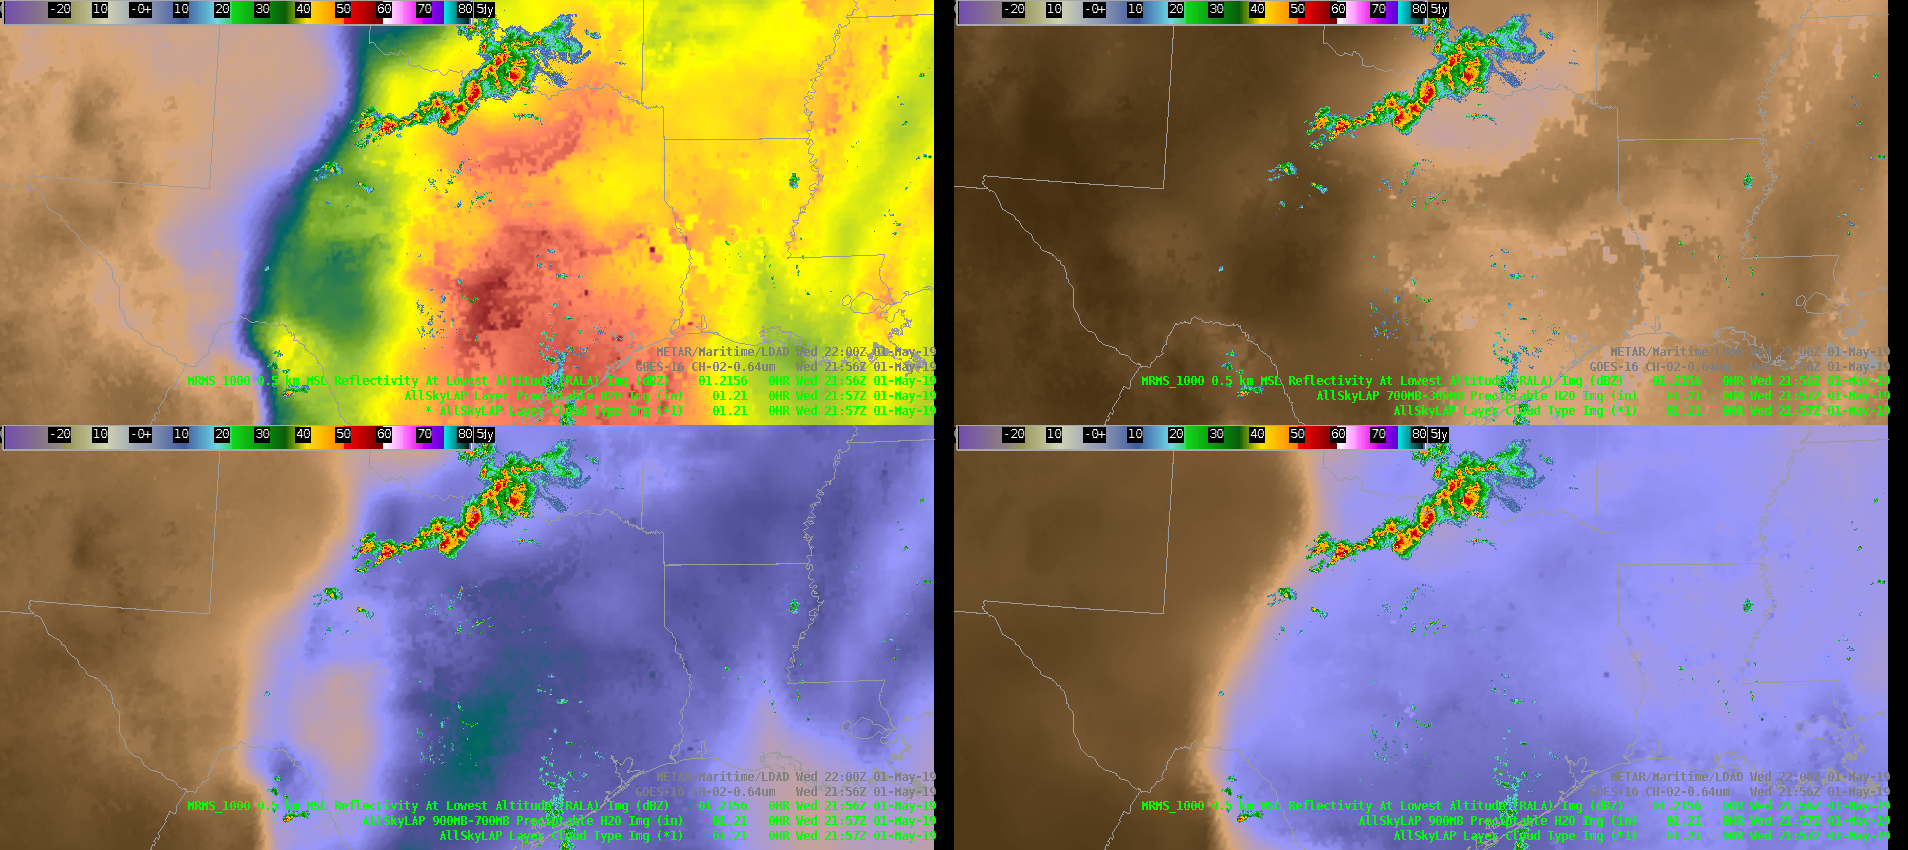
Figure A
All sky continues to handle total PW better than CIRA Merged Total PW looking at the bottom two frames. Notice the westward expansion of better moisture in the All Sky which matches up with surface obs compared to much lower values further west on Merged Total PW.
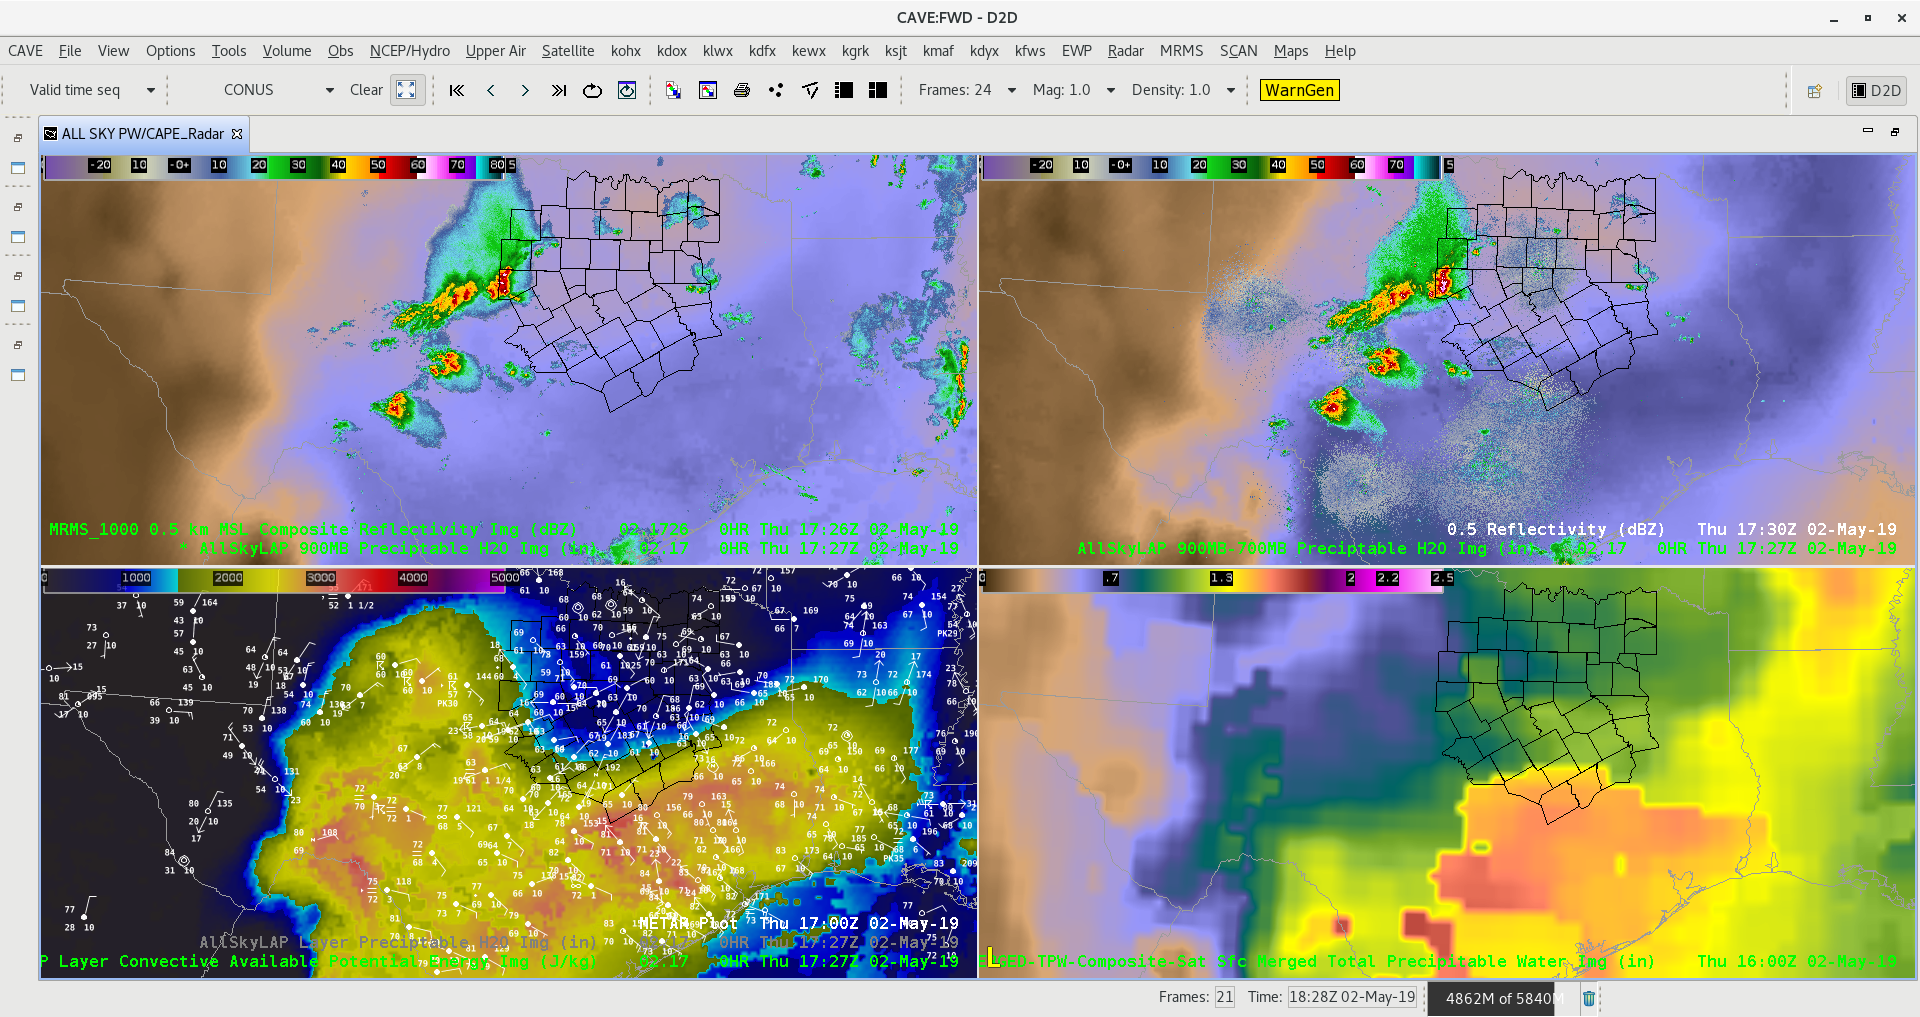
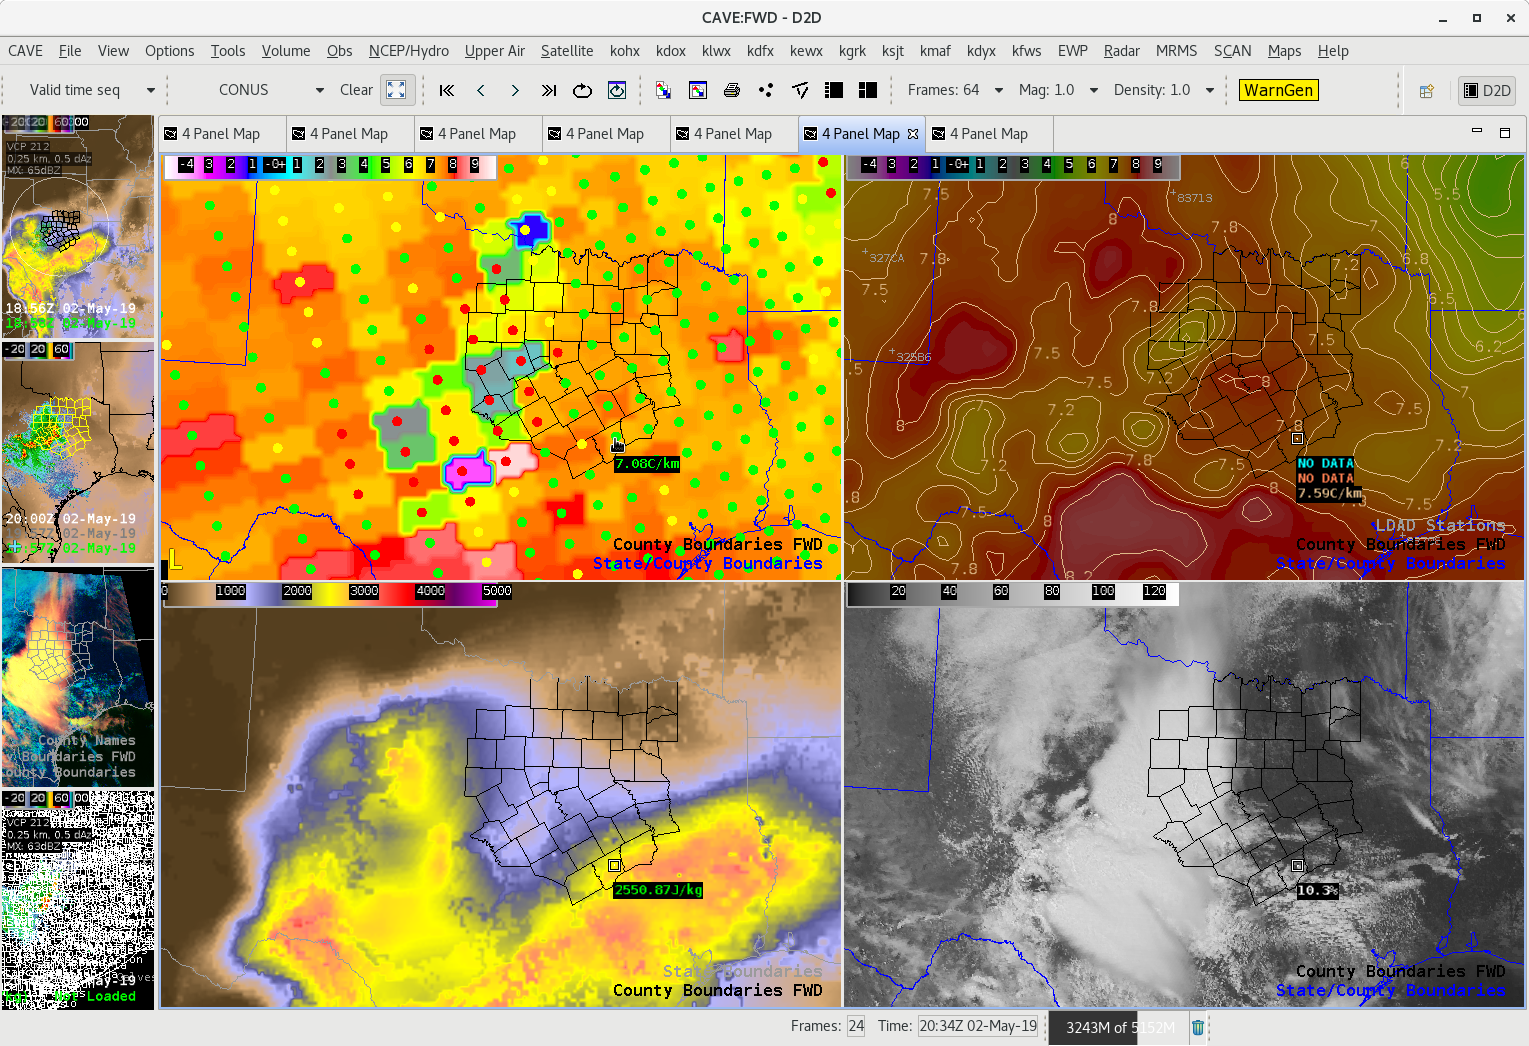
Figure B
Looking at the lower left panel for CAPE in the All Sky product we see a well defined instability gradient in southern FWS area which has our interest for higher probability of severe weather. Storms across central and northern parts of Dallas/Fort Worth area will be elevated, however storms that develop in southern part of the CWA could become surface based along the instability gradient. -Jake Johnson
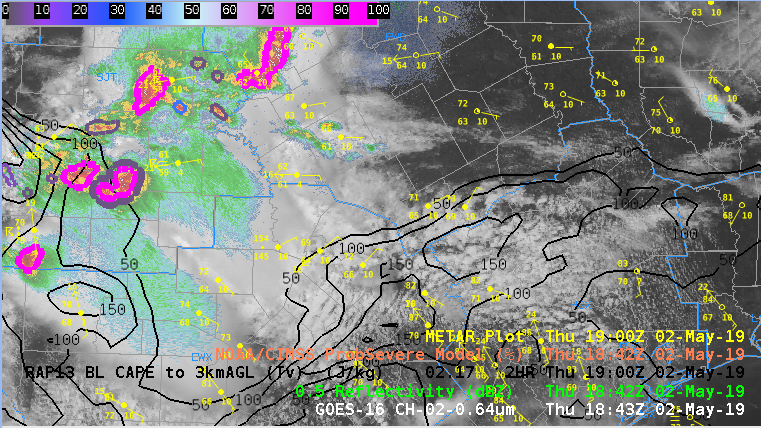
Figure C
RAP13 0-3km CAPE is favorable for surface based storms in far southern FWS CWA.
As many have already mentioned, the new All-Sky LAP layered PW and CAPE products are very useful tools for mesoanalysis and quick identification of key meteorological gradients (I bet my grandmother could ID the dryline below…). Earlier today, these products seemed to pick up on the outflow boundary that stretched from SE AR into southern OK/northern TX. It was extremely subtle and slightly offset from the actual boundary, but if you looked just right you could see it (tried to get a good animation, but the contrast is lost so you’ll have to take my word for it…). The color table provided for these products, specifically the PW products, make identifying key/obvious boundaries easy, but the more subtle things are easily missed. I would caution anyone from using them for anything other than IDing the main players, unless the color table could be tweaked to enhance those low-to-mid range values (~0.4 to 0.8). I’m not sure it’s worth exploring given these products are 6km resolution, I was just surprised to see the subtle reflection of the outflow boundary. Perhaps I’ll play around with the color tables now…
–Stanley Cupp
The AllSkyLAP Precipitable Water Product continues to be my favorite of the two options. There are too many unrealistic gradients that form within the composite merge. In this case notice how Texas seems to be especially prone to the errors where numerous sharp & and unrealistic gradients exist east of the dryline.
South Beach