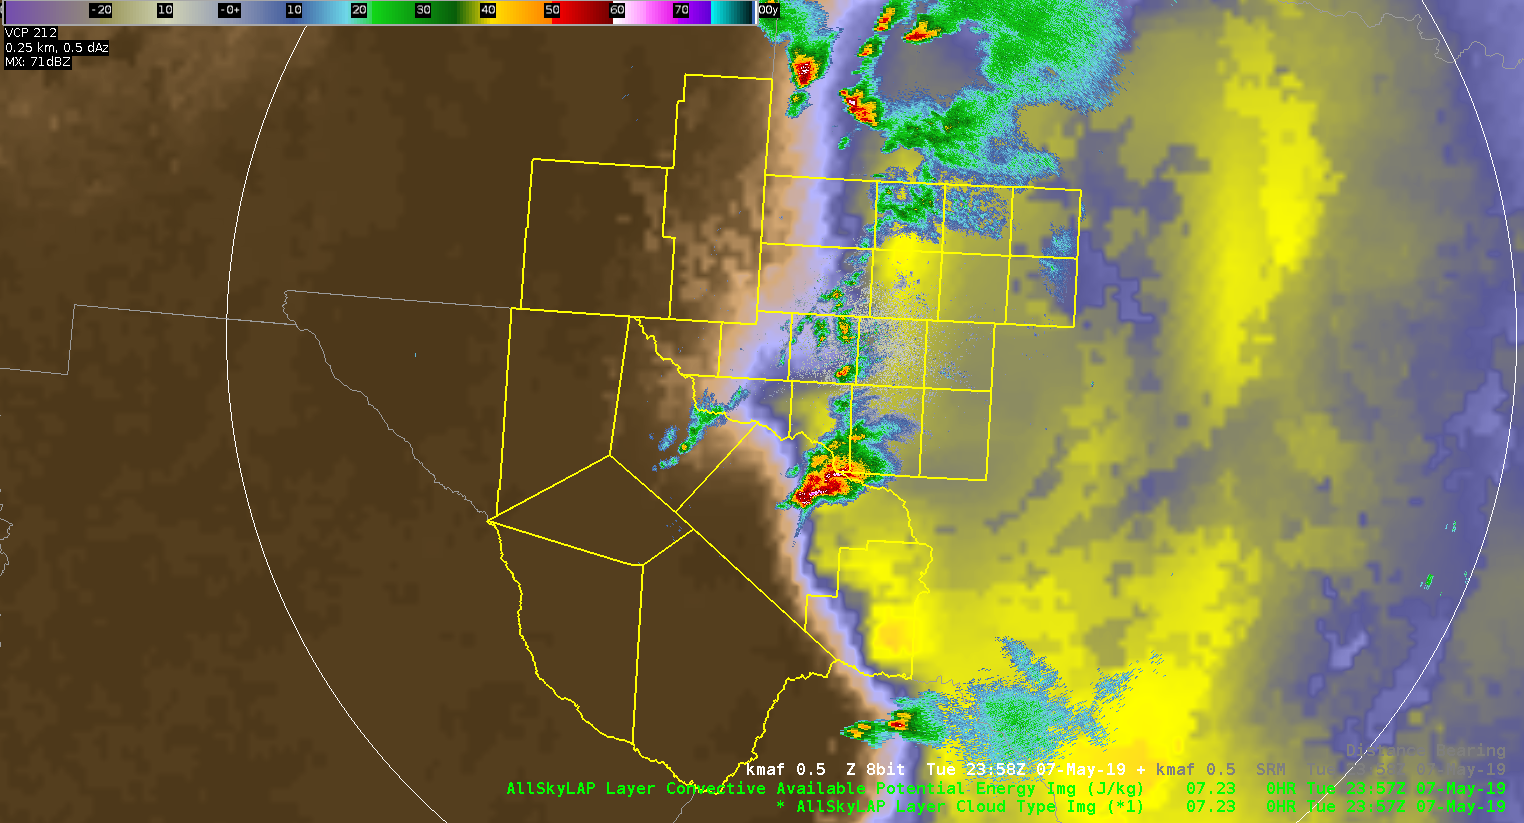
 Just wanted to note that AllSky CAPE product is nicely showing developing CAPE ribbon underneath anvil shield from ongoing storms. New severe storm just west of AMA developed on the western edge of this axis.
-icafunnel

Just wanted to note that AllSky CAPE product is nicely showing developing CAPE ribbon underneath anvil shield from ongoing storms. New severe storm just west of AMA developed on the western edge of this axis.
-icafunnel
I have to give a shoutout to how impressively well ALLSkyLAP Layer CAPE identifies the dry line. I really like to overlay radar data with this.
ZDR_Arcophile
Supercells developing along the western edge of the AllSky CAPE depiction.
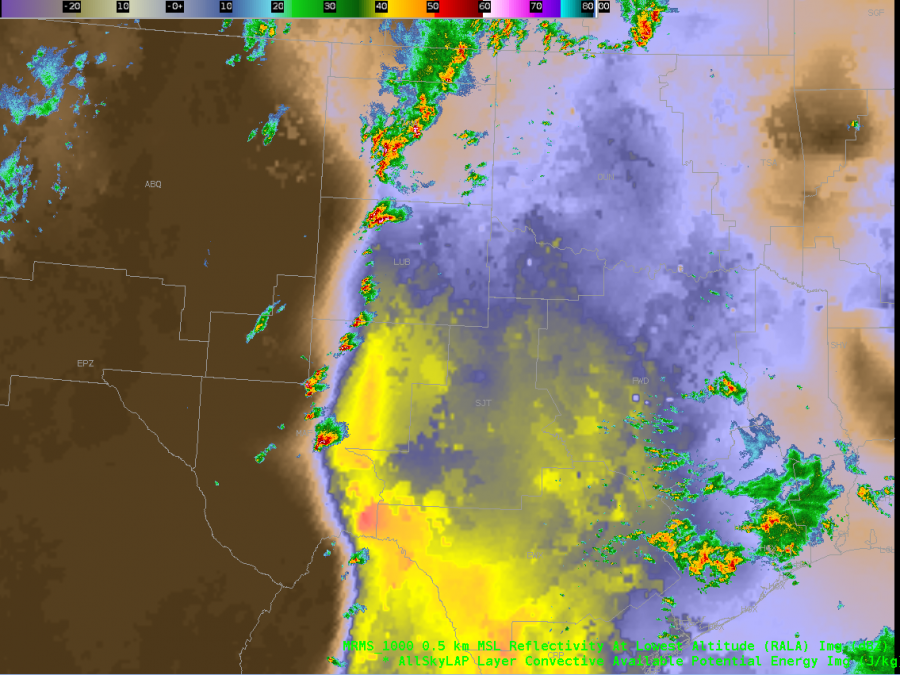
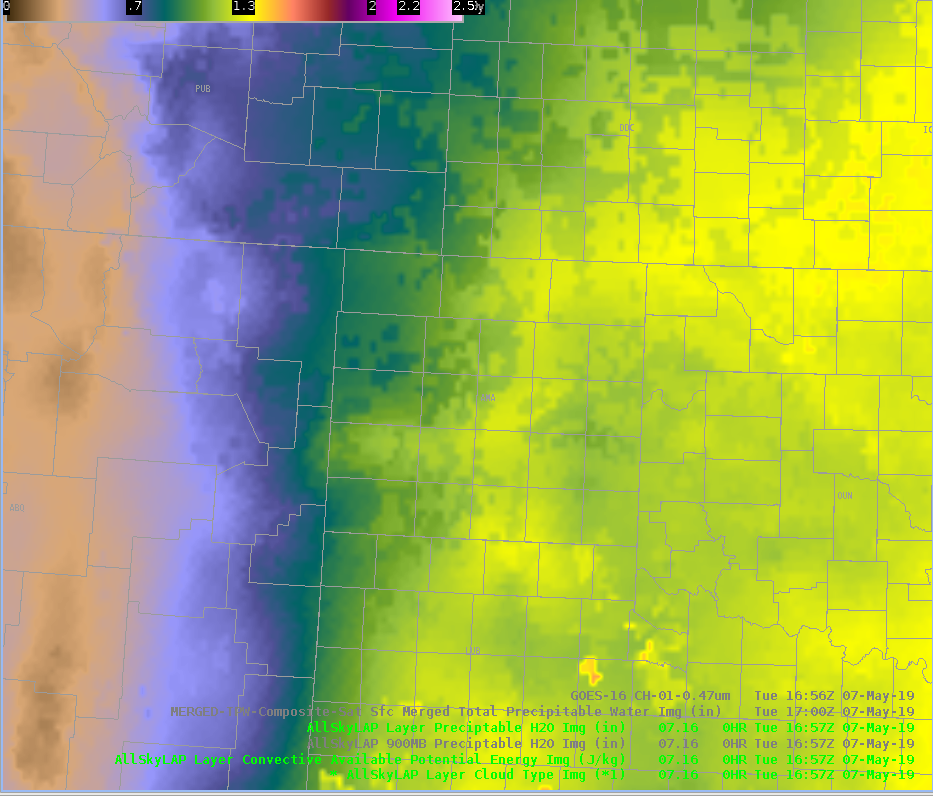
Another loop of supercells developing along the advancing dryline as depicted by the AllSky H9 PW imagery.
The AllSky H9 PW product showed good advancement of the dryline into West Texas today. Convection quickly developed as the dryline advanced into the Panhandle. 
Noticed a glitchy progression in the AllSkyLAPs 900mb PWATs. Believe this might be from an updating GFS guidance, but this also occurred at a time when the areas west of the LUB CWA were transitioning from about half Cloudy, half GFS to mostly GFS. However, the updated location of the dryline was a closer approximation of the location of the dryline at the given time.
#ProtectAndDissipate
At 22 UTC on 6 May 2019, the All Sky LAP and CIRA Merged TPW Data type products show differences in the cloud mask. A shallow Cu field over NC / SC is indicated in GOES visible imagery,. The data type masks of the two products (blue = clear; yellow / gray = clouds) show some clouds in the All Sky LAP mask, while the CIRA Merged TPW mask does not have these Cu detected. This is likely due to the lower resolution (~ 15 km) of the GOES-16 TPW data used in Merged TPW versus the All Sky LAP resolution.
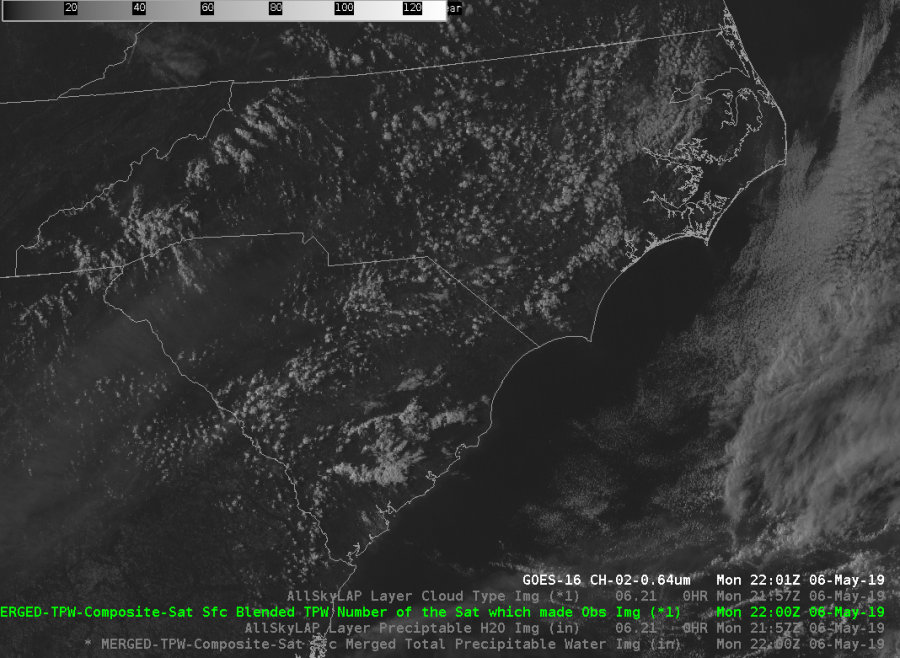
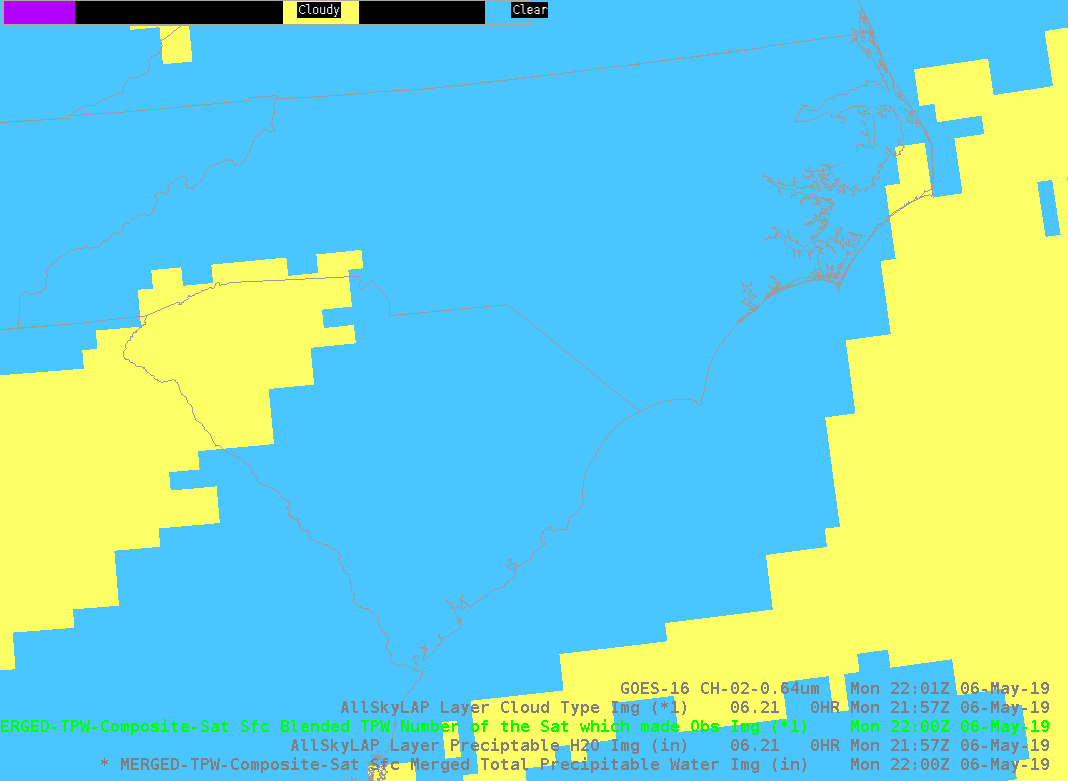
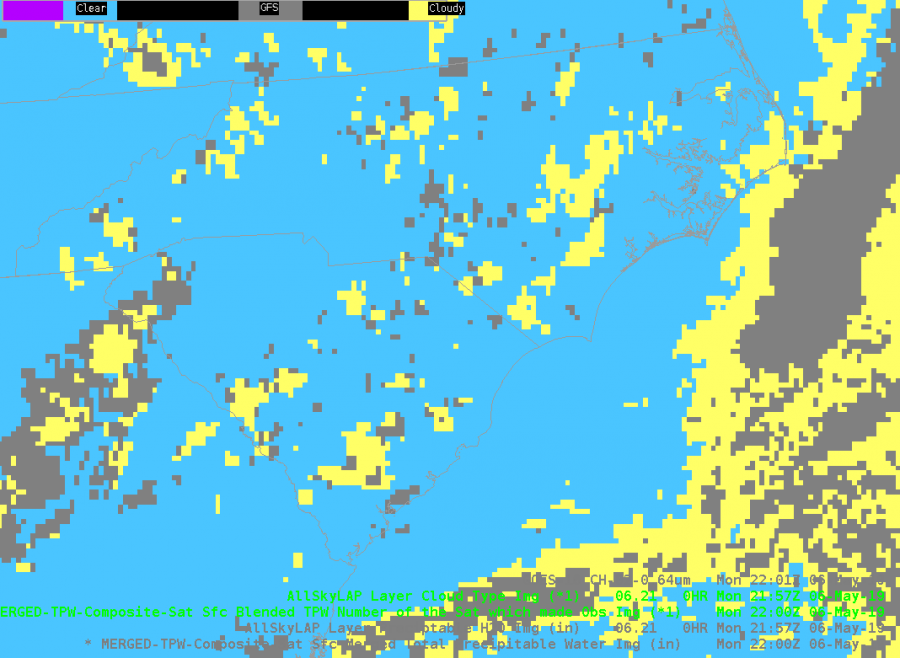
GOES-R TPW has a nominal resolution of 10 km.
JohnF
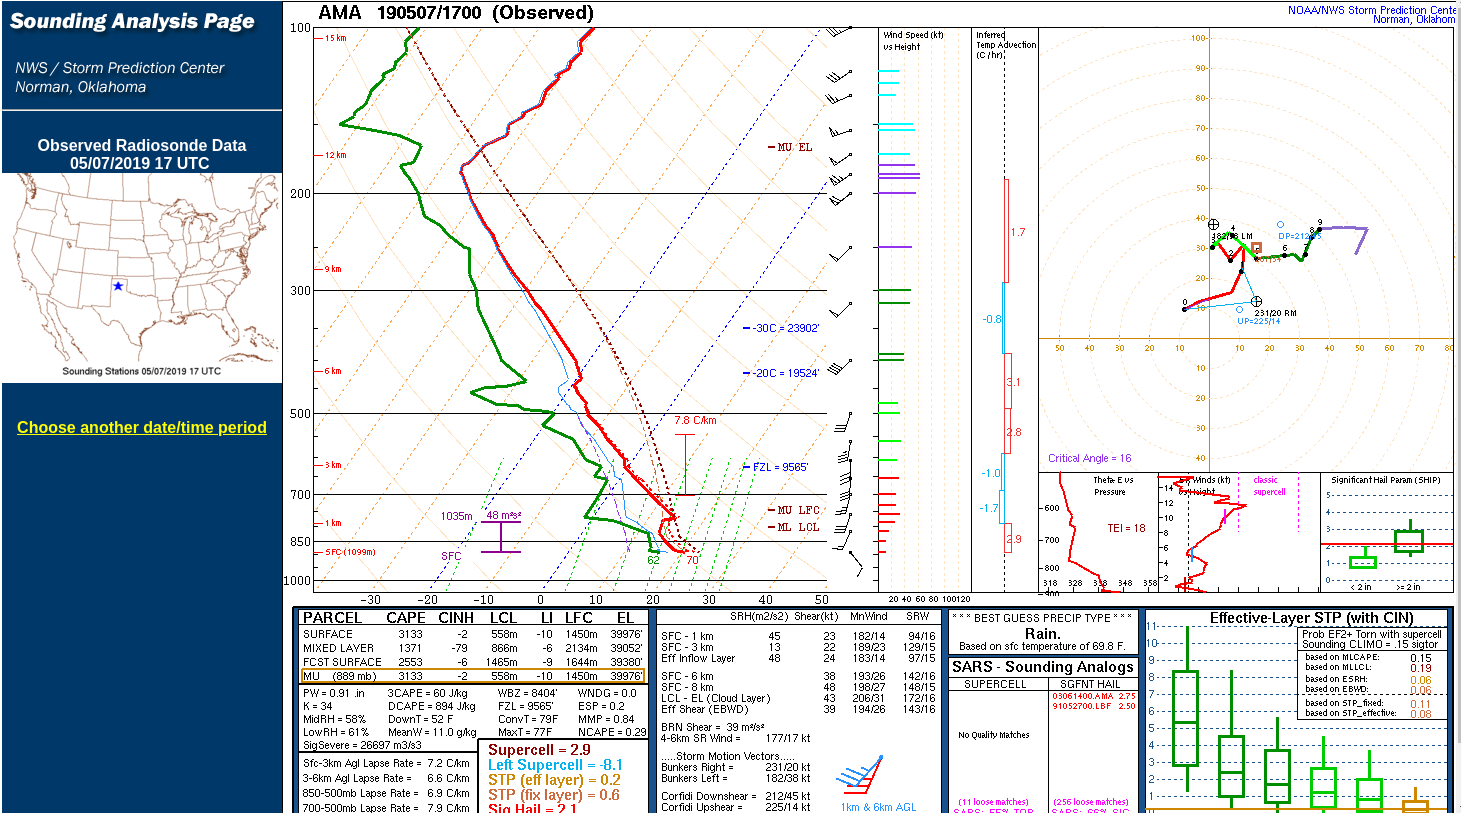
Noticed a major difference in the pre-storm environment at 17Z, just before convective initiation, between the TPW and LAPS products Total Precipitable Water Products. AllSkyLAP Total Precipitable H20 was observing ~1.25″ at 17Z whereas the Avd. Blended TPW observed ~0.7″ at 17Z. A special 17Z sounding observed 0.9″. While AllSkyLAP ‘looked’ more realistic from a mesoanalysis standpoint, the sounding was closer to the Adv. Blended TPW product. Would like to see more sounding verification between the 2 products.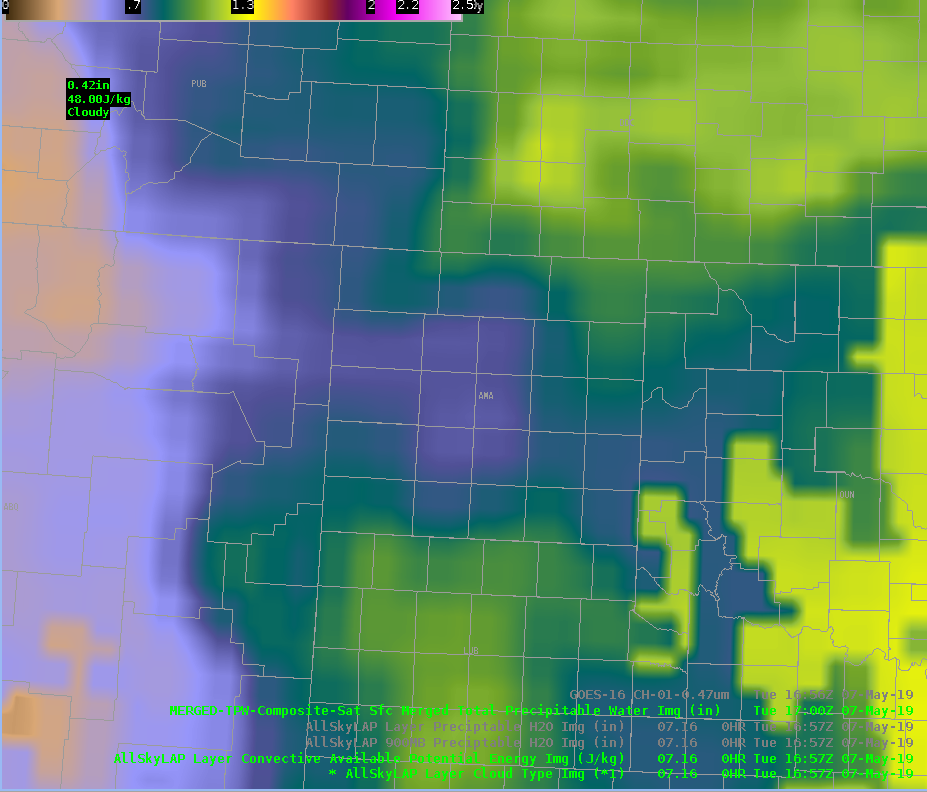
#ProtectAndDissipate
One of the limitations of GOES TPW is that it will not display data when there is a significant amount of clouds in the area. AllSky Layer Precip is a great alternative to GOES TPW for areas that are experiencing clouds. The same goes for AllSky CAPE vs GOES CAPE. With a MOD Risk of svr wx today across the TX Panhandle, having the AllSky Data available greatly benefits forecasters today. 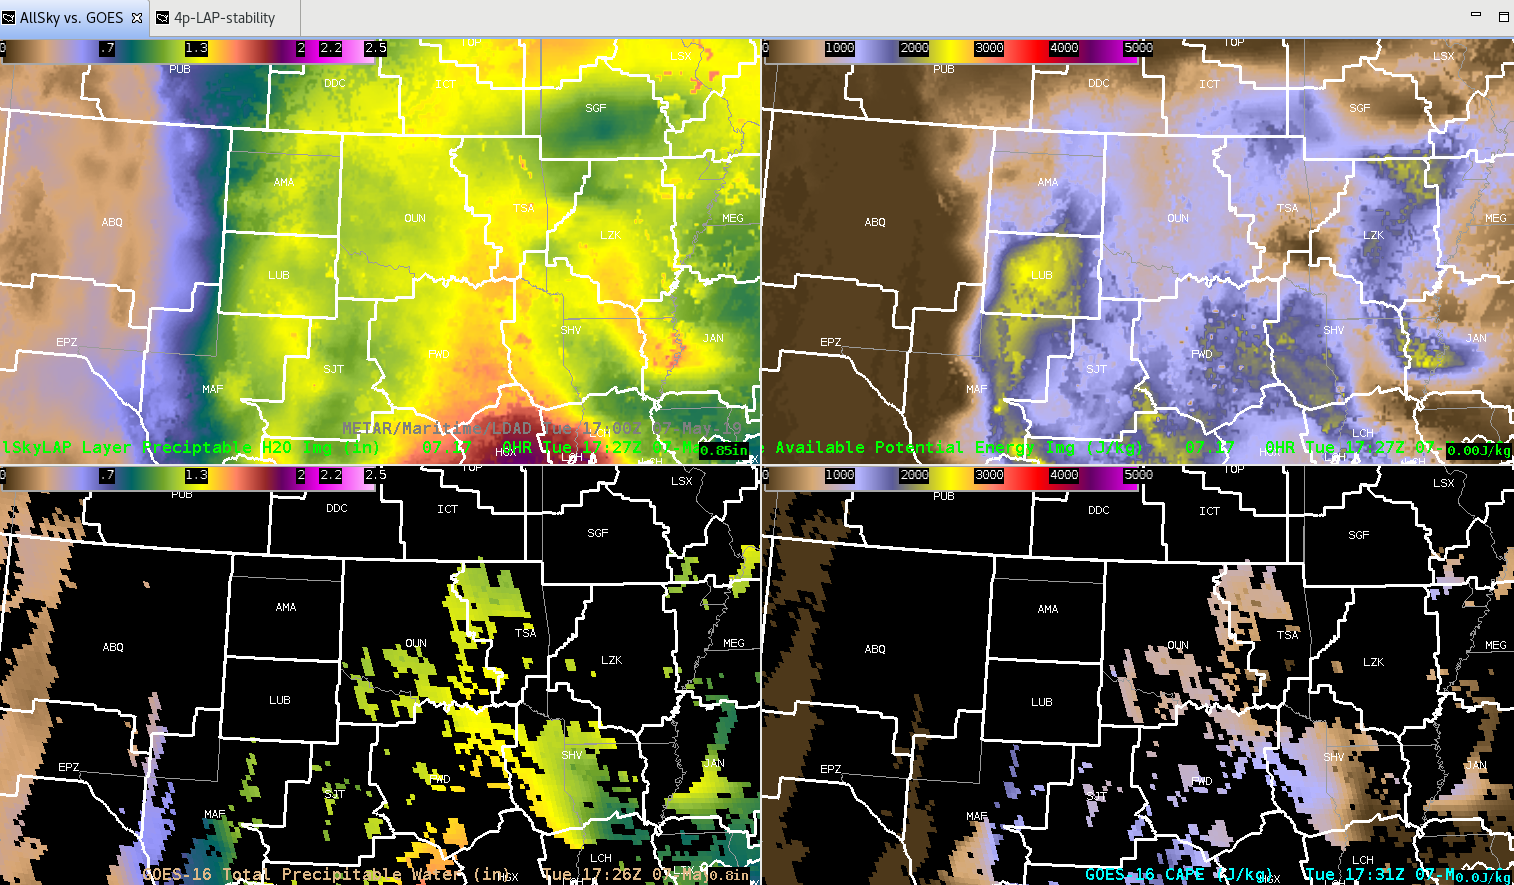
Looping All-SKY CAPE imagery showed a CAPE axis extending northwest across NE CO and SE WY. Isolated to scattered convective initiation occurred along this axis.