Davenport launched an 18Z balloon, which gave me the opportunity to compare the RAOB with a NUCAPS sounding (first and second images below, respectively). Initially, I attempted to modify the sounding in NUCAPS to try to bring it closer to the observed values, but after several minutes and attempts at doing that, I realized that I’d have to do multiple levels of modifications before it came anywhere close to the observed sounding. As great as it is to have the ability to modify the NUCAPS sounding, my initial thoughts are that I’m not sure how feasible it would be to do this in a much quicker-paced operational setting. If I’m sitting in the mesoanalyst seat during a severe weather event, I’d need to be able to analyze the available data much faster than doing a more detailed modification would allow.
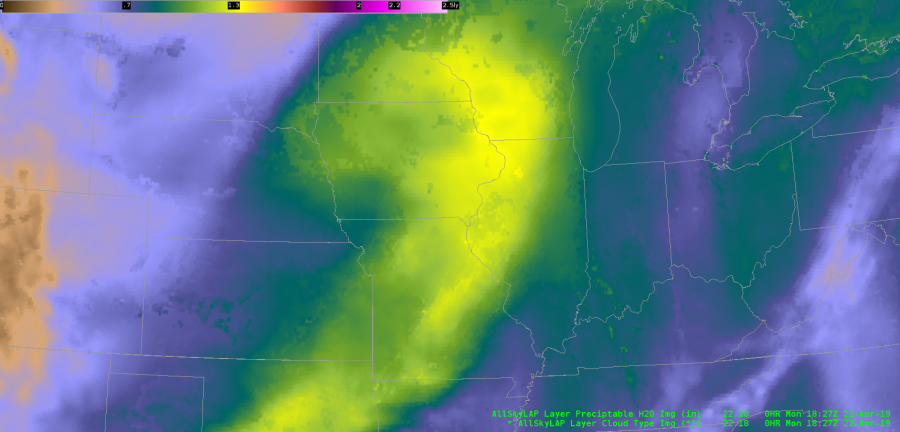
I was also able to do a PWAT comparison between these two soundings and the AllSky Layered Precip product. The NUCAPS and RAOB are very close together in values, whereas since the AllSky product (last image below) is currently utilizing the GFS to fill in the data in the DVN area, it’s noticeably higher (RAOB: 1.0″; NUCAPS: 1.1″; AllSky: 1.3″). I am very happy to be able to underlay the data type for the LAP products, since this is crucial for me to be able to see where the data is coming from and how to correctly assess and apply the right bias adjustments, as necessary.
As for the AllSky Layered Precip product, in general, this is very helpful to be able to identify potential atmospheric rivers and quickly diagnose PWAT trends with a decent degree of confidence, when again combined with the knowledge of what data is being used to compute the output.
~Gritty
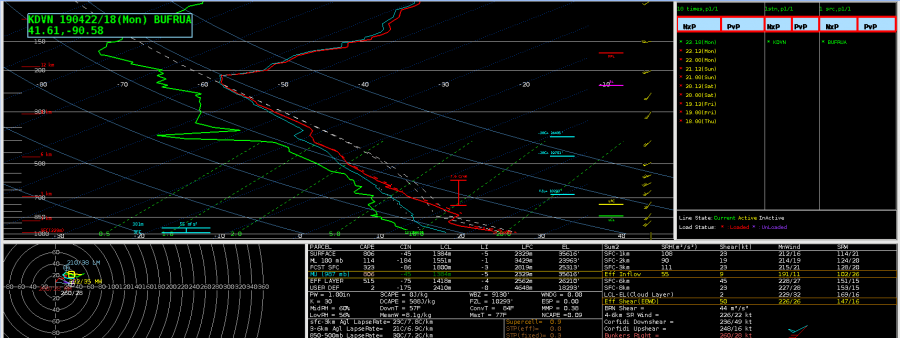


 After a quick adjustment to the lowest points on the sounding, this clearly looks like a severe weather sounding. I’m hesitant to rely on CAPE estimates given the dependency on the boundary layer, but indicies more reliant on mid level obs (LI) are still indicative of strong to severe storms. This compares well to all-sky LAPS retrievals (above, right).
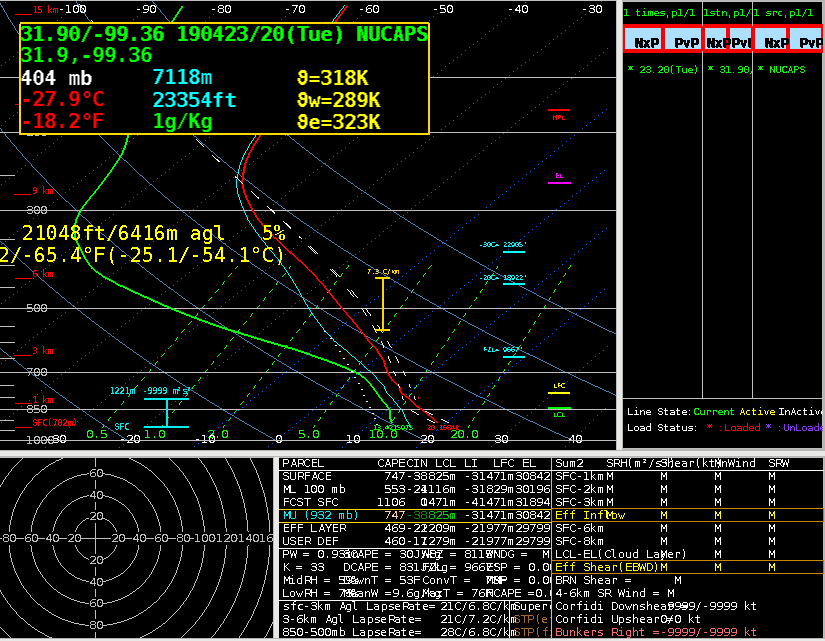 In typical operations in which I do not have access to these products, I would rely on the SPC mesoanalysis (below) to estimate instability. The NUCAPS and LAPS All Sky retrievals do somewhat increase my confidence that the mesoanalysis is close to reality. However, Given my conceptual model of how the atmosphere should be behaving, I was already highly confident that the atmosphere is quite unstable in the warm sector, so the increase in confidence from NUCAPS/LAPS is somewhat limited.
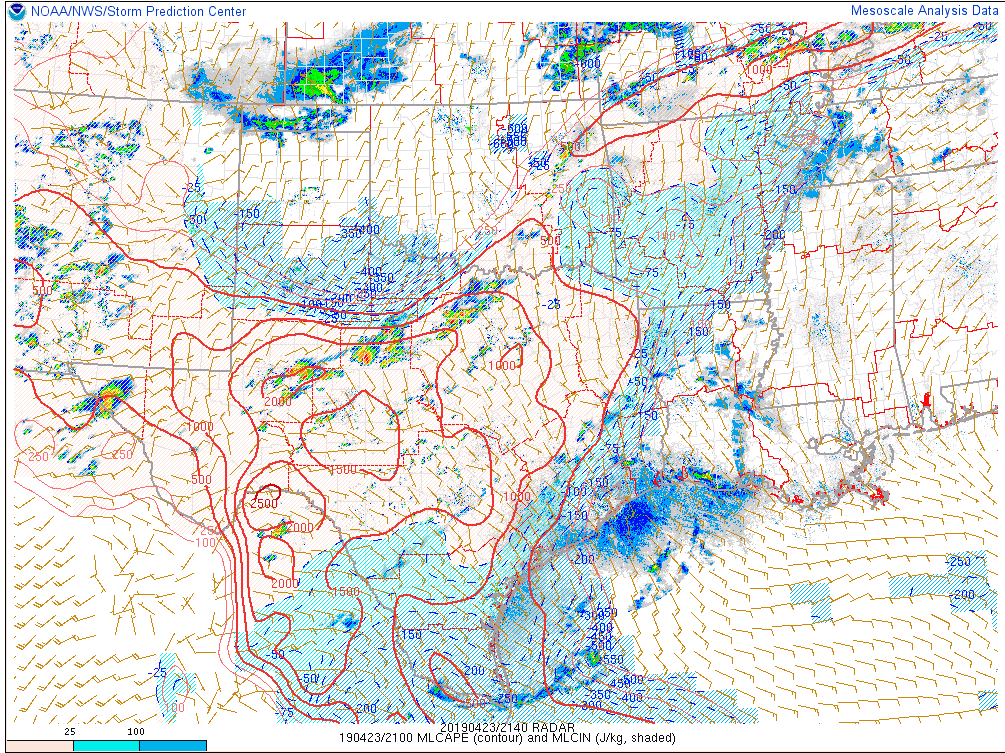 Sandor Clegane
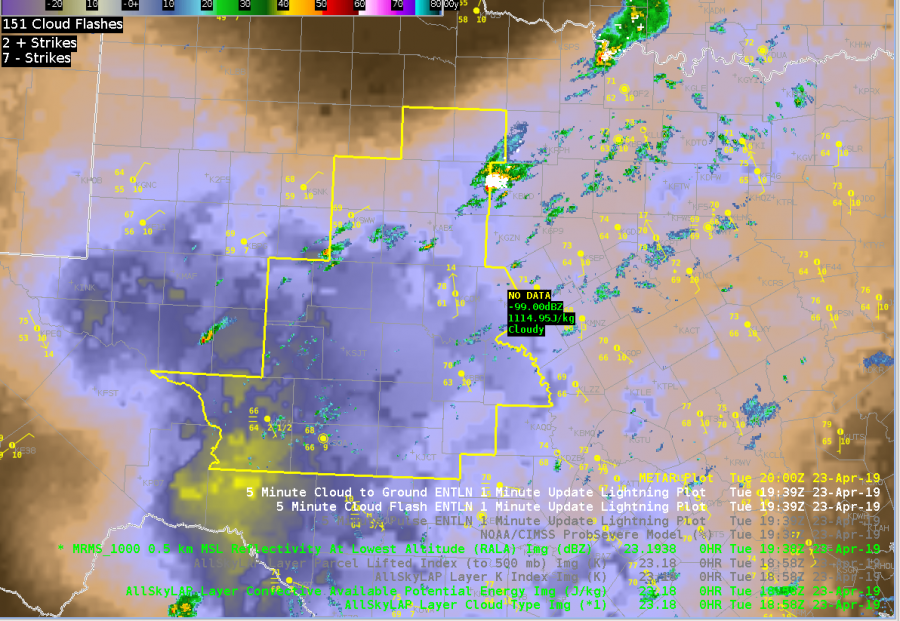
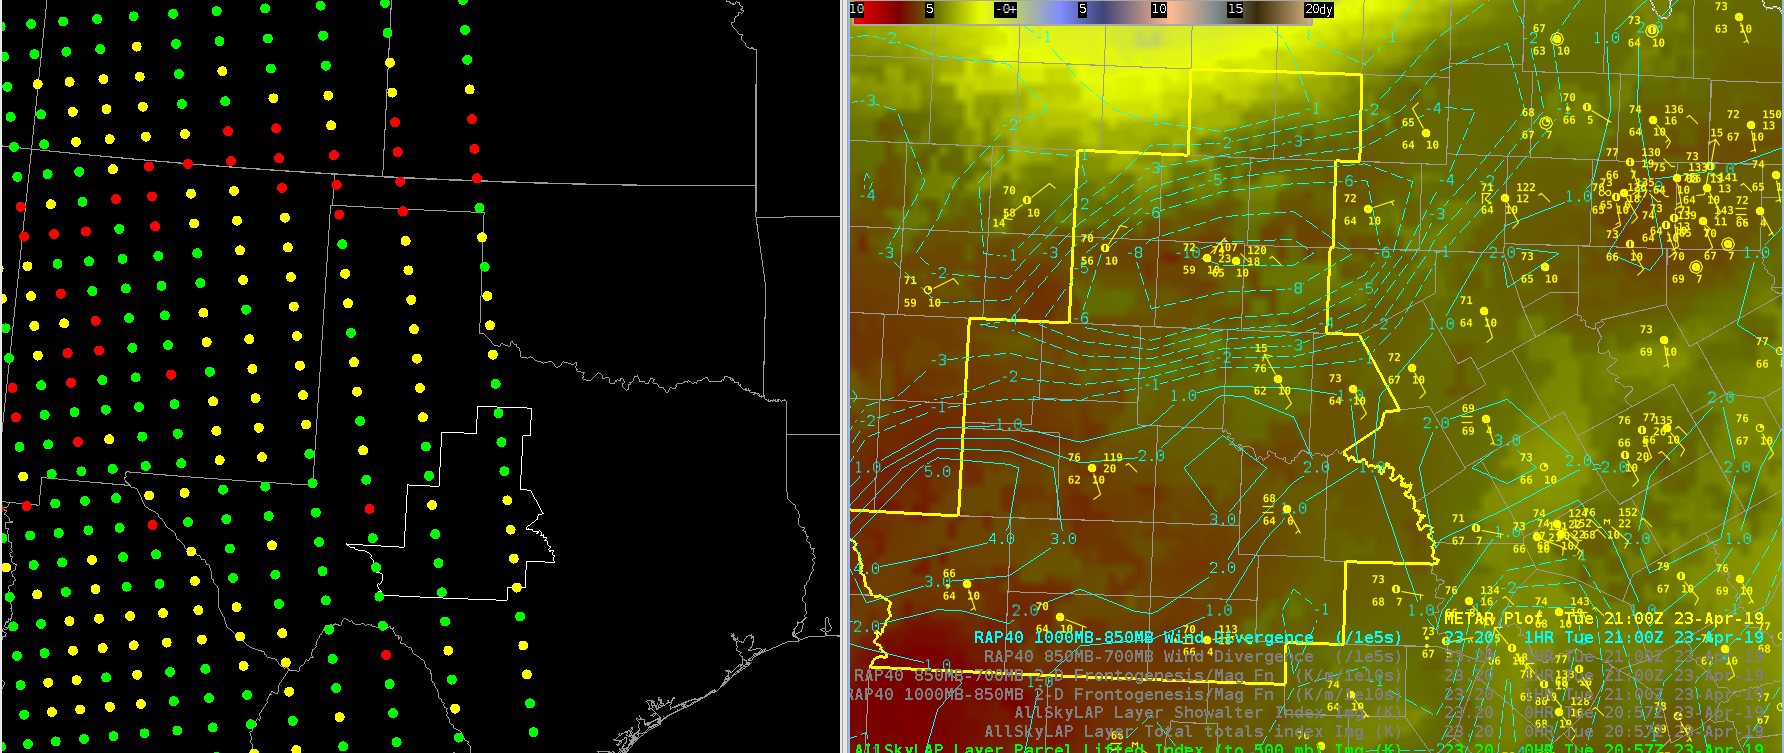
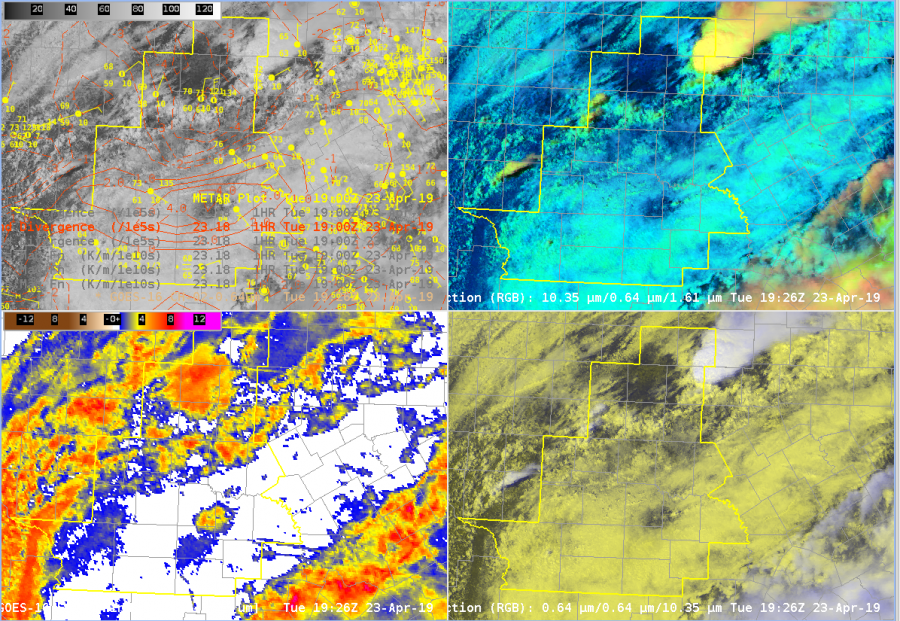 Laps All Sky retrievals show a relatively sharp instability gradient along warm front where our convection initiated. Storm motion is likely to be parallel to the front, so convection that does will likely be relatively long lived. (Below)
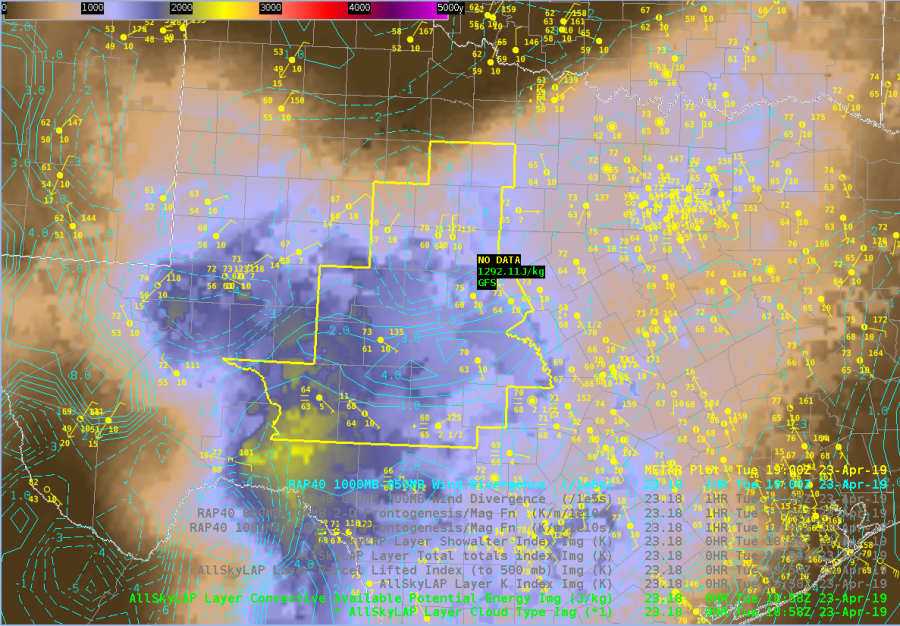 Laps All Sky LI further indicates that the airmass is relatively unstable and there will be little convective inhibition at least in the midlevels. (Below)
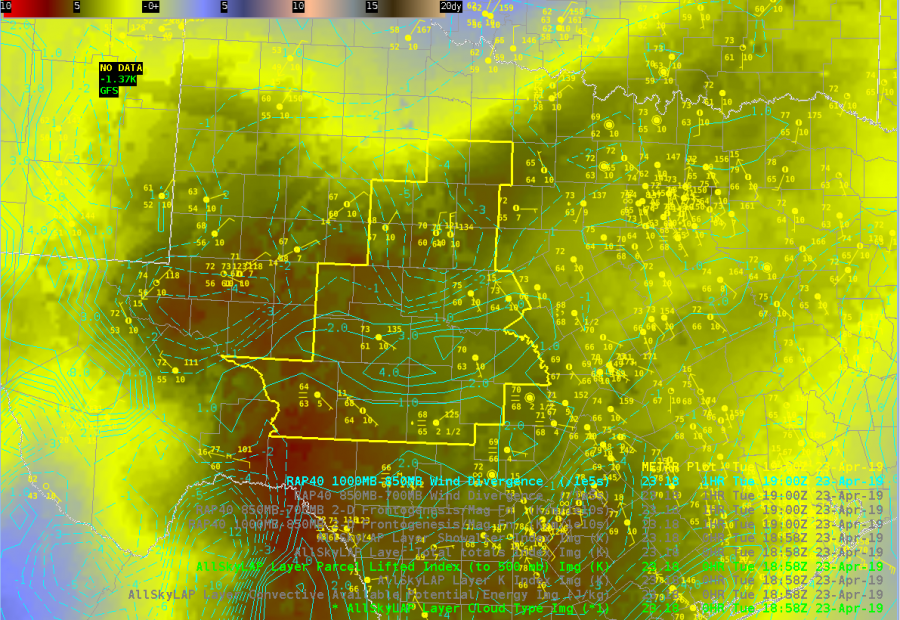 All Sky TPW indicates a relative moist airmass across the CWA with PWs above 1″ for most of the CWA. This matches the 12z sounding from MAF relatively well, and is well above the 90% threshold of the sounding climatology for that location and date. It’s interesting that the mid-level moisture (bottom left) is higher than the low level moisture (bottom right). Not quite sure what to make of that at this point. (Below)
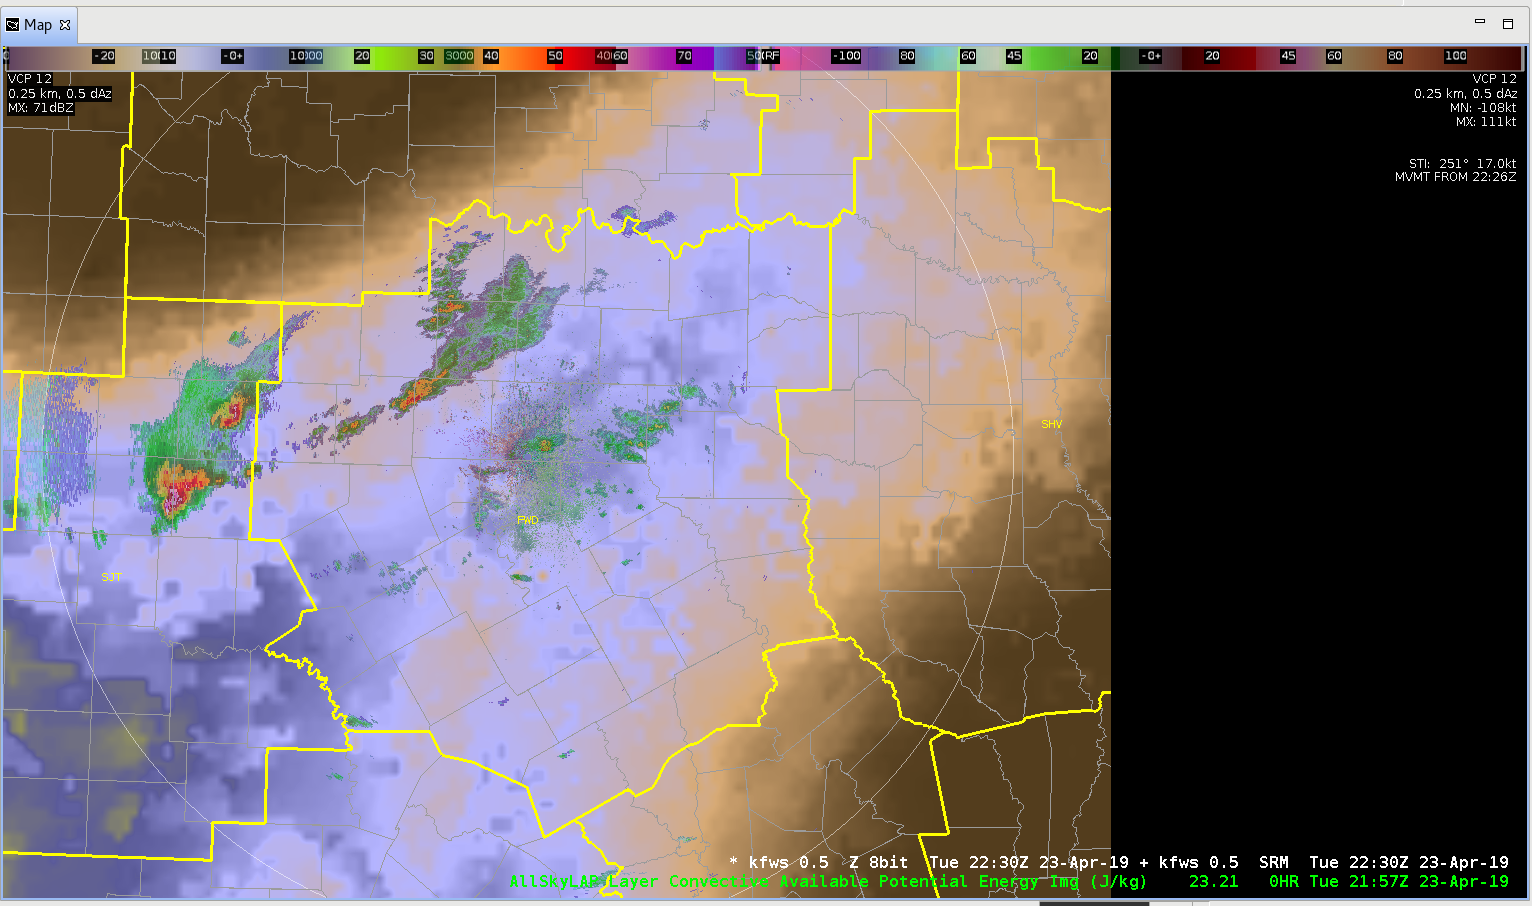
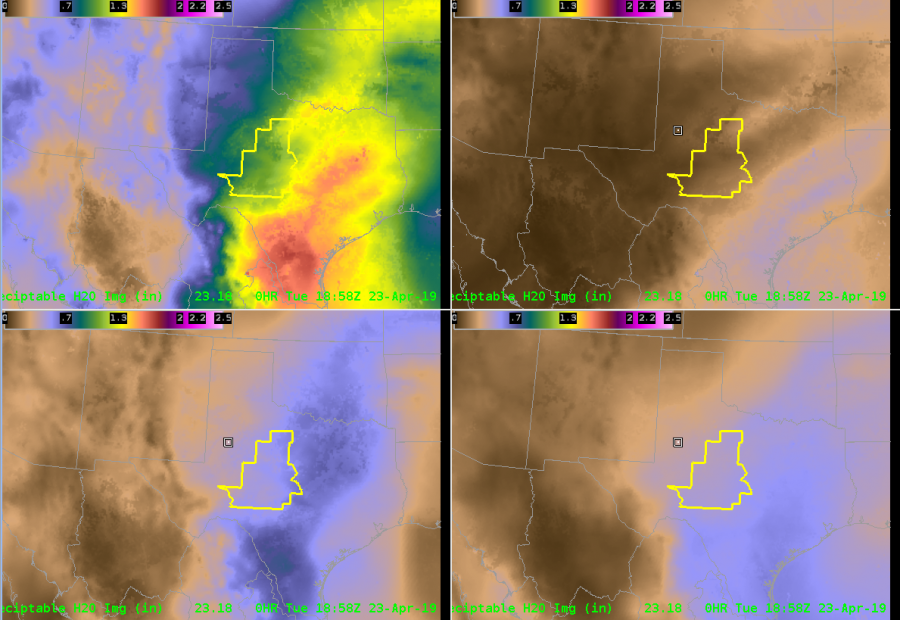 Finally, MRMS RALA indeed shows that showers and storms have developed along the front. When animated (not shown), you can see that the storms are tracking along the front, heightening my concern for flooding.