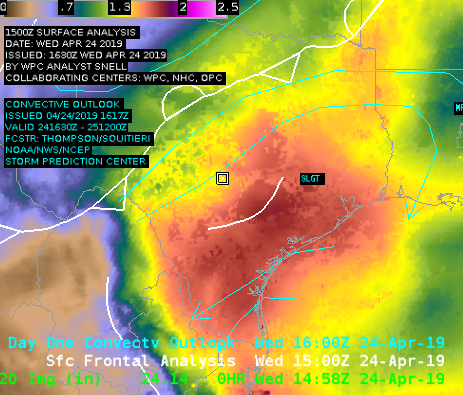
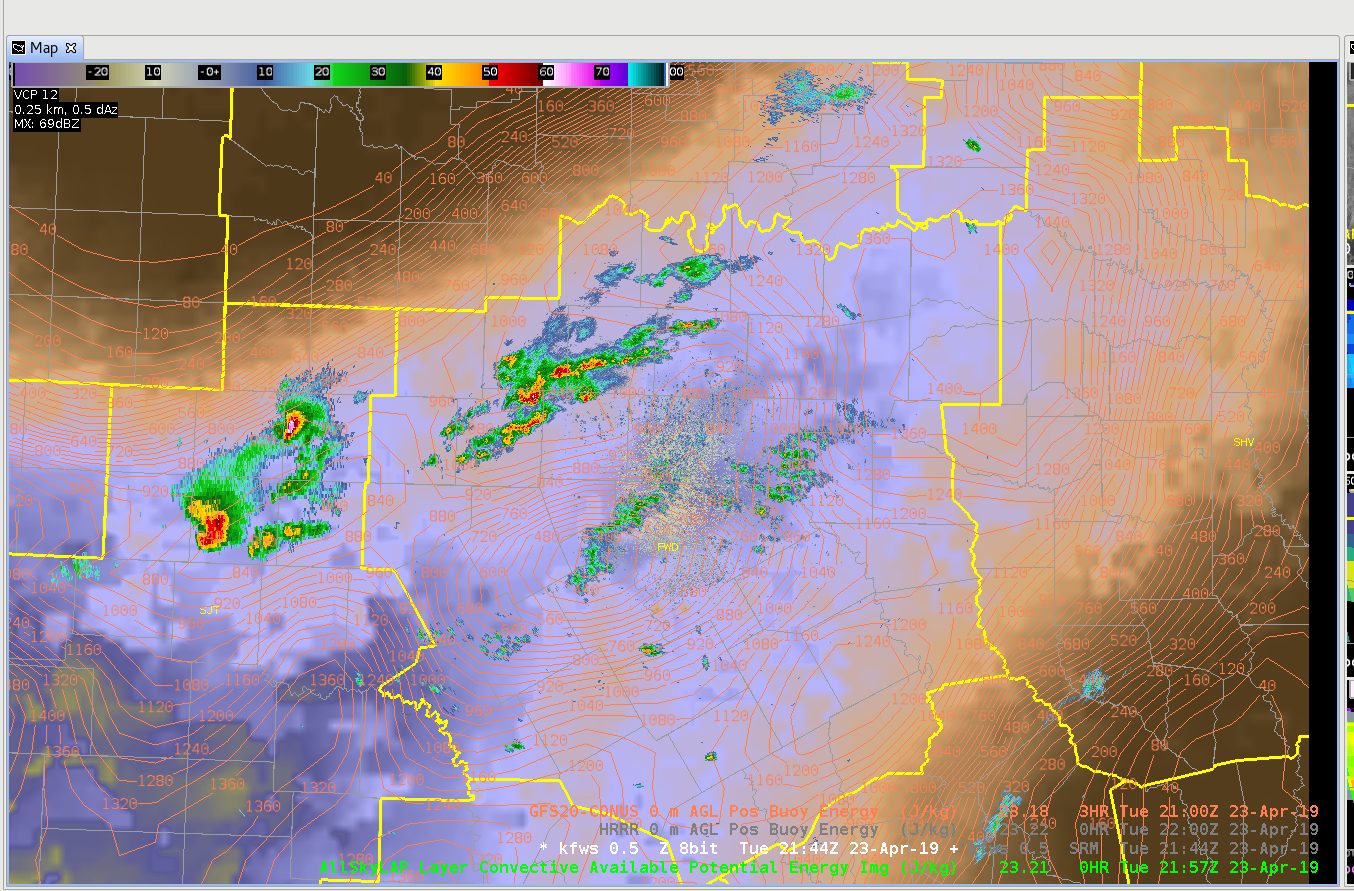
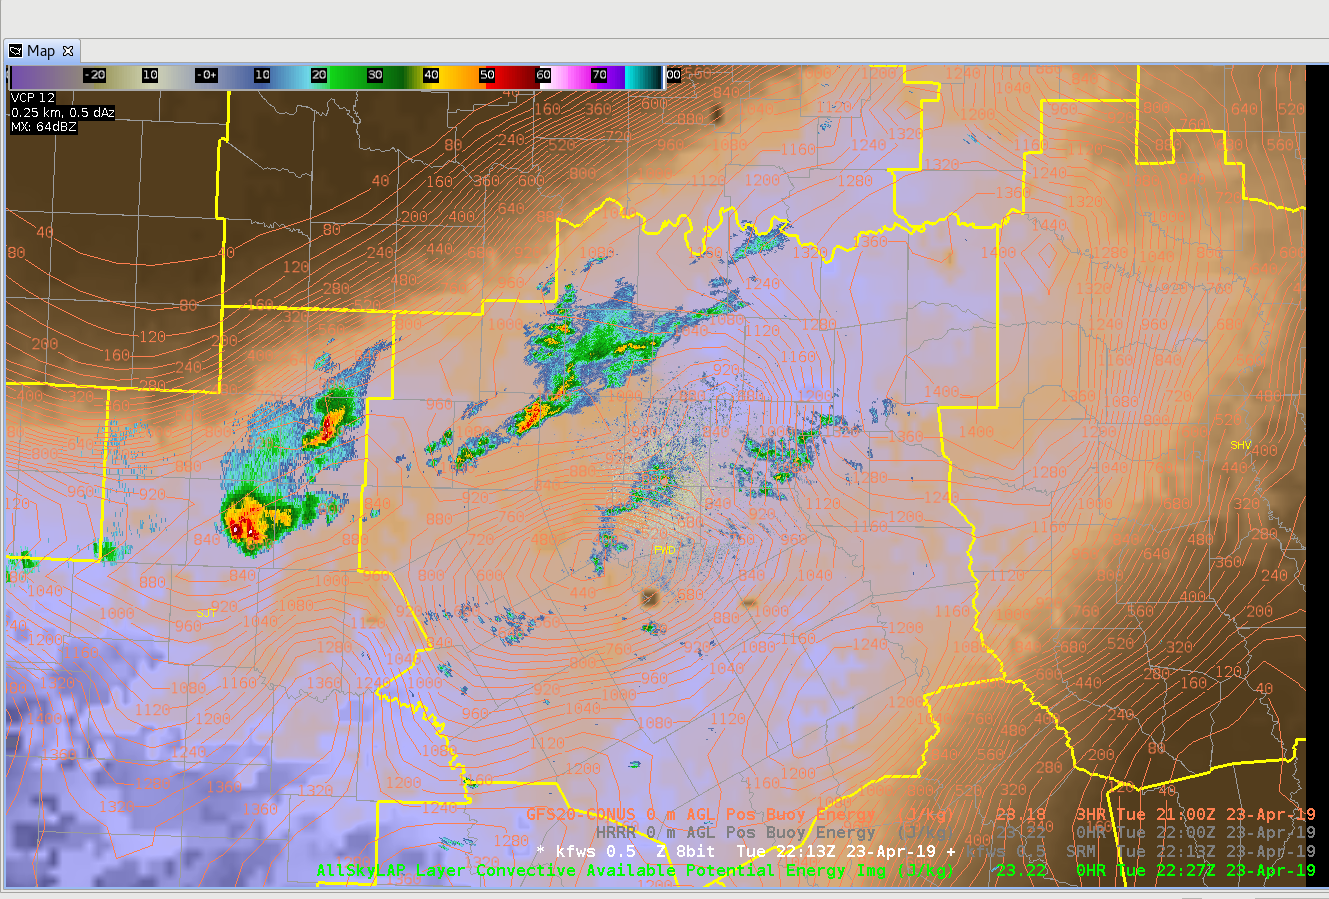
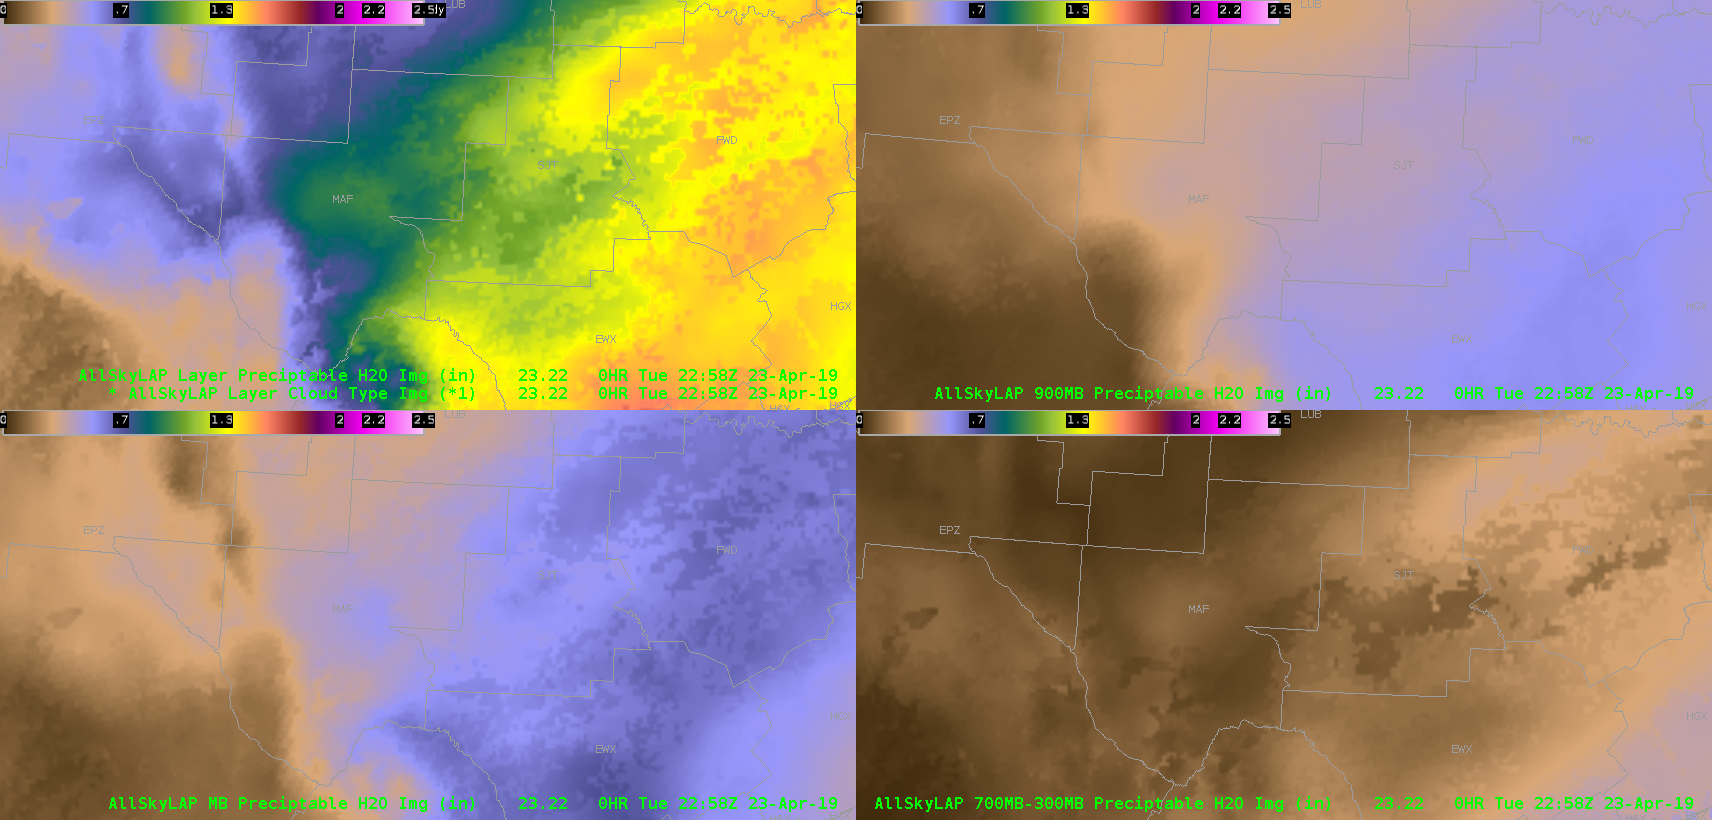
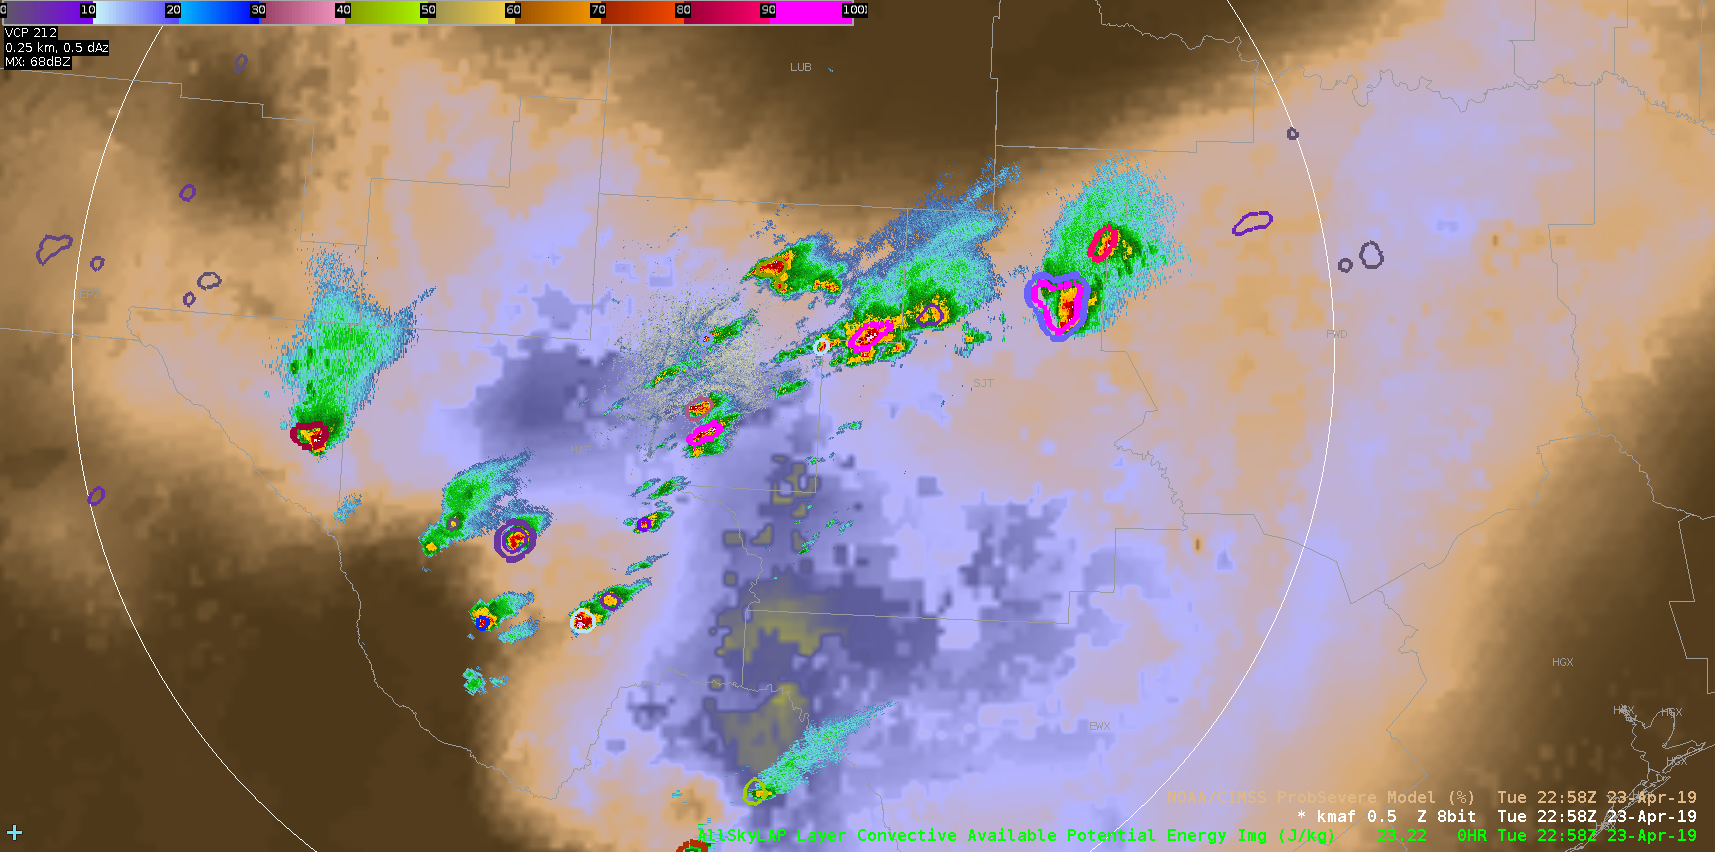
Storms in the EWX CWA early in the shift were generally remaining sub-severe, with what looked to be heavy rain as the dominant threat. The first two loops (below), the storms were riding right along the gradient of the PWATs and CAPE. (continues below)
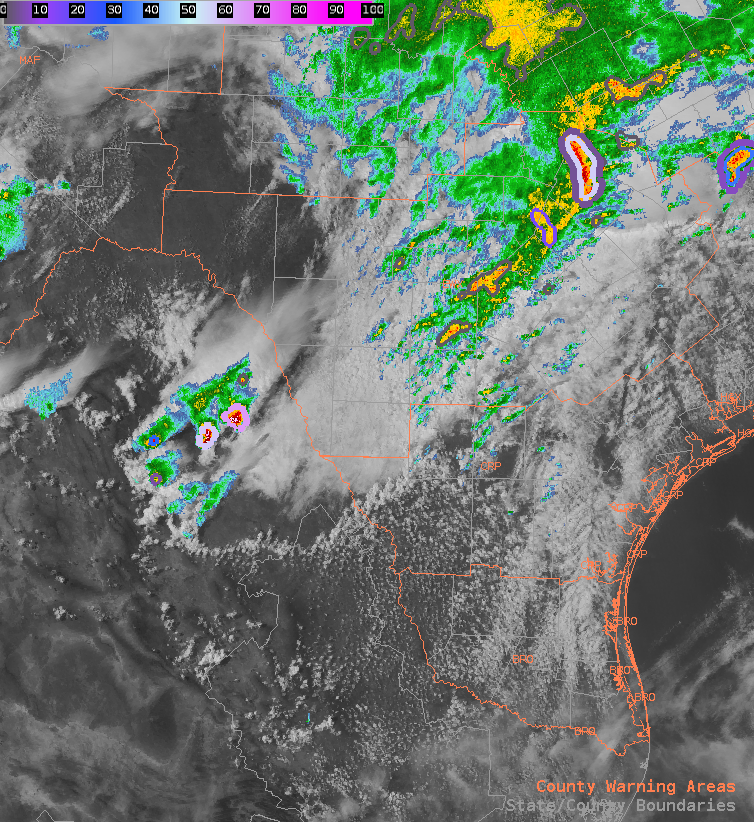
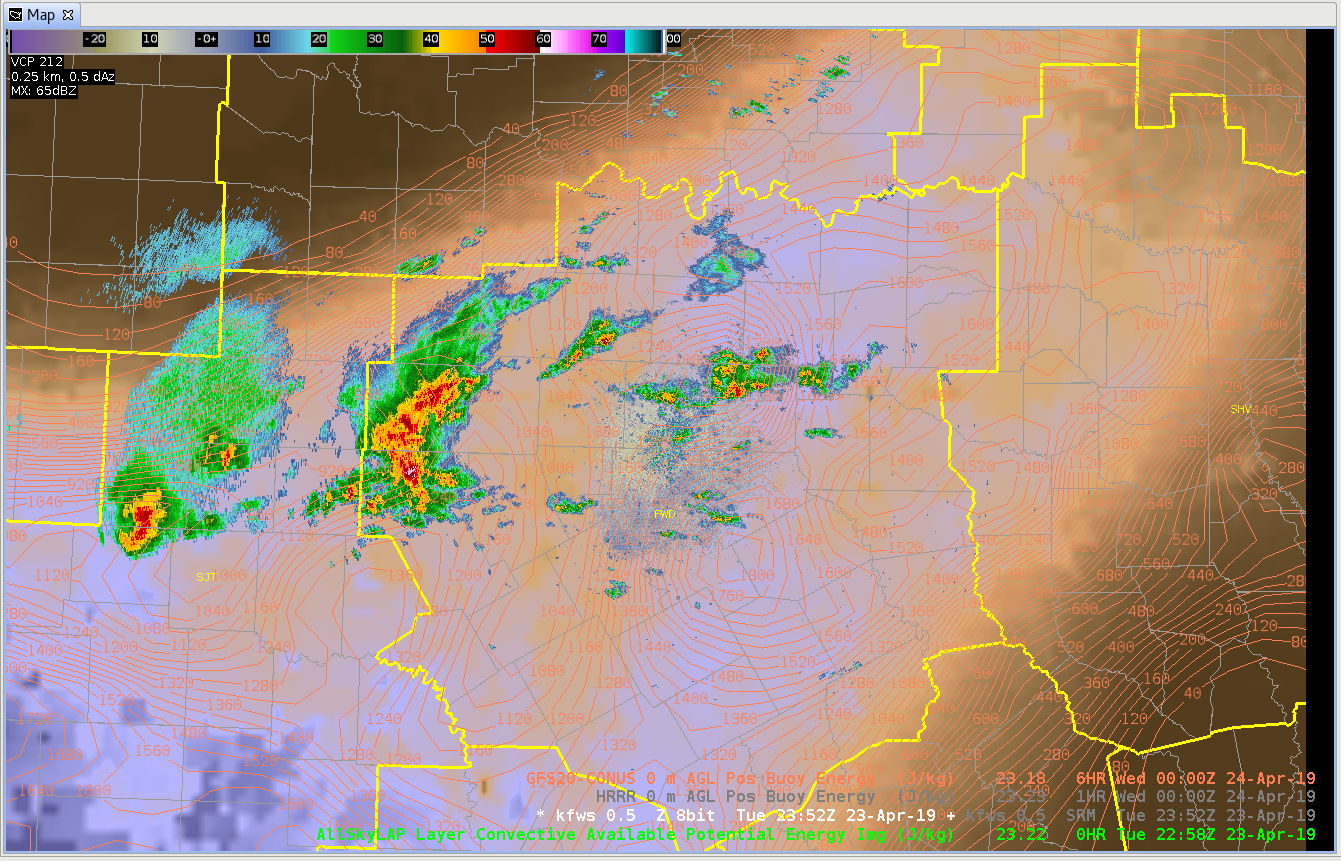
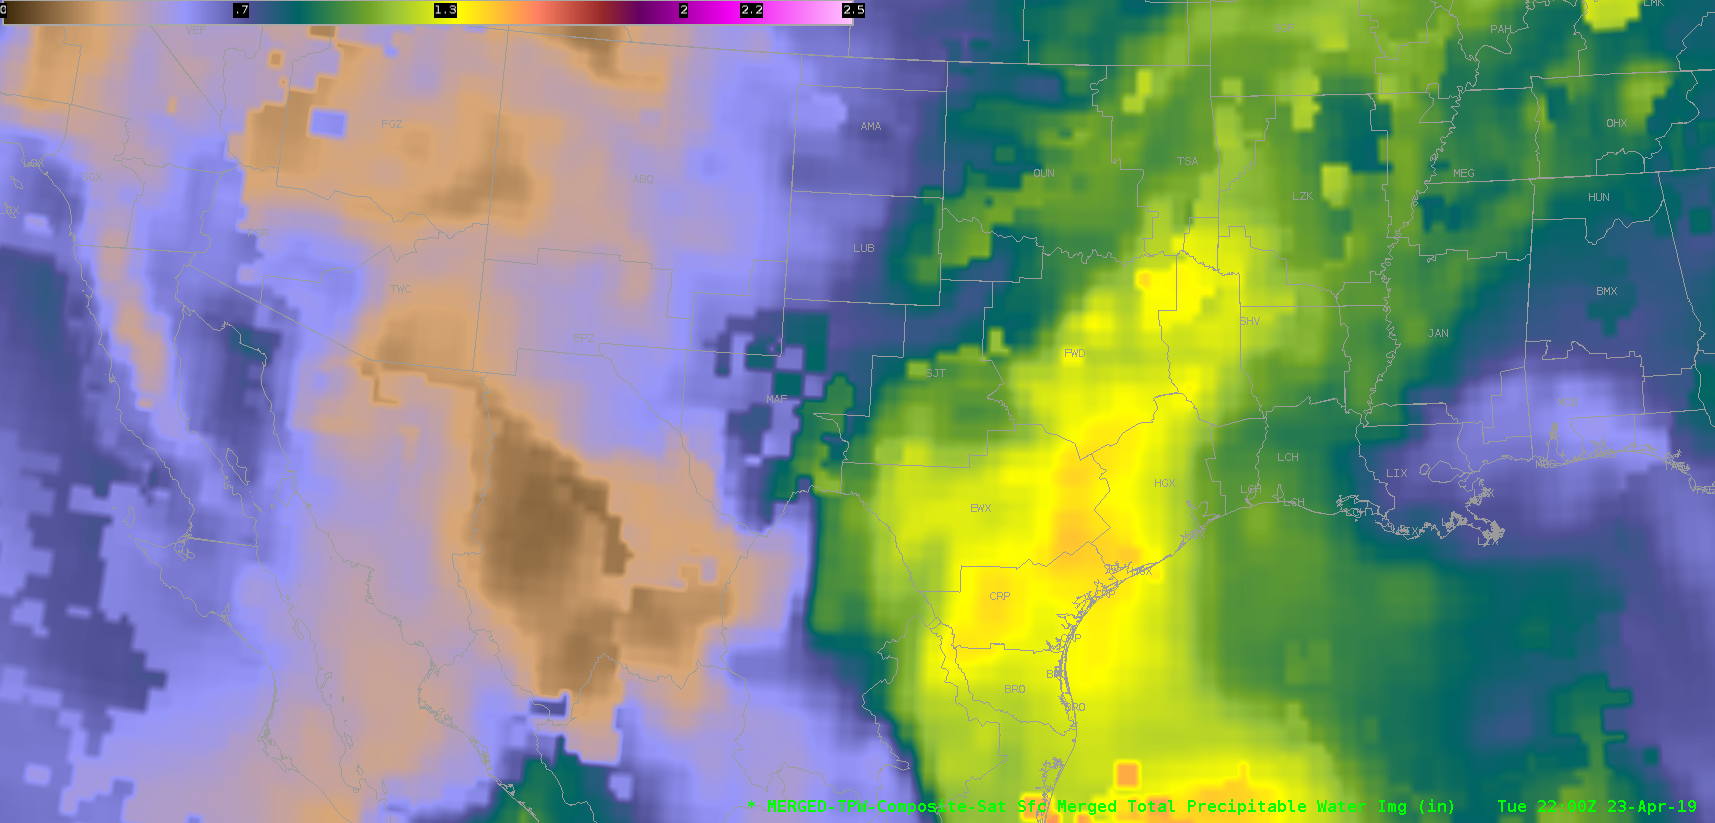
As the cluster of storms reached the eastern edge of a greater area of instability (below), the concern then turned to how much of the instability would be tapped into and how storms would react, with the thought that they’d likely become more robust. (continues below)
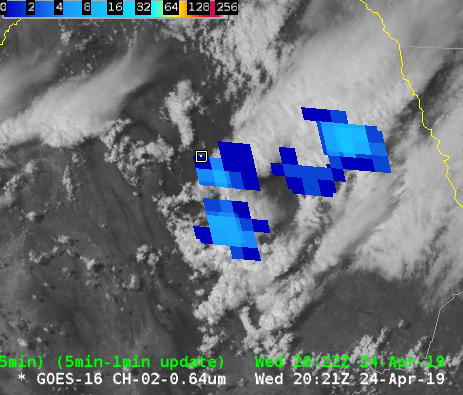
Attention was then turned to how the GLM was observing the evolution of the stronger cluster of storms within the northeastern portion of the CWA. I created a four-panel display, with MFA overlaid onto the mesosector visby imagery (upper left, below), clean IR with TOE overlaid (upper right; I had blinking enabled to capture the highest fJ, but is unseen in this GIF), Event Density with Group Centroid Density overlaid (bottom right, below), and FED with Flash Centroid Density overlaid (bottom right, below). It was fascinating to watch how the lightning unfolded with this particular cluster, and the MFA in particular immediately drew my eye to the storms moving toward the FWD CWA border. The smaller flashes began to blossom and expand out, which then had me look at the TOE and density products. The density products ramped up, but what I found the most interesting is that the MFA seemed to give me that initial clue that this storm was in fact tapping into some of the higher instability and allowing for the updraft(s) to intensify.
I then proceeded to take a look at the MRMS LL AzShear product (below), wistfully wishing I could look at the single radar version of this product. Sure enough, a clear signature developed, highlighting the amplifying wind within this cluster.
Last but not least, looking at ProbSevere, the ProbWind product picked up well on this signature, highlighted below.
Conclusion: I’m continuing to see some promise that there’s something to look deeper into with respect to these additional lightning products, particularly the MFA when used in combination of something like the Event or Flash Extend Density products. There seemed to be a good correlation with the TOE, as anticipated, but I’m still unsure about its utility as a stand-alone product. As for the Average Flash Area, I didn’t even pull it up given the limited amount of screen space I had and what I saw yesterday, with the AFA in particular not giving me hope of being able to gather good info/lead time in comparison to the MFA.
~Gritty
Side note: Had some excellent conversation with the GLM expert in the room and as we were talking and analyzing some of these products, it was noticed that there was quite an extensive channel, lightning that shot out well to the north of this cluster of focus. These GLM products could provide beneficial information when providing DSS to partners, such as letting partners and the public know not to go back outside just because there’s either light rain or the storm had already passed.

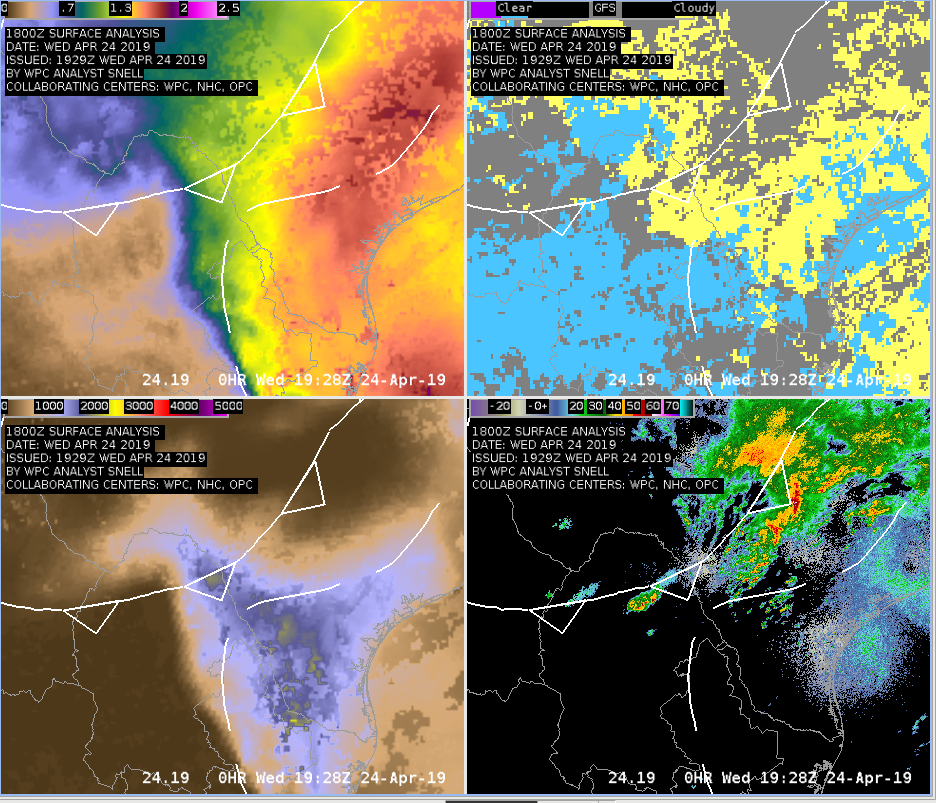
 An 8 hour loop shows how the instability has built and gives more confidence that instability will continue to build ahead of the storms to our west.
  We did feel that LAPS CAPE seemed a bit underdone given the intensity of the downstream of the convection, so we took a look at the latest NUCAPS retrievals. We examined the point in the extreme SE of our CWA.
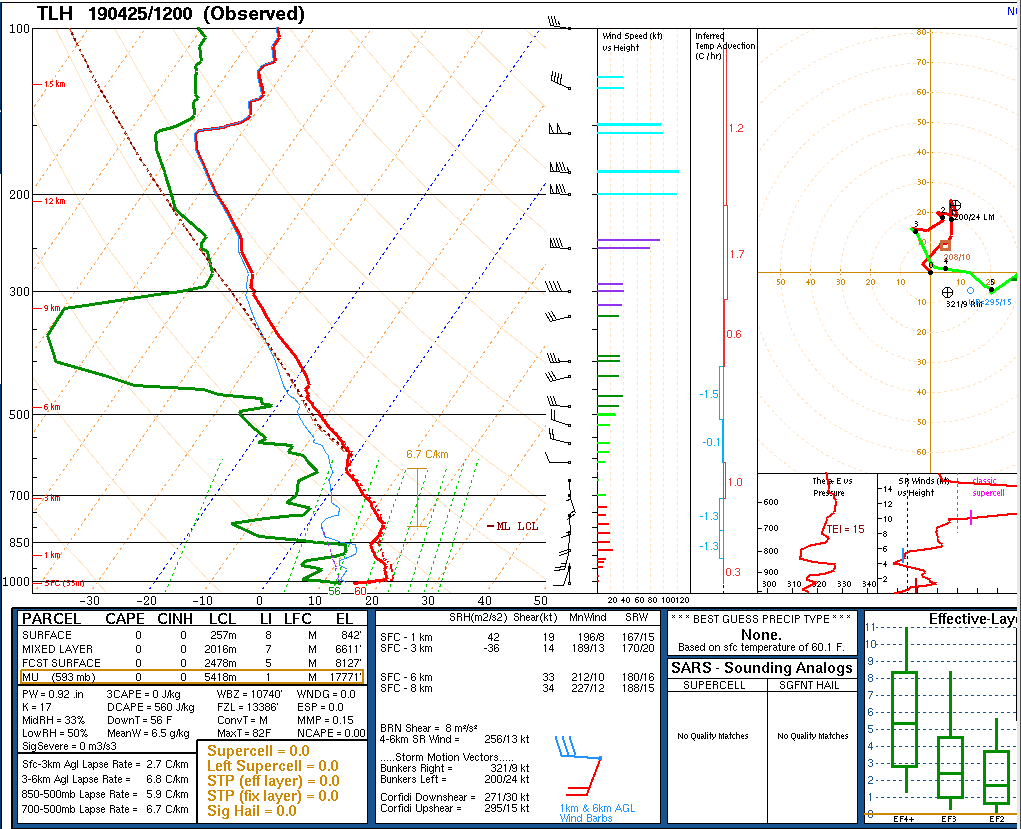
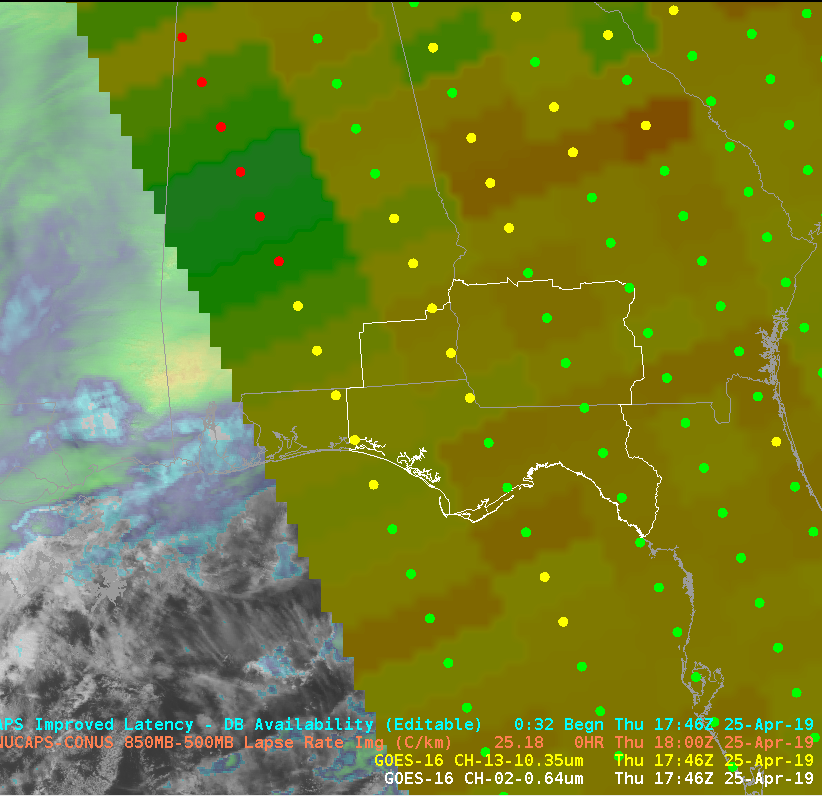 The boundary layer on the unadjusted sounding required some adjustment to match the nearest obs, but overall, seemed to capture the general profile well. I was initially skeptical about the warm nose just above 700mb, but a similar feature was evident on the 12z sounding from TAE. This feature may have an impact on storm intensity and potential hazards, and it would be particularly helpful to see how this feature changes over time.
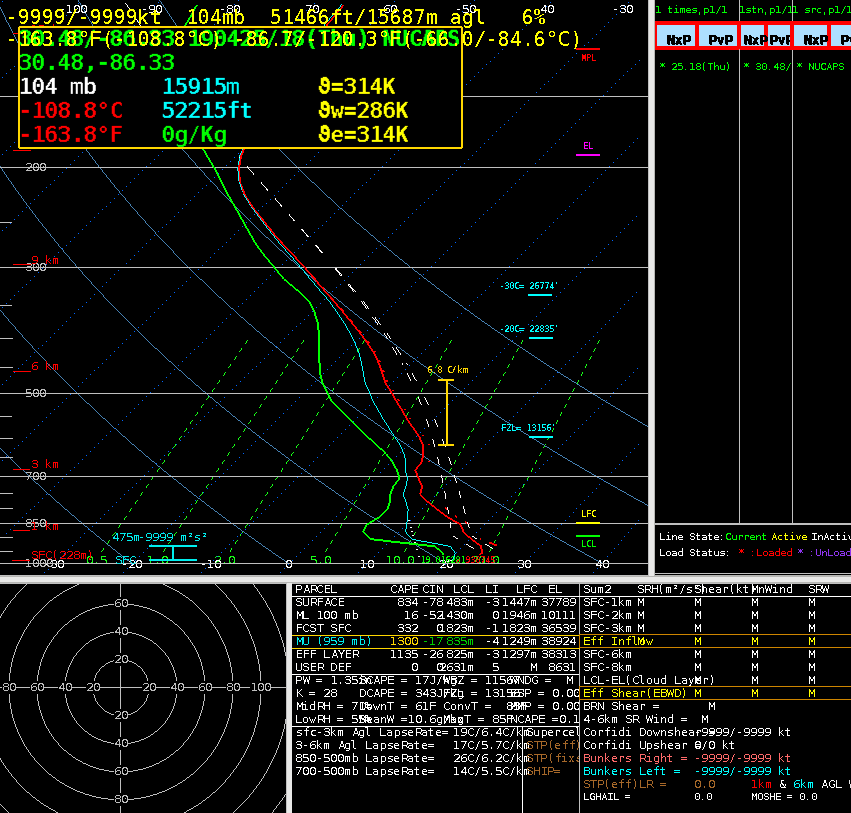
 Sandor Clegane
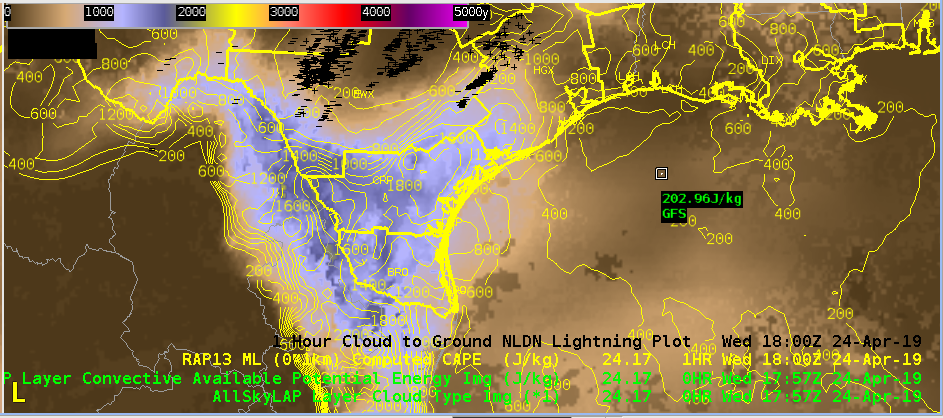
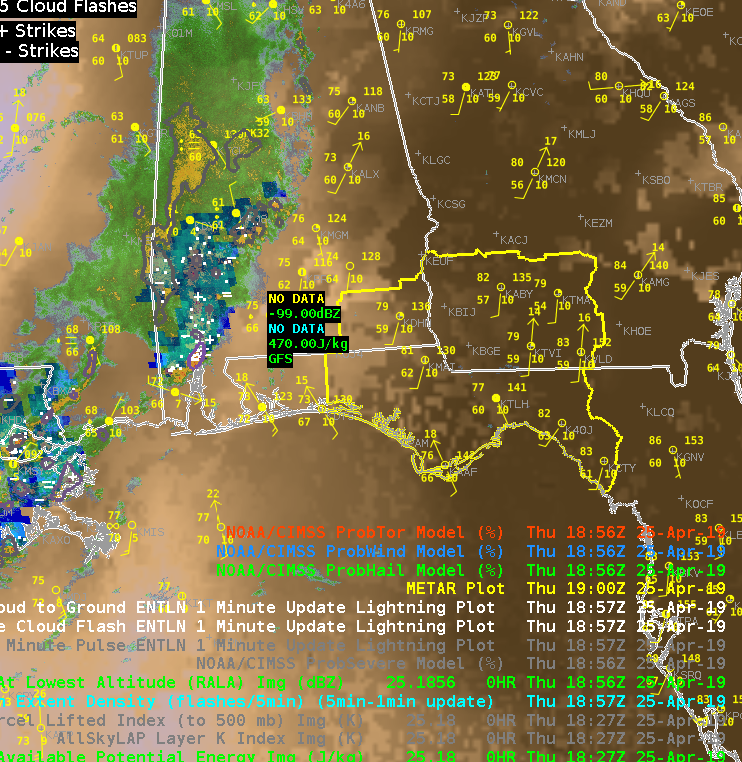
 All Sky LAPS retrievals indicate ML CAPE just shy of 1000 J/kg, but with this environment, I would expect instability to be higher.
 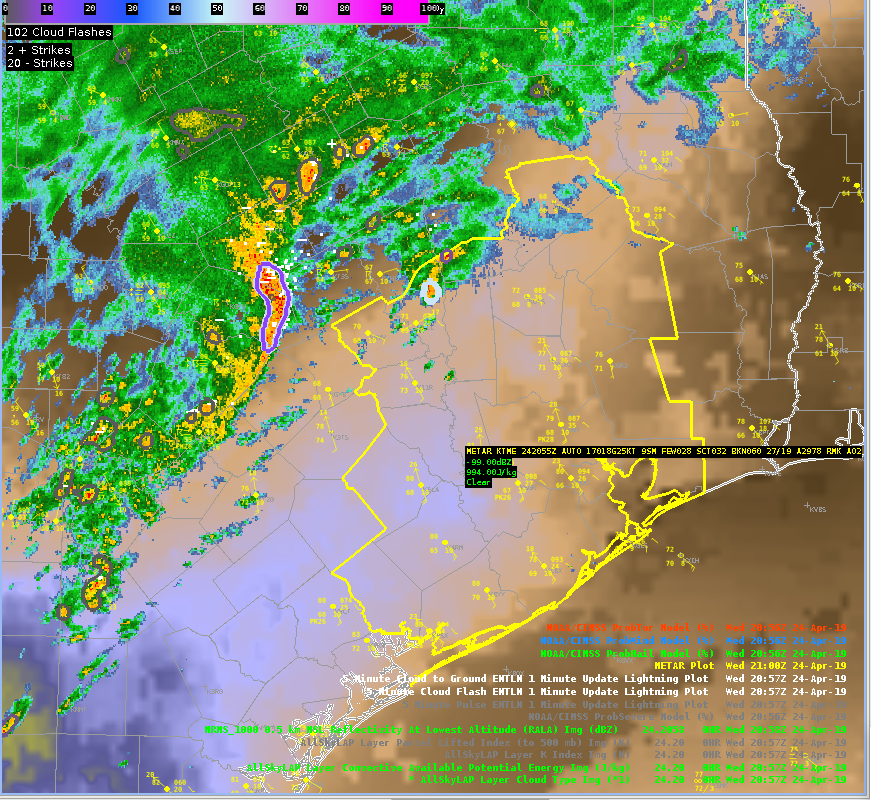 The modified NUCAPS shows a profile more in line with what I would expect to see. In this profile, the surface dew points were close to what surface obs show, but the surface temp did need to be adjusted up a bit. This sounding, coupled with analyzed deep layer shear, leads me to think severe weather is a possibility in this area.
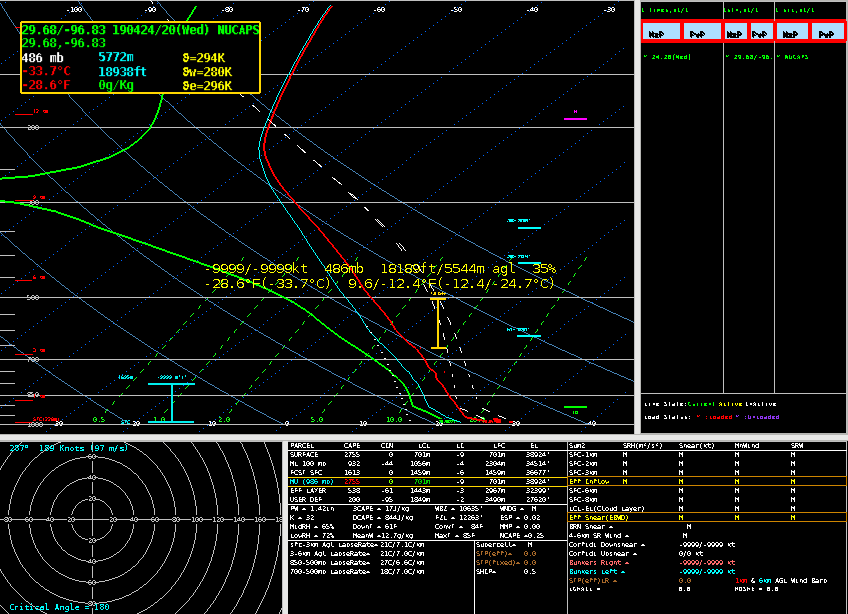 Sandor Clegane