AllSkyLAP Instability and Moisture Analysis

A 4 panel showing CAPE (top left), along with 3 different PW images shows the moisture and instability profile across the panhandle region eastward into the southern Plains. The CAPE images show the warm frontal boundary lifting north through the morning, with instability eventually spreading into the far southeastern corner of the AMA CWA. The dryline shows up well in the surface-900mb PW imagery (bottom left) as well.

-64BoggsLites

Using All-Sky LAP to Identify Areas of Destabilization

Rapid destabilization is occurring over portions of northwest Texas and southwest Oklahoma. This can be seen in the all-sky LAP CAPE product:

Looking at a four-panel image of all-sky LAP precipitable water for the entire layer, as well as the surface to 0.9 sigma, 0.9-0.7 sigma, and 0.7-0.3 sigma levels, we can see why this is the case. The top-right image shows low-level moistening in the surface to 0.9 sigma layer, which is confirmed by surface observations showing dewpoints rising from the low-60s to the low-70s over the course of 6 hours. Meanwhile, the bottom right image shows midlevel drying associated with steeper midlevel lapse rates advecting into the region.

Ron Dayne

Using All Sky CAPE to identify warm front and dry line

Just getting to look at the potentially very volatile day here in central OK, so wanted to start be looking at the All Sky CAPE to help identify the movement of two critical boundaries, a warm front moving northward, and the dry line moving eastward. This loop very nicely shows the advancement of the two boundaries over the last couple of hours, with a surge of CAPE moving into the southern half of Oklahoma. Observations are overlayed on the clear sky CAPE for verification. Useful product for SA today.

Thorcaster

A Day to Compare

I initially wanted to compare model data, especially skew-t’s, that I usually use, to the NUCAPS products. My purpose was to  ascertain the feasibility of replacing or supplementing  point based model products with NUCAPS. As I was unable to access the model data I use daily I decided to compare NUCAPS with NAM and GFS.

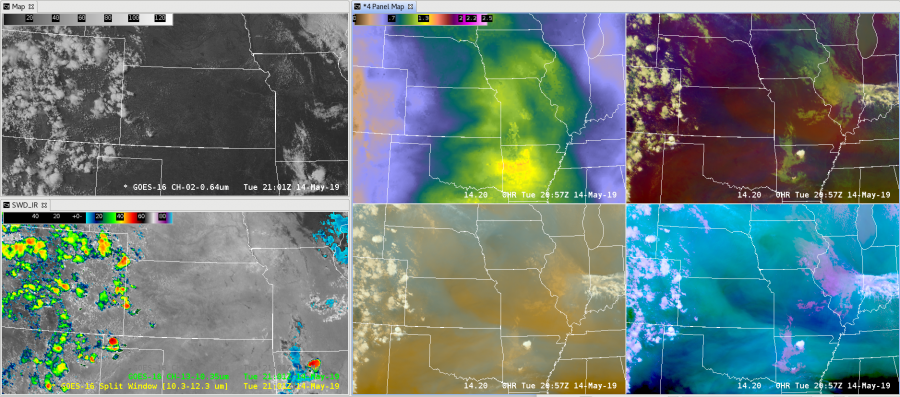
First the comparisons in the rapidly changing thunderstorm environment in which I interrogated a large MCS over the Illinois/Indiana border.

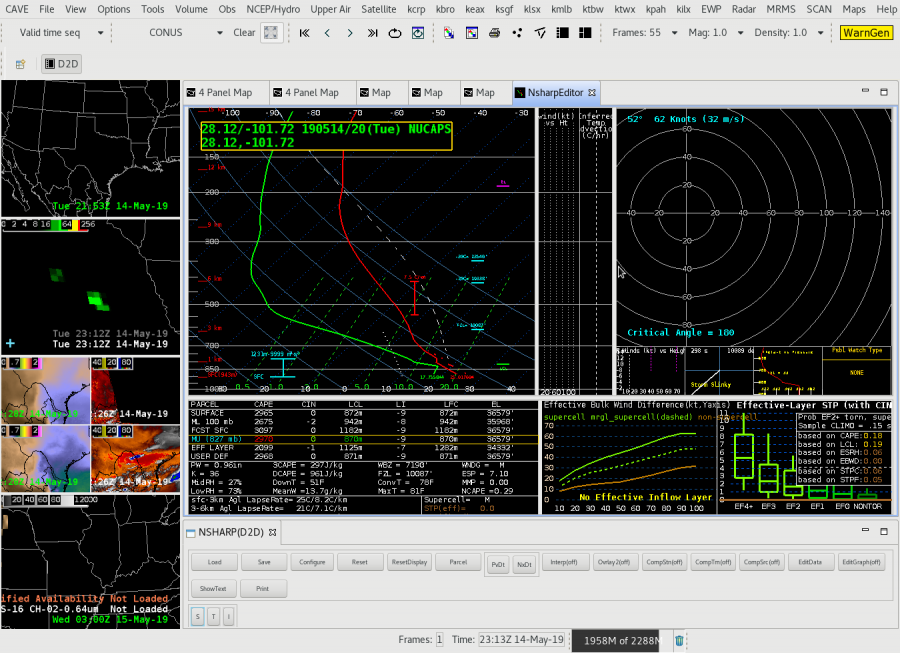
I compared NUCAPS 18z skew-t (from clear air area) to NAM and GFS skew-t’s, at the same time and location.

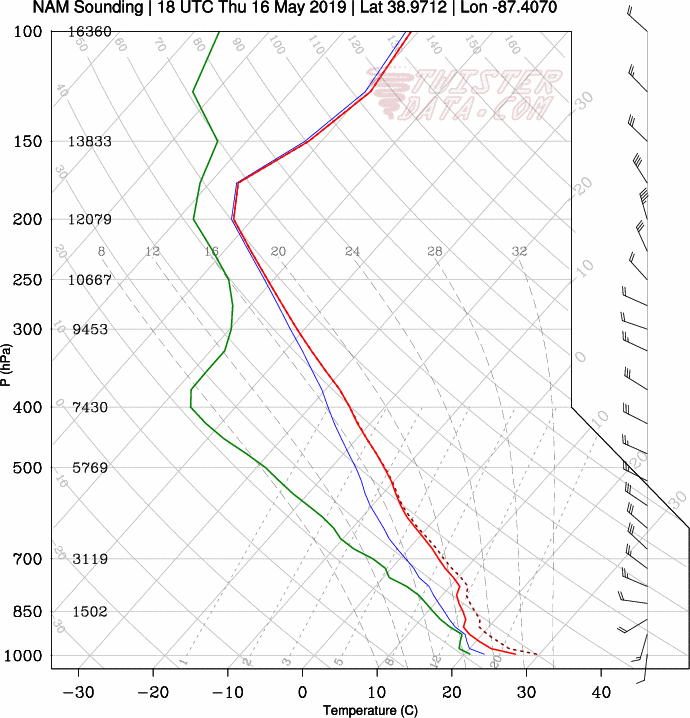
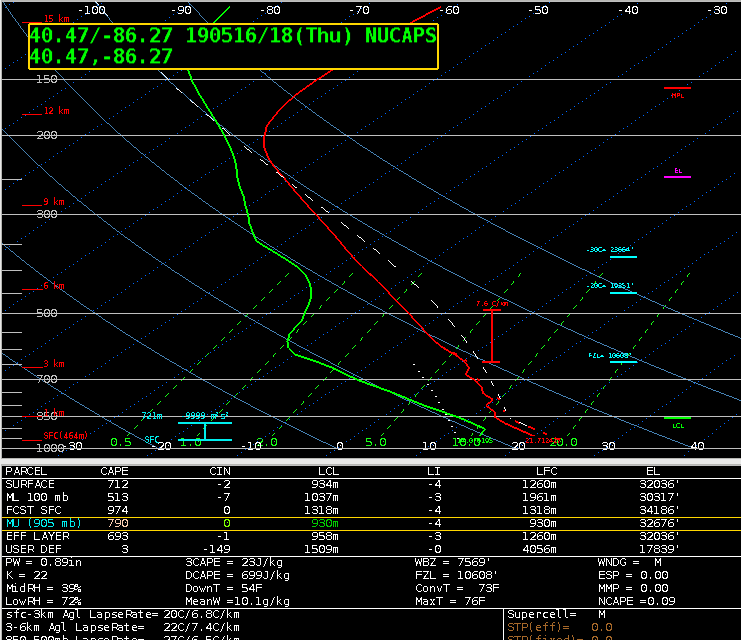
NUCAPS presents a much more stable and dry environment than the model skew-t shows, and also much more stable than the actual current environment considering this storm has already produced hail, tornadoes and heavy rain.

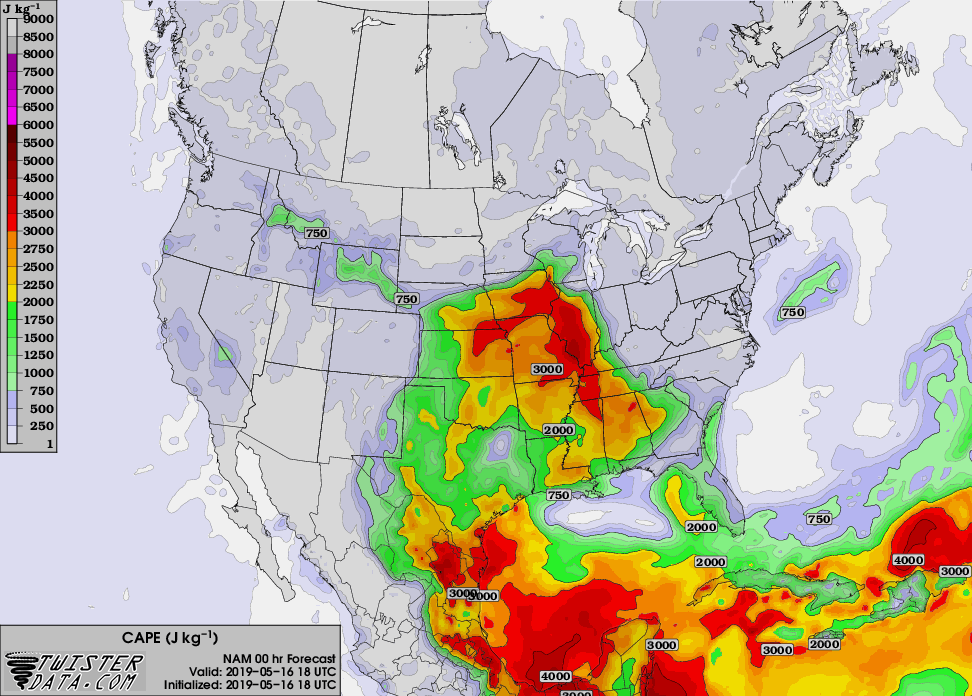
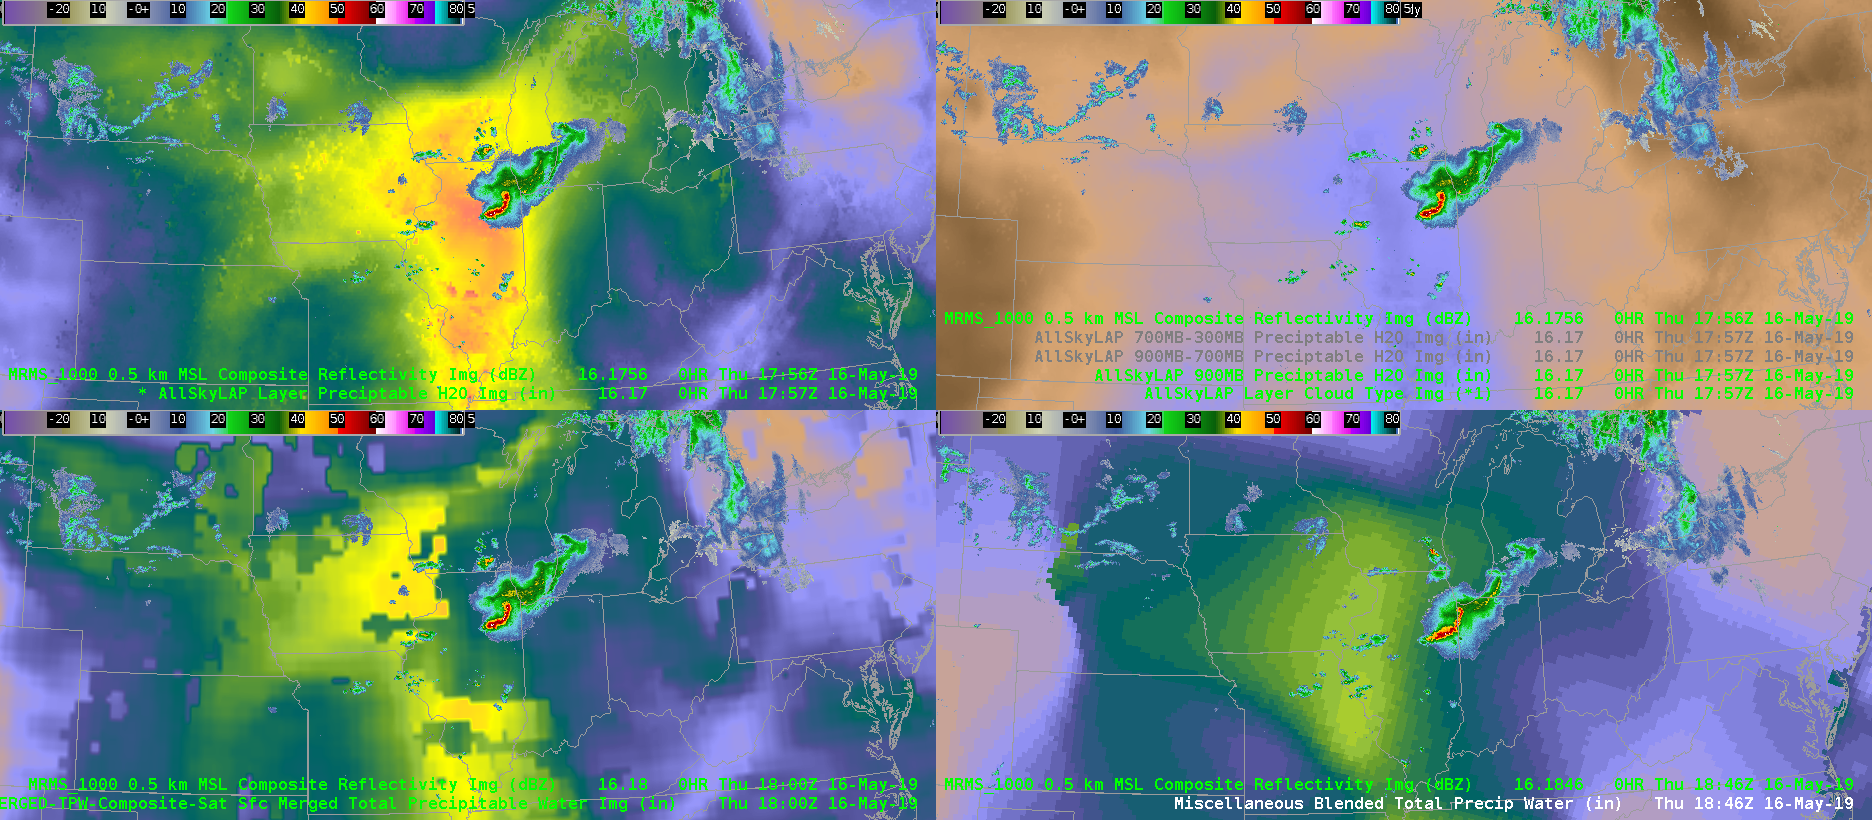
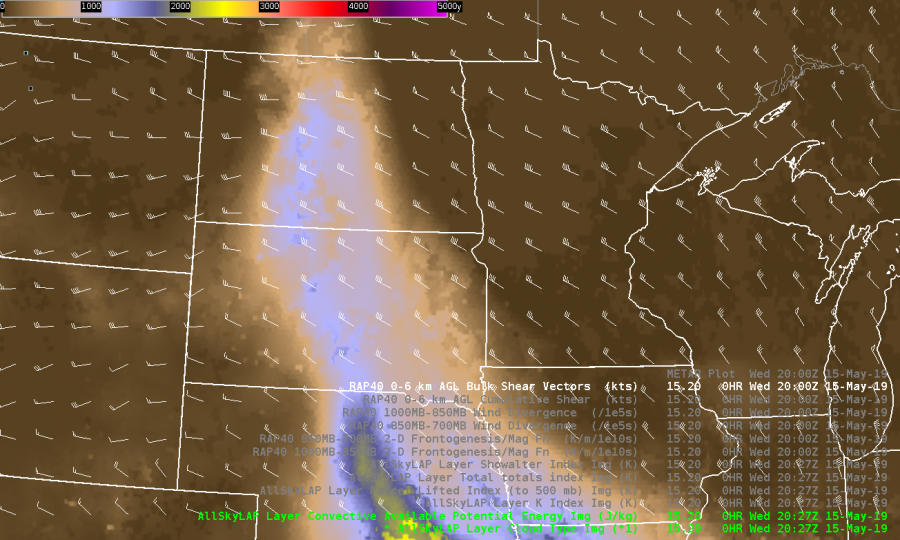
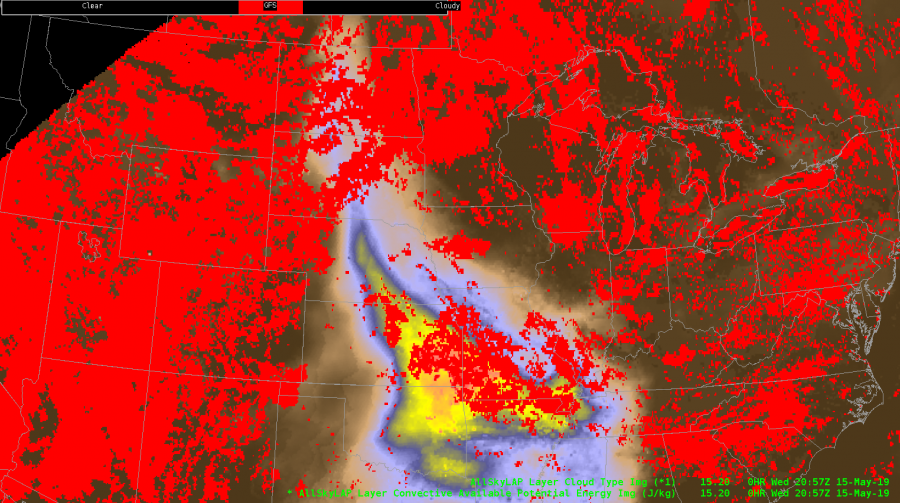
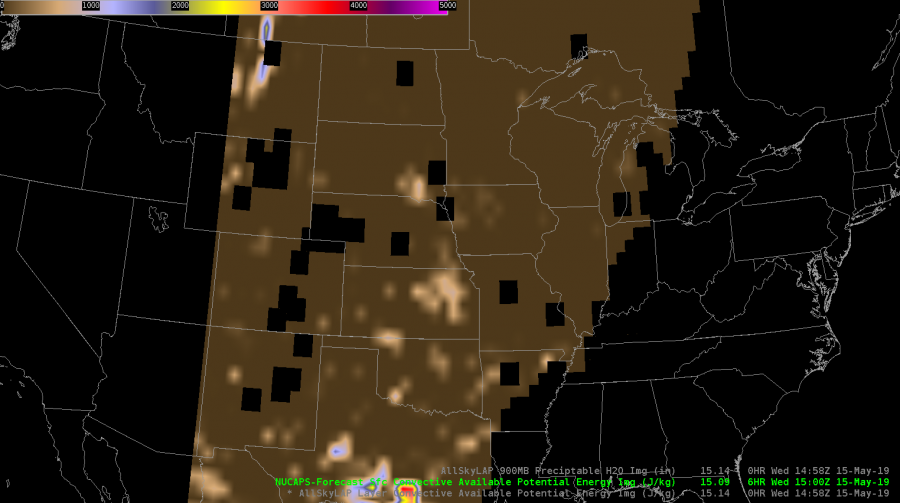
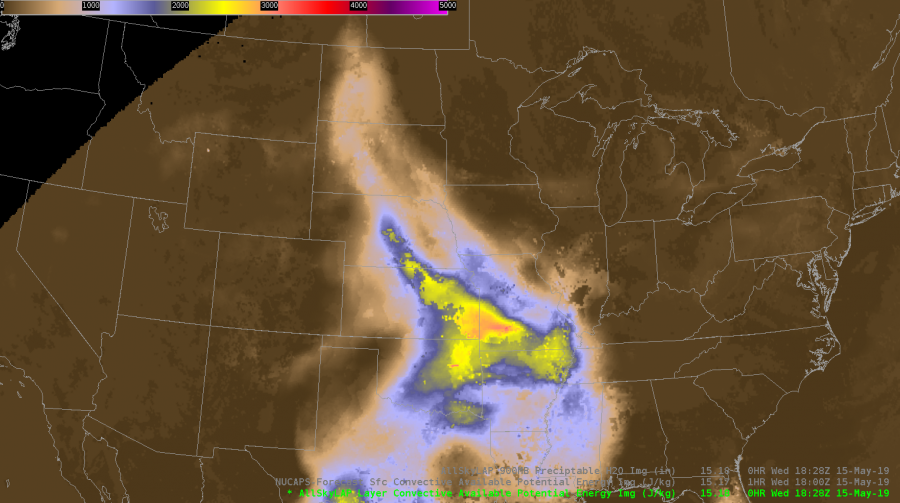
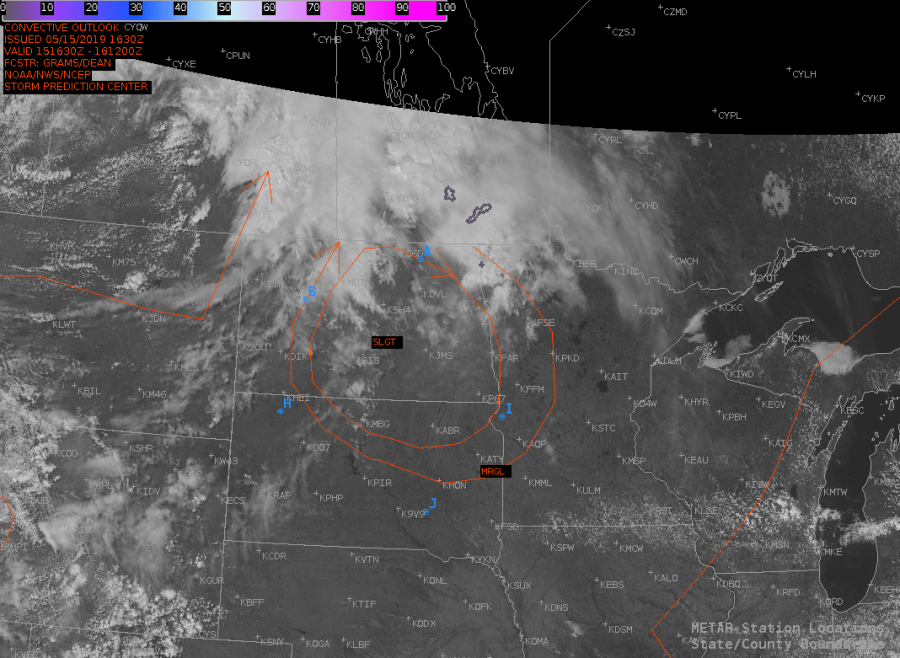
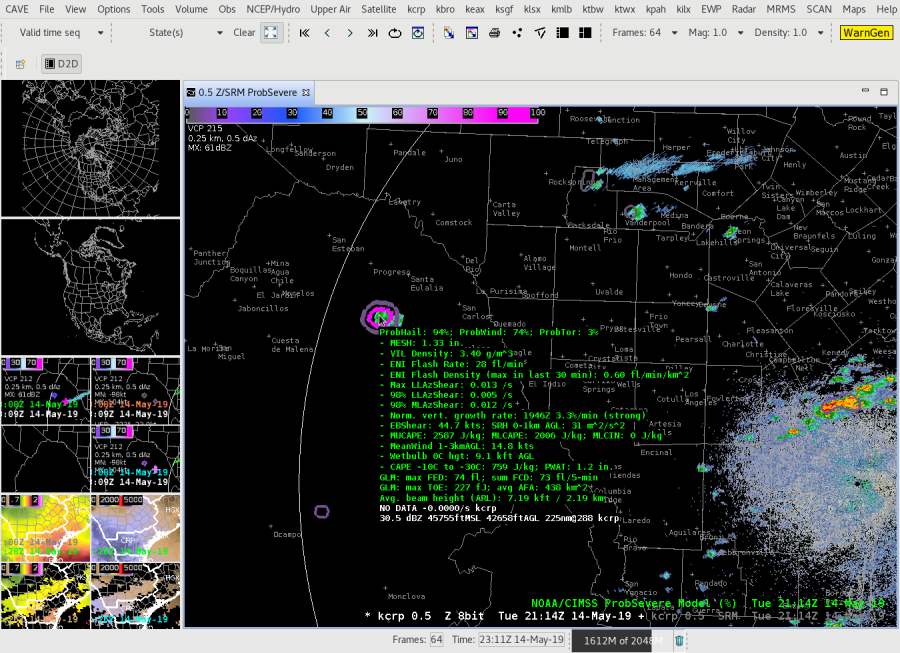
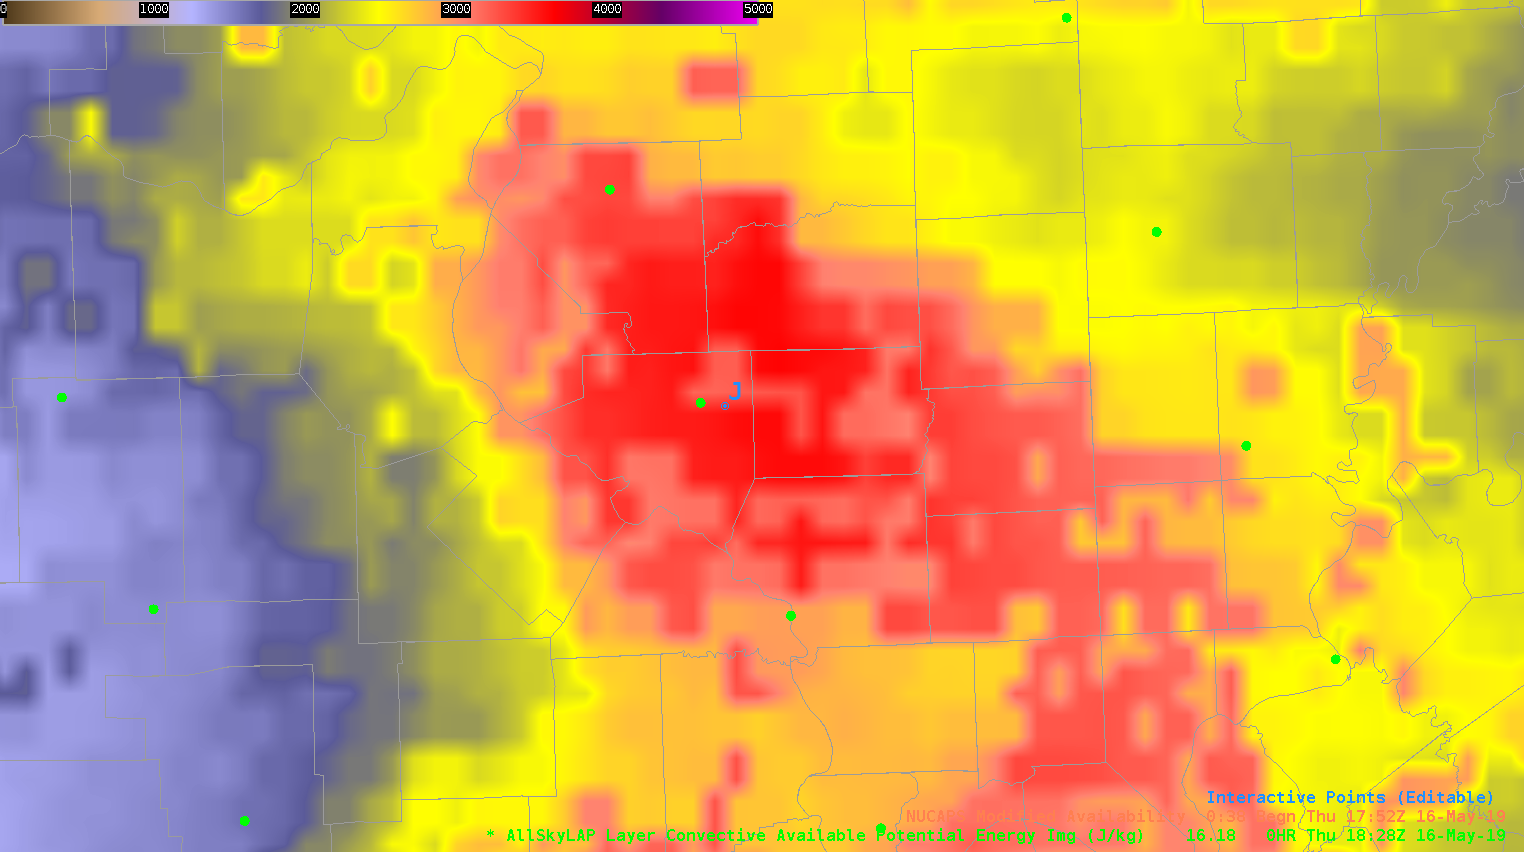
Next, I compared an AllSkyLAP CAPE img at 18z (point J on the above picture),  to a NAM CAPE map over the same area/time. AllSkyLAP seems to be about 500J/kg higher than the NAM CAPE map.

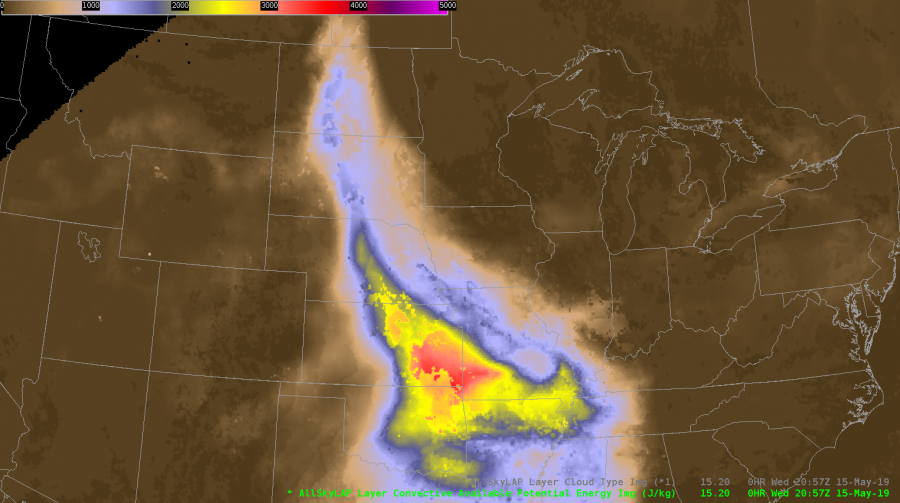
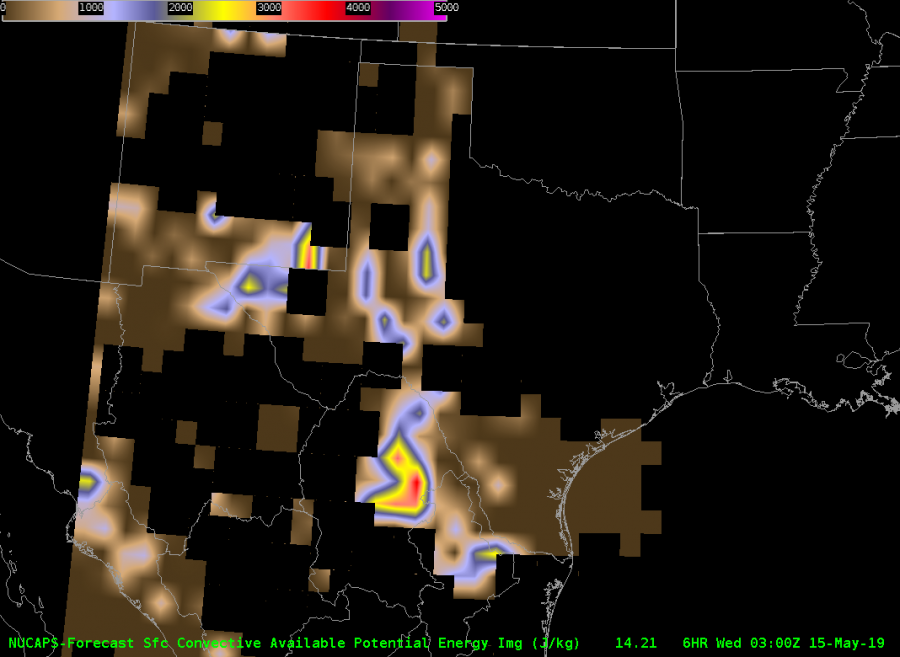
Finally, I compared a NUCAPS CAPE img and the NUCAPS Skew-T at 18z over the same area and there was a huge variance. The skew-t was higher than the CAPE img by over 1300J/kg.

Lastly I decided to compare NUCAPS and model data from a stable area, non changing area.

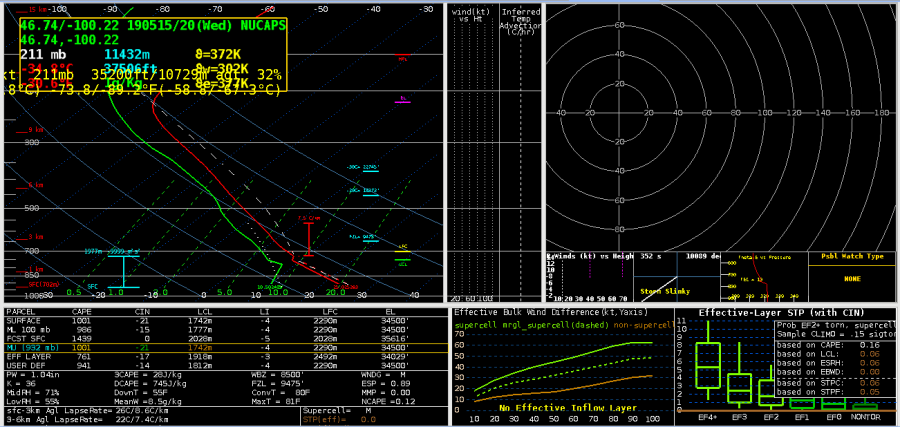
I compared an observed skew-t from the KS/OK boarder to a NUCAPS skew-t. There is a one hour difference in the data but for the sake of this comparison I think this will work. 

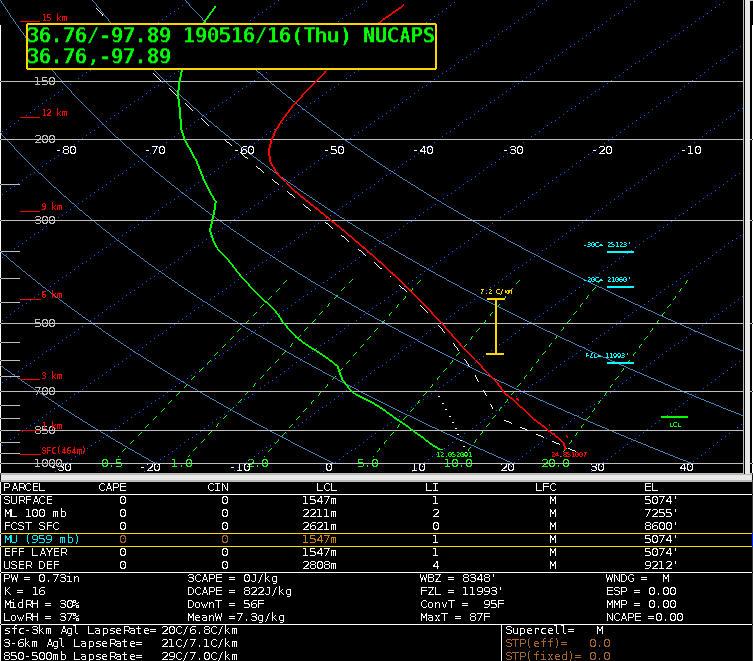
The observed skew-t is a relatively dry column with .87pw and a T/D of 31/20C  at the surface and 10/-20C at 700mb. The CAPE is at a ridiculous 3746 J/kg. But with no moisture, lifting mechanism nor shear I wouldn’t expect development. When compared to the NUCAPS skew-t one can see a definitive difference. CAPE on the NUCAPS is at 0 with T/D at 24/11C at the surface and 7.9/-9.3C at 700MB which is a huge departure from what the observed skew-t showed…but how would the observed skew-t hold up to a model skew-t?

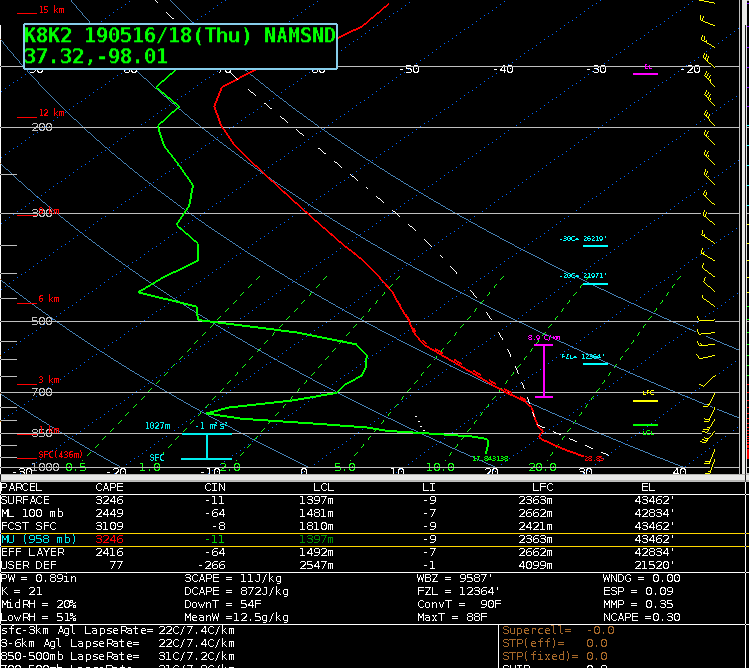
NAM 18Z model skew-t compared to the 17Z observed skew-t from the same area shows 28/17C SFC temps, only 3C off from the observed skew-t and at 700MB NAM shows 9.5/-8C only .5C off the temperature and 11 off the DP. Also, CAPE was much closer than when compared to the NUCAPS where SFC CAPE on the NAM is 3246J/kg and 3746J/kg on the observed.

Overall, after this small sample size of data, both severe weather and in clear weather, I believe that I would continue to use NAM/GFS over NUCAPS for my point based forecast needs.


***DESMOND***

Love the AllSky TPW!

Here’s just a quick example of today’s TPW over the Midwest where a complex MCS and discrete supercell are located. The blended TPW is very low-resolution and therefore you miss the enhanced values that might be located over IL compared to the rest of the upper Midwest and southeast U.S.  The AllSky products in IL are mostly using GFS, which may or may not be reliable, but at least it gives a better emphasis and resolution in where to focus your attention….as well as data underneath the severe storm complex. Over central IL, the TPW values are around 1.5 inch vs. the 0.9 inch for the blended TPW.

Animation below shows: Upper Left AllSky All Layer TPW, Upper Right AllSky sfc-900mb TPW, Lower Left Merged TPW, Lower Right Blended TPW

Below is a screen shot of the MRMS loaded at a similar time over the TPWs to see the impact of the cloud cover.

Comparing SWD with All Sky LAP PWAT

Trying to see how well AllSkyLAP Precipitable Water (upper middle pane) responds to subtle changes in low level moisture. The lower left is Split Window Difference (SWD) and upper left is visible imagery as a sanity check for no cloud cover. Also have airmass RGB (upper right) and differential WV RGB (bottom center) for comparison.

Note some slight darkening over KS possibly associated with some deeper subsidence seen on the diff W/V RGB.


NUCAPS and AllSky Helpful in BIS

NUCAPS and AllSky both were helpful in tracking the afternoon destabilization over North Dakota today. Both data sources provided what seemed to be fairly accurate assessments of CAPE values. Clear sky and GFS retrievals in AllSky were similar, with the clear sky retrievals very closely matching the NUCAPS retrievals. Having a plan view depiction in AllSky was very helpful when combined with RAP shear vectors in accessing afternoon storm potential.

NUCAPS Sounding:


— warmbias —


AllSky – Buyer Beware

All Sky Layer Cape looking funky with some discontinuities around KS? Why?

A quick look at the Data Type product (below) shows only GFS being used in these suspect areas. Major caveat emptor!

All right, time to look at storms around Bismark.

#MarfaFront

Area Discussion Prior to Severe Wx Kickoff

Area discussion for the Dakotas: Lower heights area located over western S Dakota and stacks from 700-500mb and will make its way easterly throughout the day. 850mb winds from the south at 30Kts.

METSAT shows low/mid clouds moving into ND from the west with clearing over the center of the states where wx is expected. Upstream surface observations support this clearing as they show dry air advecting into the area from the south.

Radar shows weak convective activity to the north moving into Canada. Models and the SREF are in agreement that the majority of thunderstorm development happen around 1-3z.

Merged TPW Composite total PW values over the center of the N/S Dakota states where convection is expected according to SPC outlook is less than 1” with values between .80-.95” and AllSkyLAP 900mb PW is even lower at .30”.

NUCAPS fcst Sfc CAPE overlay CAPE values range between 400-500/kg but there are quite a few gaps in coverage.

Meanwhile AllskyLAP CAPE shows 900-1500J/kg, and NAM models show extremely high CAPE values of 3000-4500J/kg.

Local TAFs show no thunderstorms or even rain while the SPC continues to carry SLGT over the Dakotas. It’ll be interesting to see how this scenario plays out as the day progresses.

–DESMOND–

Mexican Severe Storm

A strong low level moisture gradient showed up on the Sfc- 0.9sigma AllSkyLAP image early in the afternoon south of the Big Bend region in Mexico. This could serve as an initiating boundary later in the afternoon.

Low Level AllSkyLAP and Low Level IR/WV top, mid level AllSkyLAP and IR/WV bottom

A look at the NUCAPS Forecast CAPE from the ~21Z pass showed over 3000 J/KG of CAPE at the 03Z Forecast hour. Earlier forecast hours (00-02Z) were missing data, however, if you interpolated between available data points, it seemed as though there was a maxima of CAPE in the area. It was noted that a storm developed around 21Z.

NUCAPS Forecast 03Z Forecast

To gain more detail, I clicked on a NUCAPS modified sounding east of the low level moisture gradient in the vicinity of the storm. It’s clear this is a very unstable sounding, capable of producing (at least) large hail. This clued me  in on how fast the storm could become severe. Certainly would not have had a special 19-20Z sounding in this area without NUCAPS and would have solely relied on model forecast soundings.

NUCAPS sounding from Mexico ahead of low level moisture gradient at 20Z

Even though it is far away from the KCRP radar, prob severe quickly showed the developing storm ramp up and have very high severe hail (and wind) probabilities (roughly within 15 minutes of initiation). If the NUCAPS forecast is right, this storm would likely continue into the evening given the abundant instability.

Prob Severe from KCRP looking in Mexico

-Tempest Sooner