An official website of the United States government
Here’s how you know
Official websites use .gov A
.gov website belongs to an official government
organization in the United States.
Secure .gov websites use HTTPS A
lock (
) or https:// means you’ve safely connected to
the .gov website. Share sensitive information only on official,
secure websites.
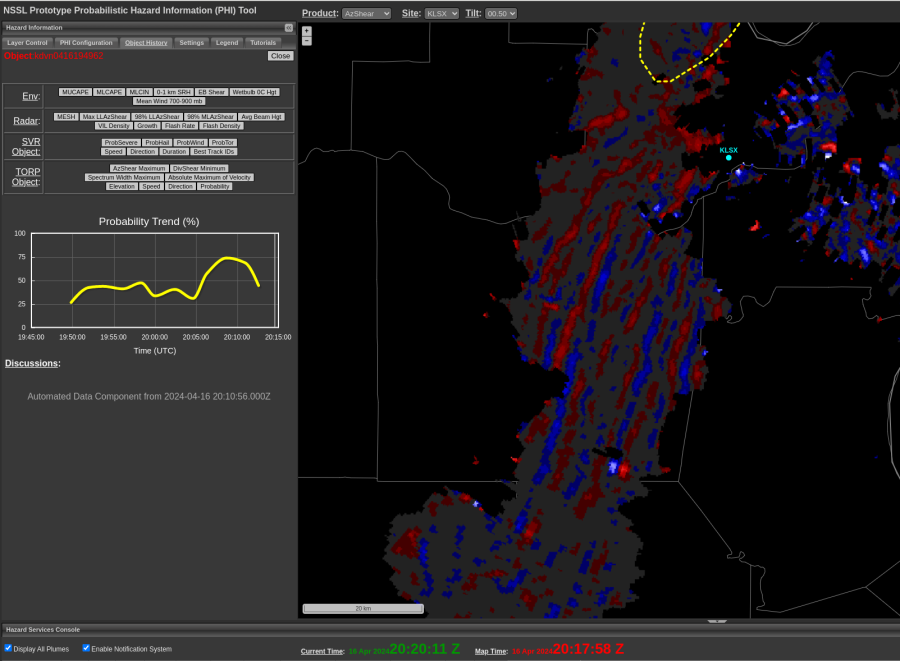
An interesting example of beam blockage filtering where an area of higher reflectivities bisecting the beam blockage was assigned a storm identification after the spurious values of AzShear was filtered out while those in the area of lower reflectivities were not.
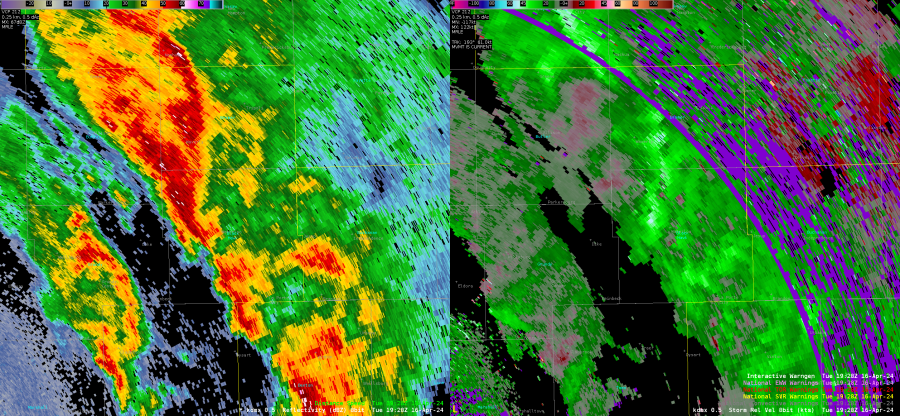
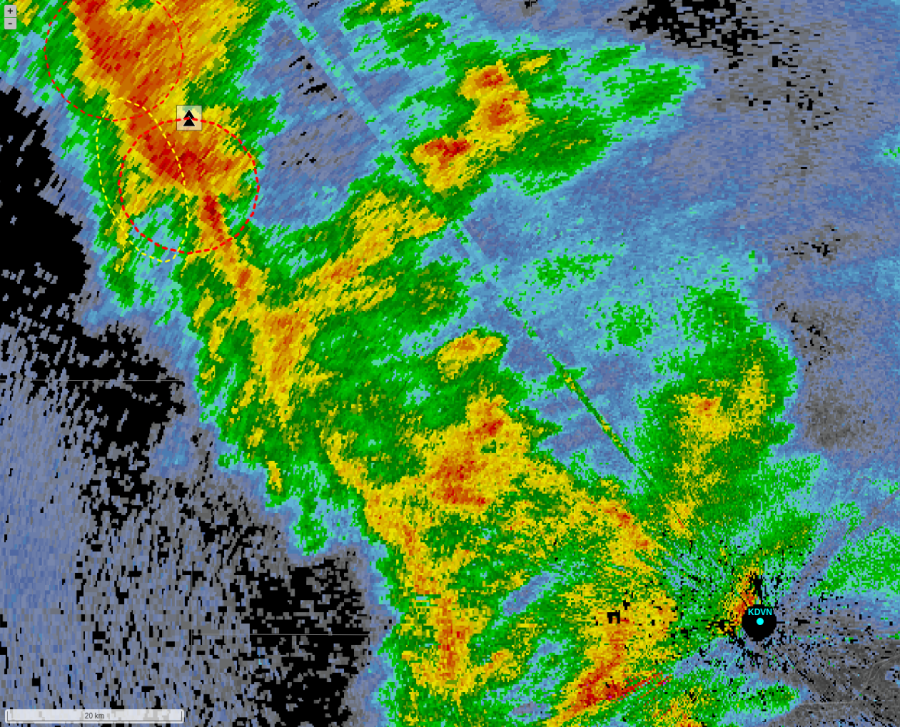
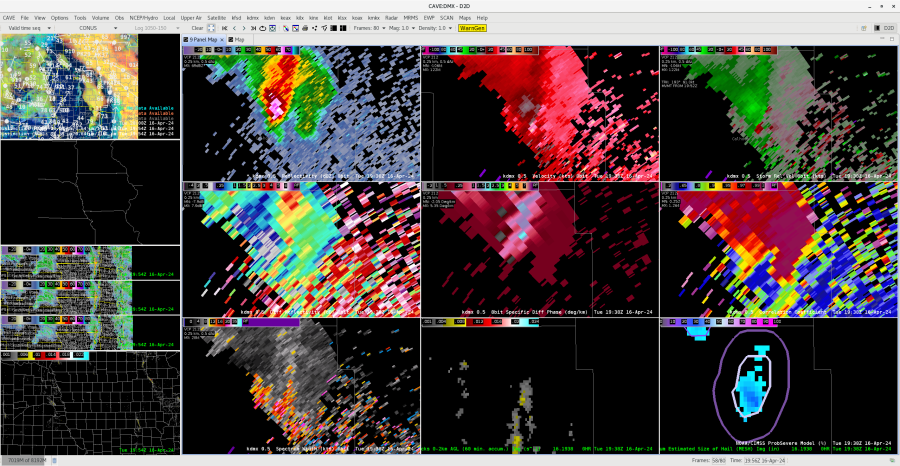
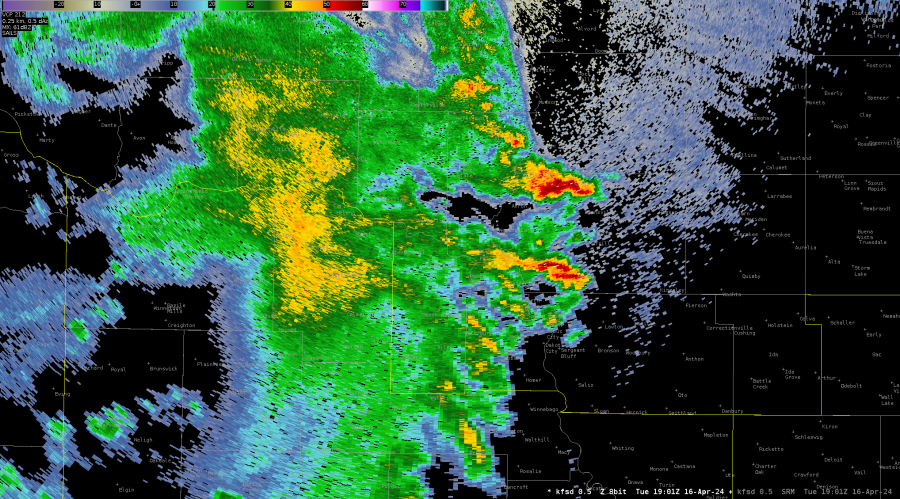
During today’s real time case, one line of storms drifted off into the extreme northeast corner of our CWA (DMX). This corner reported meteorological echoes at about 150 km away (just shy of TORPs max effective range of 160 km). At the southern end of this line, a convincing hook signature with an admittedly broad mesocyclone caught our eye.
The long range line with hooking reflectivity and somewhat broad (but present) rotation.
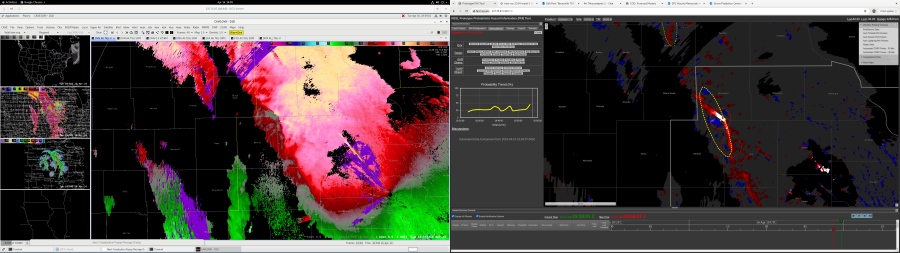
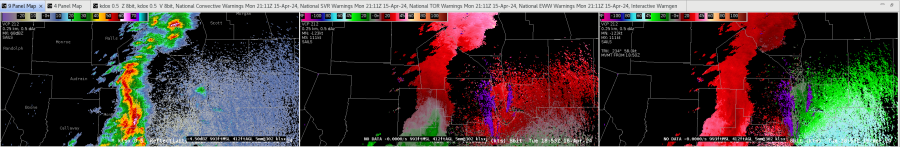
Despite this, TORP was not creating any objects along this line with our selected radar (KDMX). Upon selecting the option to overlap other objects generated from surrounding radars, other objects appeared north of the hook in question, but not over it. This was a little concerning as this the sort of feature I would expect to generate at least a low probability object. But this issue is not surprising considering the range away from any of the surrounding radars and how lofted the data is.
AzShear overlaid with TORP objects notably north of the interesting reflectivity hook.
This issue will certainly pose a challenge in areas where there are large distances between nearby radars.
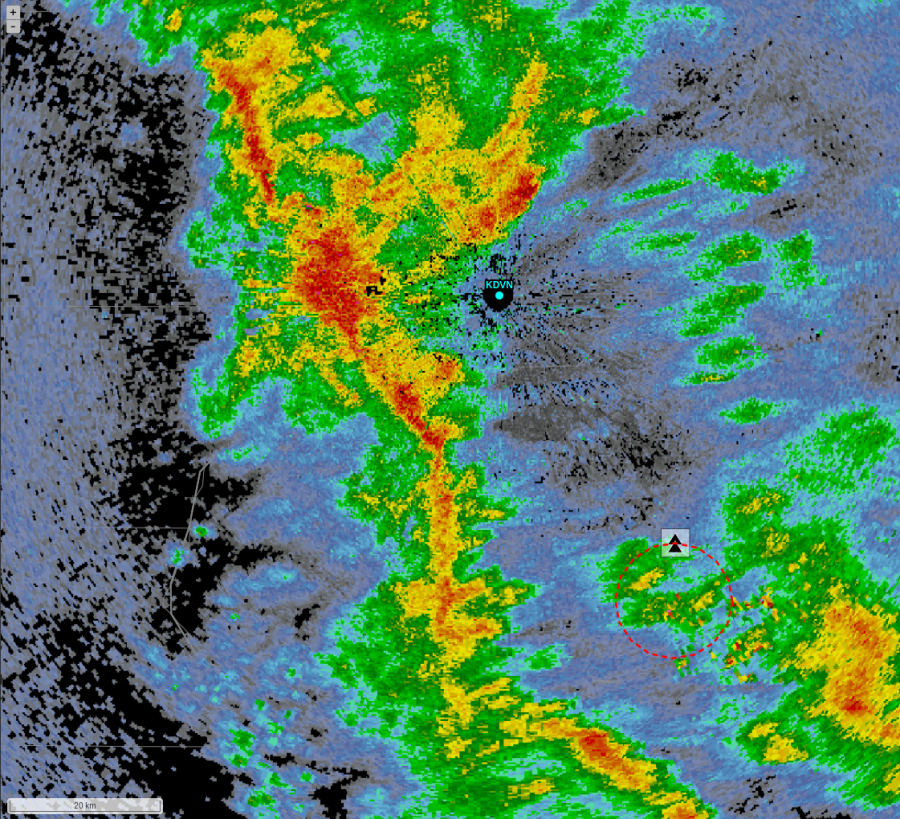
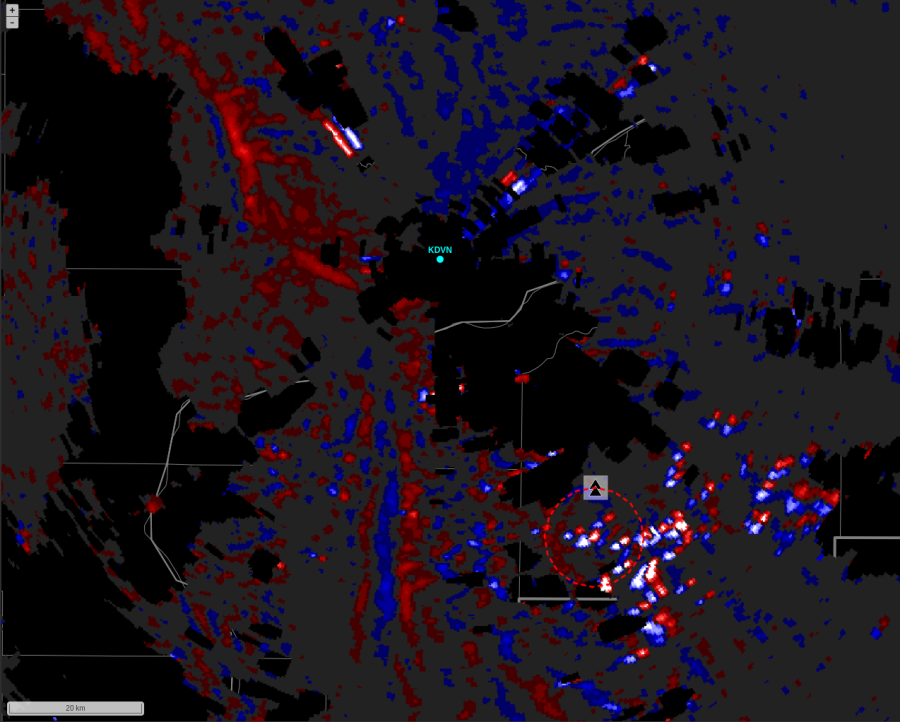
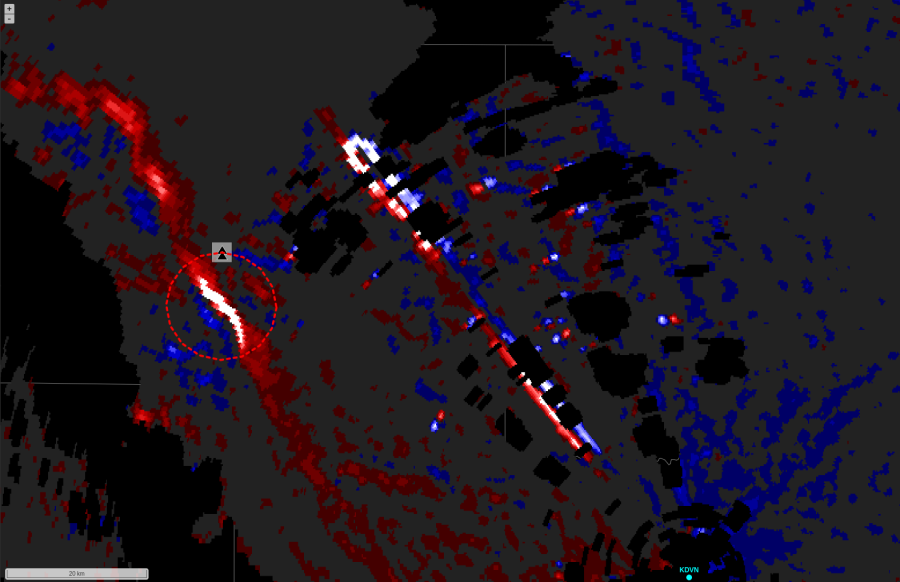
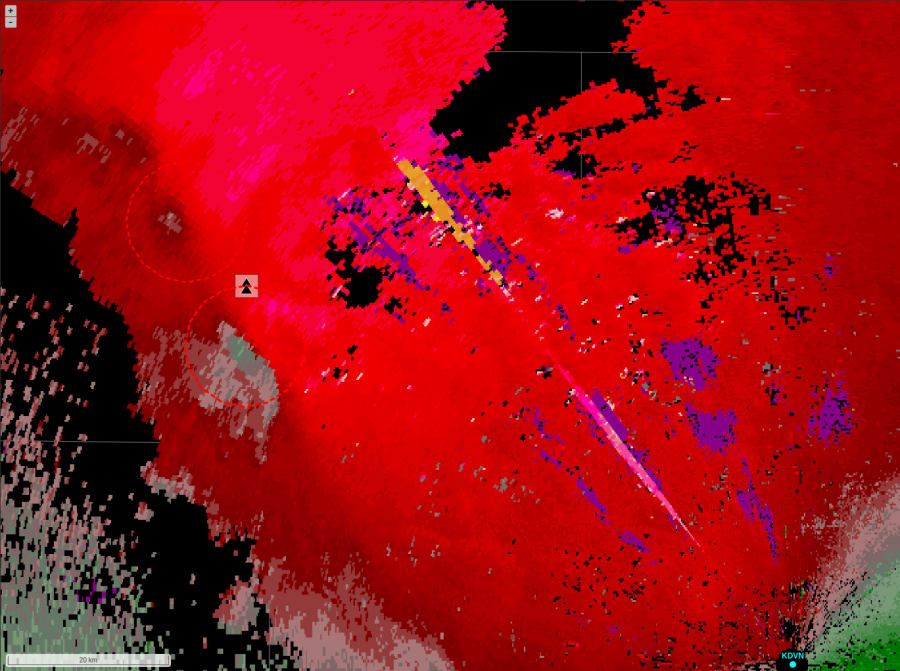
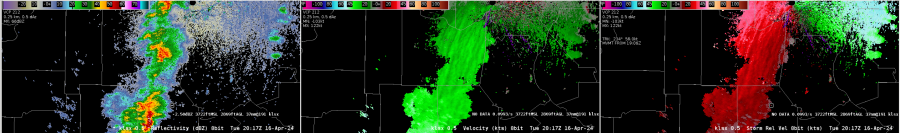
AzShear showed an interesting streak of both cyclonic and anit-cyclonic shear exactly down radial from the radar KDVN at 2025z. Just looking at that, it look like an artifact from the base velocity data down radial from the radar.
Looking at the reflectivity and velocity data, the issue seems to be beam blocking to the northwest of KDVN causing the erroneous AzShear values. Good to see that TORP is not influenced by this artifact.
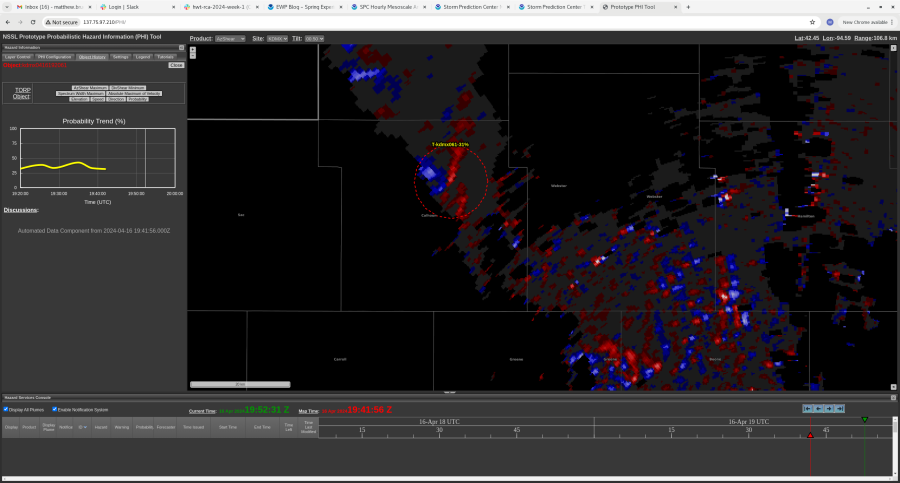
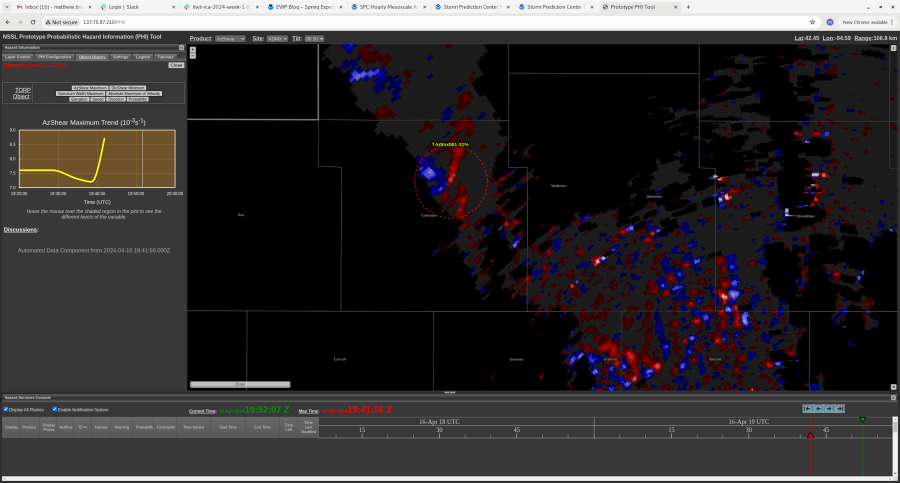
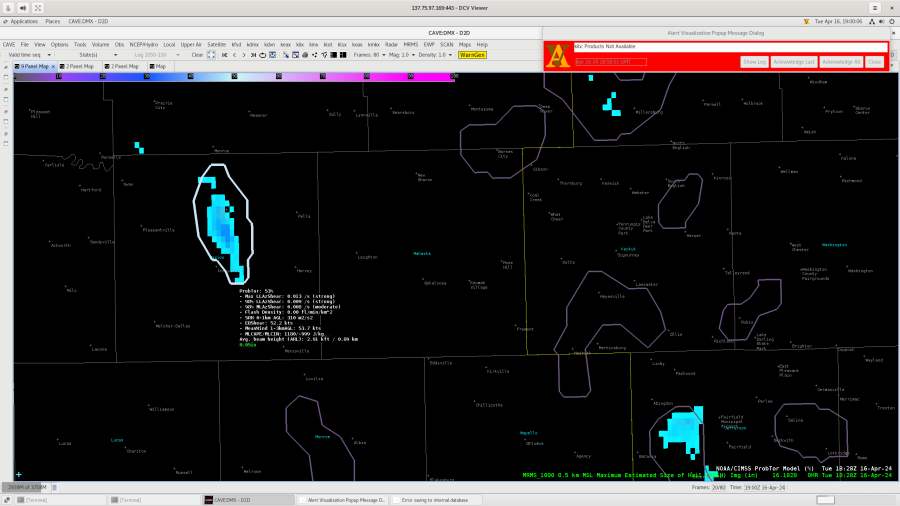
A LP supercell produced a tornado in Calhoun County, IA, on the radar scan shown in a very low Z region with little rotation evident on velocity. TORP got as high as 43% but did not have a notable quick increase as recent tornadic storms did. AzShear increased but with a quick, minimal jump. This is a tough case and, considering that the TORP ingests radar data, without a defined signature on radar it will be tough for TORP to detect anything either. -newt
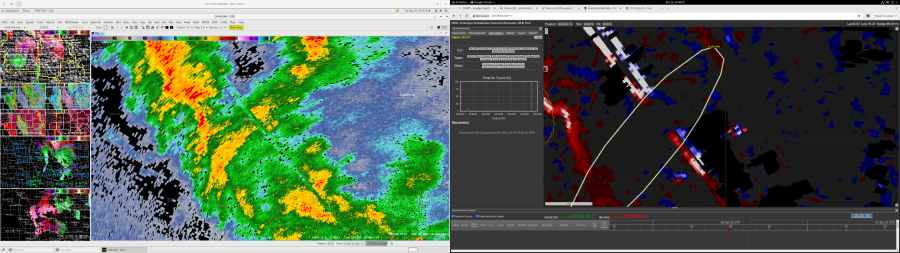
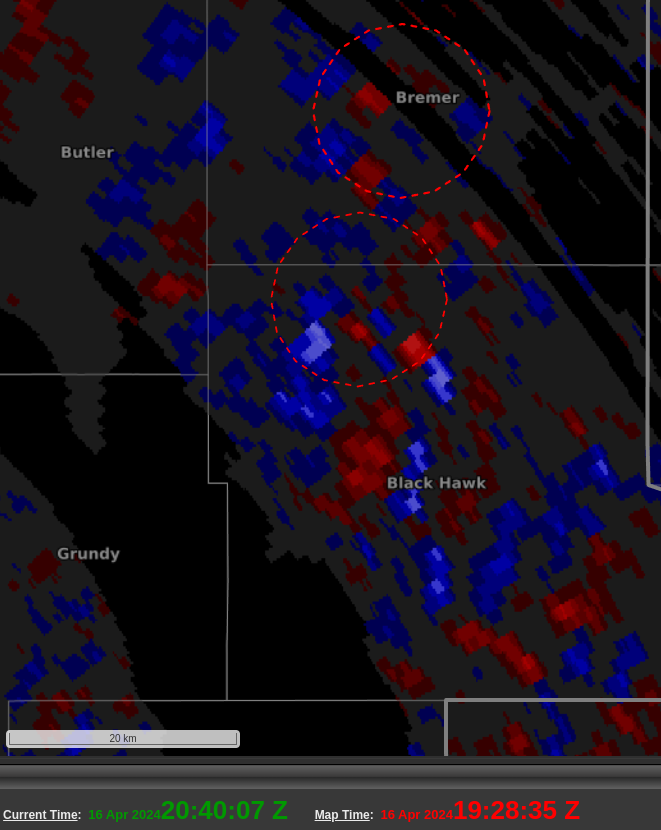
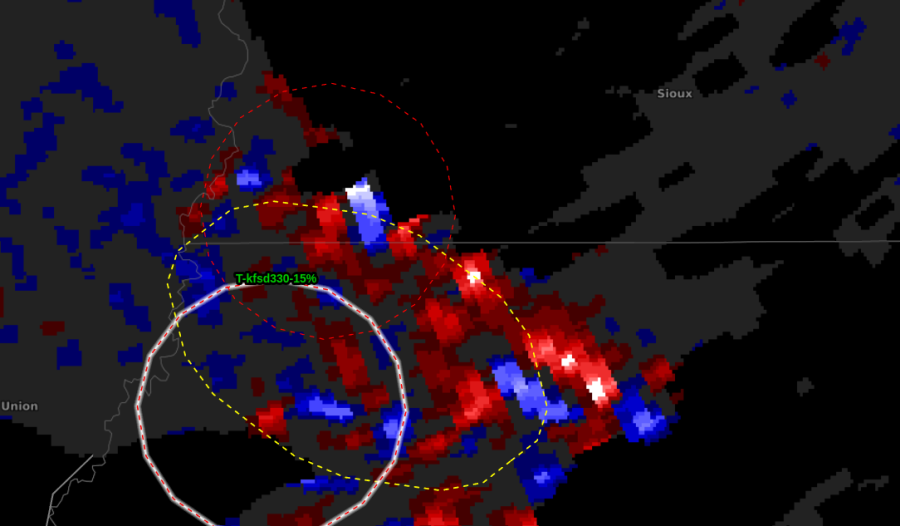
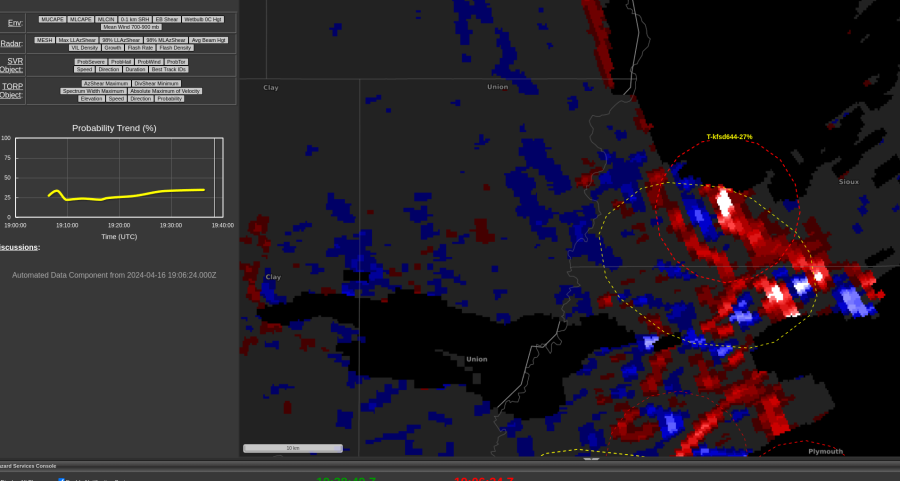
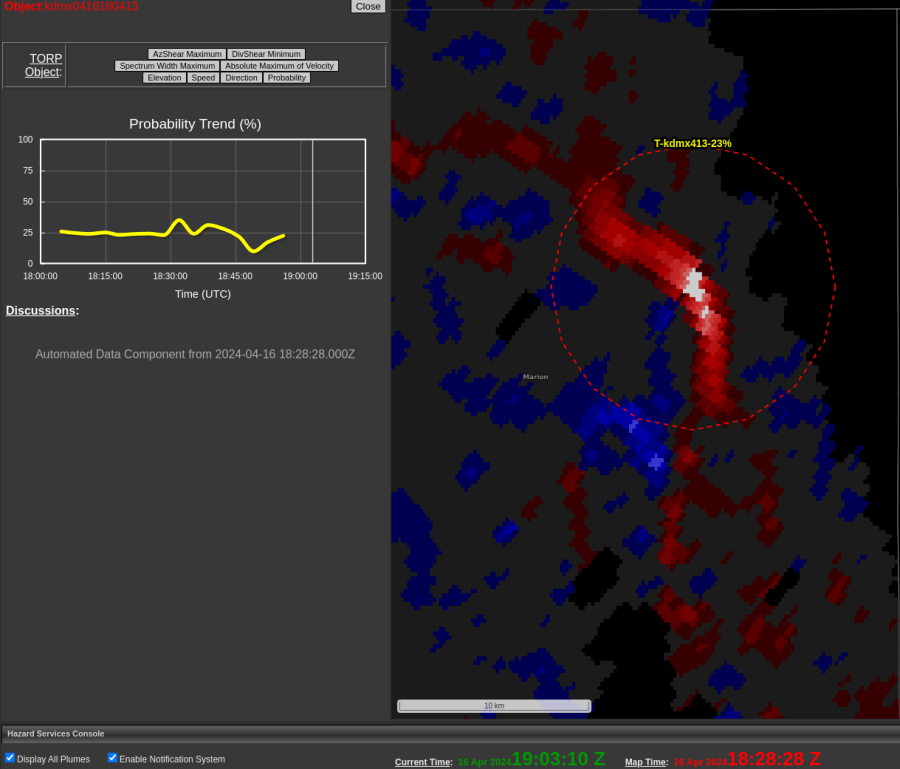
During the slow portion of our CWA being in three tornado watches (for a much longer time than one might think), we noticed a TORP object along a meager looking meso. Probabilities were relatively low sitting around 25% which we tended to agree with due to the lack of promising features among base radar products. And then we decided to entertain a look at the ProbTor model and found an estimate of 58% for the same meso. This was clearly blowing the probabilities out of the water and TORP was able to give us confidence in disregarding ProbTor’s input in this case.
Probability trends for TORP remained low for it’s detection of this mesocyclone.ProbTor model ran a much higher probability than TORP for this mesocyclone.
It’s nice to see even just one example of TORP trumping the aged ProbTor model.
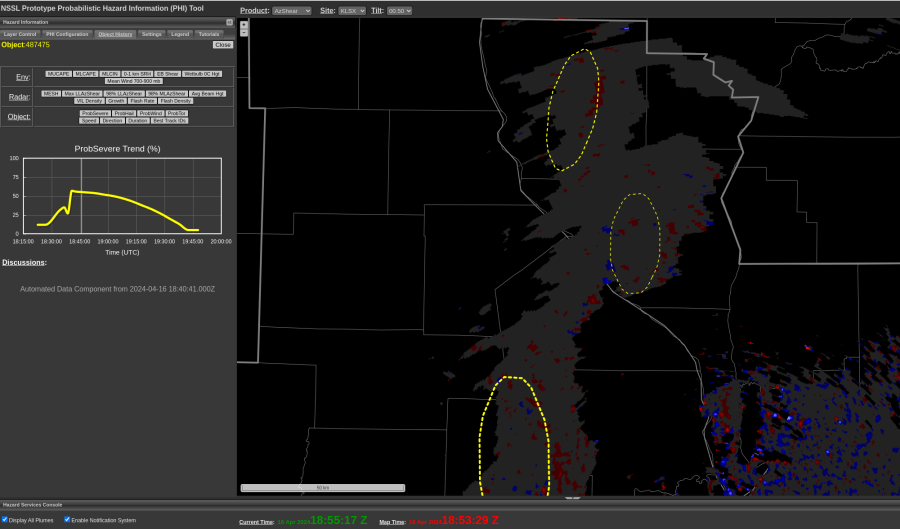
Concurrent with nebulous V/SRM data (~1850-1855 UTC), AzShear shows very low output/readings for the cluster of convection shown. Combined with assessment of environmental data, this convection appears to be slightly elevated in nature and AzShear confirms little concern for rotating outcomes in the interim. -QLCS