Forecaster Thoughts – Chris Wielki (2009 Week 3)

The EWP was a great experience and I couldn’t really ask for much more. As a meteorologist from outside of the United States I was somewhat uncertain what to expect but what I found impressed me. Technologies that we used throughout the week were useful and the exchange of ideas between researchers and meteorologists is something we too should strive for. The highlight was Wednesday when several tornadic supercells developed over Oklahoma with one passing through the CASA domain. The 3Dvar set the stage for the supercell entering the CASA domain and had us thinking about a tornado potential before appearing on the casa radars.  When the cell moved into the CASA domain the rotation was apparent and we were able to send the warning quickly. The strong winds that followed the tornado were easy to identify in the CASA dataset and warnings could likely be narrowed down as confidence increases with the use of these x-band radars. The WSR-88D data also showed the TVS however it was after the CASA data showing an obvious potential to improve lead times. PAR data and scanning strategies didn’t have any apparent faults and with the improved resolution and frequency I feel features would be singled out earlier in an event and once again lead times would increase. The LMA data has potential but I felt that I would have to get more comfortable with it and develop a conceptual model of what to expect with larger supercells. Picking out a peak in the LMA data would prove to be difficult but the graphical tool on Google earth was useful and could increase confidence in warnings already issued. There may be potential to use the LMA data for storm splitting since it would show the two updrafts however cases showing a split were limited. Last of all were the multi-radar/sensor algorithms. Returning to my office without products such as the MEHS, Reflectivity at -20, MEHS and rotation tracks will prove to be a difficult experience.

Chris Wielki (Prairie and Arctic Storm Prediction Center, Edmonton, AB – 2009 Week 3 Evaluator)

Tags: None

Forecaster Thoughts – John Billet (2009 Week 3)

Being part of the EWP was very worthwhile with the four separate test beds each offering unique opportunities. The phased array radar was extremely useful. The highlight of the week for the phased array was Wednesday night’s live event. I was working with Kevin Brown from the Norman office using the phased array to simulate test warnings for the storms. There are a number of very good features with the phased array, the fast temporal updates of 1 minute per volume scan and the higher resolution brings much better identification to features. The radar has the ability to quickly change where the range folding was occurring from one volume scan to the next which meant at most just one minute of bad data. We were able to view animated cross sections through WDSSII and actually watch the reflectivity cores rise and then come back down to the ground causing downburst signatures. The current phased array radar only has one panel so it had limited viewing as the number of storms increased. We only looked briefly at a tornadic storm in the CASA area but focused on the storm coming south from Oklahoma City to Norman which also had tornadic potential. This storm we could see the original outflow move out ahead of the storm then slow down as the storm caught up and reintensified. This is when the tornado developed which we could clearly track in the velocity and as it got close to the radar we even saw the debris swirl on the radar.

The CASA network with 4 low power Doppler radars each about 40 km apart was surprisingly useful. The fact that a 3DVAR wind analysis is done with the radar scans was very helpful. This analysis clearly showed gust fronts and rear flank downdrafts. It also picked up very well on the tornado. I had some hesitation about the system because it completes a volume scan in 1 minute and if there are numerous echoes in range it only does 1 to 2 elevation scans. I think in hail situations this could be a problem. The software is programmed to look for individual cells then scan up several cuts but we had too many cells in the area so that only 1 or 2 elevations were possible. There is also a numerical forecast of various fields which utilizes the radar data and goes out 1 hour in the future. This helps significantly improve situational awareness.

While the previous two systems are only available at Norman there are two other systems which we at Wakefield hope to access locally. The enhanced lightning detection network which includes in cloud and cloud to ground strokes has one domain centered over Washington DC. The VILMA or lightning density product helped with updraft detection and provides another reality check on storm structure. Being a coastal office and talking with the scientist about the fact that in cloud lightning almost always precedes any ground strokes, we could use this product to give some lead time at the beaches during the summer time about when lightning might occur. The lightning tied to individual cells producing trends helped in predicting intensification or weakening of cells. If the cell numbers could be color coded to indicate increasing or decreasing lightning trends this would help with quick identification of which cells might be increasing.

The final data set was multi sensor multi radar data. For now one domain is centered over Washington DC and covers all of our CWA. Some of the most useful products included real time MESH or hail forecast tracks and instantaneous size estimates. In the cases and two real time events it appeared a good estimator of hail size something always needed. These tracks could also be very useful in the proper shaping for a polygon warning. The circulation tracks are so dense it was hard to use it much but would like to look at it in more detail. There are numerous other products as well which will need to be examined but we ran out of time in Norman. We are working to set this up here for real-time use.

John Billet (NWS Wakefield VA – 2009 Week 3 Evaluator)

Tags: None

Week 3 Summary: 11 – 15 May 2009

LMA:

Kevin – Identify trends and signatures and their meaning could be useful.  Identify what’s useful in developing a storm in initiation.

Chris – Liked the trends in Google Earth.

Steve – VLMA Still needs correlation between its display and other signatures and severe weather events.  Don’t know the benefit of satellite-based sensor in areas of  regular LMA sensor.

Kristen – LMAs are line of sight so they’d need to be smartly located in topography.

John- Would anticipate what it’s coverage would be in poor radar coverage areas and also for coastal areas for advance warning of LTG for mariners and beach-goers.  Concurs more research needed.

What want to see?   Trending, manual area defining intervention to define trending (e.g., distance speed tool or a box),

CASA:

John – anticipates usefulness of 3dvar and multi radars but also big education challenge.  Would like to see vertical cross-section.  Would prefer a 2 min update if they could get some vertical structure.

Steve – Would like cross-section from multi-radar including CASA.  Wed night was a significant stepping stone was like Red Rock was in 1991.  Would like to time-match 88D, CASA, PAR in one 4-panel.

Kevin – CASA saw the circulations 3-5 min ahead of 88D in Gracemont.  Kevin walked into the WFO concerned they were seeing it.  But they had the TOR drafted.  WFO forecasters also walked into the HWT to view the CASA data.

Concerning RFD winds in Anadarko, CASA really showed the winds.  The 3dVAR picked up on the winds as well.  KTLX showed no RFD winds.

Chris – Concurs with the benefits of rapid update.  Drawback is the attenuation.

CASA wishlist:  Can a manual scanning override be accomplished?  This is a workload strategy that could be accomplished by having someone managing scanning while the other interprets storm structure.  The software would need to be made simple.

Would an attenuation product be useful?  Unknown at this time.

PAR:

Kevin:  Liked the mid- upper-level resolution.  Midlevel mesos tightened up more quickly in PAR than 88D.  Did not see any adverse effects of adaptive scanning.  Perhaps would like to see a more frequent full volume scan in explosive initiation environments.  Edge of sector had a bit more velocity problems.

Chris:  Lot of more features visible on PAR.

Steve:  Data quality was better this year’s experiment.

John:  Anticipates much better detection of descending cores in low-shear event.  Worth having superres even with more time.

What tradeoff are the forecasters willing to consider  if one is required to see clear boundaries around the storm?  They are willing to consider a tradeoff depending on how important it is to see the boundaries.

Kevin:  Is CASA network refractivity conceivable?  Feb 10 case refractivity could’ve explained why the following supercells weren’t tornadic.  Could it compensate for sacrificing scanning frequency for sensitivity.

Chris:  Wondered about the impact 2.1 deg beamwidth on edges of sectors?  There was some impact but would be limited in the future with hardware upgrade.

Adam wondered about most what was the most useful scanning stategies.  Not much difference…all were good. 15 elevations was sufficient.

Kevin:  Changing the PRF could be made easier to do but liked the immediate feedback in the PAR.

Multi-radar:

Steve:  What would be the best?  Get it into AWIPS in general

Kevin:  Not a pleasant thought thinking about not using the products.  MESH, 30 and 50dBZ hgt > 0C and -20C,  Reflectivity at 0, -20 C.  Kevin doesn’t look at rotation tracks as much as others in the office.  Though they use it for post-mortem.

The MESH, rotation tracks were used to track motion.  Kevin noticed how big the polygons  are compared to actual tracks.

Chris:  MESH and reports seem to coincide. Rotation tracks showed the strongest tracks were colocated with tornadoes.

John:  MESH and rotation tracks were useful to call in and verify reports.

Merging LMA with multi-radar data?

General comments:

Steve liked the jobsheets for WDSSII.  Should be done on day 1.

Need better AWIPS localization to bring up map products on 4-panels without procedures.

Intro seminars – Good, no death by powerpoint by death.

AWIPS introduction was an added bonus.

Give a chance for forecasters to customize. They could bring their own procedures.  Could use the ‘alter functions’ to change model type or radar ID.

International visitors could benefit from an hour or two of software spinup.

Get SVS capability.

Additional “lost” notes found in an archived draft never published until now:

LMA considerations:  Don’t know what VLMA intensity to consider in warning issuance.  Screen real estate issues.  Would like the source points.  Swears that supercell ID can be done with VLMA and 0.5 deg radar data.  From an Canadian pt of view, if a radar goes out there’s no extra data.  VLMA very useful to see LTG frequency going up just before meso increased north Norman.  MESH would increase after the LTG would peak.  VLMA would indicate splits about to occur.  Might give more confidence about which updraft might be more dominant.  Reflectivity may be more quick to develop but there are lot teaser cores whereas VLMA gives larger view.  One minute update in VLMA really helpful to get the warning out more quickly.

PAR considerations:  So much to see and tremendous detail.  They spent the whole night looking at base data.  Can animate cross section to see the cores going up and then making the plunge.  Were able to change the PRF and see changes almost instantly. Scanning strategies were pumping data so fast that they were not finished with looking at upper tilts by the time new low tilts came in.  Super res in high tilts revealed stuff not seen before.

CASA:  3dvar was very useful showing a meso in all physical dimensions.  Could see the meso forming on the forward flank of the storm.  WFO came in to see the CASA display of the mesocyclone wrap up.  Could see vortex holes and multiple velocity couplets.  Adaptive scanning was easy.  Looked at individual CASA radars but composite CASA was used most often.  3dVAR does have a 10min latency so it was used as confirming evidence.   Long range concern about how many people are needed to monitor a CWA full of CASA radars.  How to display multiple base velocity fields?  3dvar is one way, shear and divergence products are another.  Composite vs. single radar in CASA.  Single radar showed much more pronounced hook but then there’s attenuation issues that composite helps overcome.

No EMs called last night concerning CASA.

Need procedures.  Or better, need to load specific maps even without procedures. Everything was geared to issuing warning earlier.

Jim LaDue (EWP Weekly Coordinator, 11-15 May 2009)

Tags: None

Live Blog – 13 May 2009 (all live entries concatenated)

Southeastward moving cold front and extreme CAPE with marginal supercell deep layer shear will allow for central OK EWP activities to commence.

Convective initiated near 2230 z near Fairview to Deer Creek.  V2 crew is near Fairview.

We’ve got three projects to run:  LMA and PAR to begin then as convection approaches the CASA network, we’ll go to PAR and CASA.

2315z:  PAR showing very fine TBSS near Okeene, mainly elevated core.  MESH is 1.25″

2330z:  Big core dump observed to fall in cross-section from PAR near eastern Major County.

2341z:  LMA showing big ramp-up in LTG on segment in northern Blaine county.

2349z: Strong LL rotation on Kay county border.

2350z:  video of big funnel embedded in meso in Kay county storm.  Likely tornado.  PAR shows evolution nicely.

2351z:  Fay, THomas storm showed sizeable increase in LTG in LMA.

0001z:  Garfield county storm looks imminent tornadic on PAR and KVNX.

0009z:  PAR sector moved to southwest end of storms.

0017z:  Billings circulation increasing.  Pam suggests going to supercell VCP on PAR.  Anchor storm near Thomas is getting circulation.  V2 is on it but a bit too far northeast.

0021z:  Billings circulations, 2 of them, tighter one southwest of Billings.  LMA catching recycling over Billings.

0023z:  PAR team will now issue TORs, LMA team will issue SVRs.

0026z:  DOWs just saw shear get down to the ground on anchor storm west of Geary.

0031z:  Circulation driven by strong RFD near Billings with circulation visible in lowering.   Watonga storm (Geary storm) filled in with precip and new storms forming on its southwest side.

0046z:  Moving PAR sector 10 deg to the south to catch anchor storm crossing I-40 west of Hinton.  In NOble county LMA VLMA increased before MESH increased.  Increased confidence in severe warning.

0055z:  Possible LTG hole in VLMA in Blaine county storm.  It’s colocated with meso and BWER.

0105z:  VLMA is highest of the day for Canadian county with evidence of a lightning hole near the elevated meso.

0112z:  PAR noted rear inflow notch onset 0110z.  POssible new product idea for LMA:  LMA level -20C product to match radar layer reflectivity at -20, -10, 0 C.

0157z:  Look for storm top divergence on the PAR.  It was up to 240kts over the last 20 min from KTLX over Guthrie.

0201z:  Mode of southwestern storm is changing, beginning to bow more to the southeast with new cells growing to the east.

0213z:  CASA fully engaged in southwestern storm complex.  They’re seeing circulations not seen before on 88D.

0220z:  CASA showing circulation via velocity and rotating rain bands going around the notch near Gracemont.

0223z:  CASA showing reflectivity hole near circulation in Gracemont.

0232z:  CASA showing multi-vortices just south of Gracemont both in reflectivity holes and velocity centers.  PAR showing northern storm backbuilding south on I-35 into Edmund.  Transient TVSs observed.  They’re lasting around 10 min and we’re getting 8 or so volume scans to sample them.

0249z:  CASA showing weakening circulatoin.  BTW, 3DVAR showed circulation at least 1km wide south of Gracemont.  New intense push of outflow north of KGYR may result in new LLmeso.  Meanwhile northern storm is backbuilding over the city.

0253z:  VLMA showing a burst over OKC in last 5 min.

0256z:  OUN chat sais circulation SE of Anadarko but PAR showing strengthening.  CASA Chickasha radar showing precip wrapping around center.

0309z:  TOR warning for us.  Hook echo on PAR near OKC airport with convergence along the RFD but no vortex yet.

0409z:  TOR warned storm for Cleveland county showed small circulations forming on leading RFD edge from Stanley Draper to the north arm of Lake T-bird.  Now the storm is dying as new convection forms under the anvil of the western activity and to our south.

Jim LaDue (EWP Weekly Coordinator, 11 – 15 May 2009)

Tags: None

Live Blog – 12 May 2009 (6:28 pm)

23:00 UTC briefing:

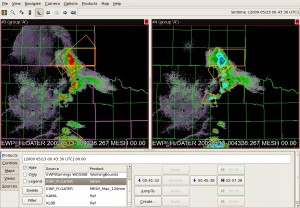
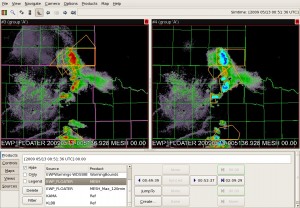
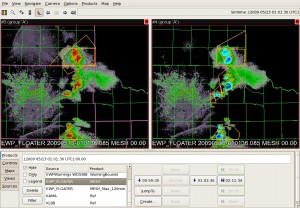
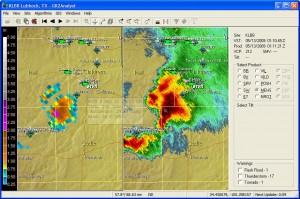
A shortwave trough has come out of southern NM and began to initiate convection as it became juxtaposed over the low-level dryline west of Lubbock, TX.  Initial high-based convection has generated a small but forward propagating cold pool northwest of Lubbock while an enhanced HCR has initiated more discrete, outflow starved and high-based convection from Floydada to south of Silverton.  See image below.

Note that the field here has not only numerous spotters with live video feeds but the VORTEX2 project has targeted this area.

Forecasters will be using multi-sensor products including Z, Z>-20C level, gridded hail, Azimuthal shear, and more.

Forecasters are:

Chris Wielke, EC Edmonton,
Steve Hodanish, NWS PUB
John Billet, NWS AKQ
Kevin Brown, NWS OUN

2330z:  Steve and Kevin will localize to AMA, John and Chris will take LBB’s CWA.

2350z:  John and Chris are seeing MEHS values to 1.2″ for the storm near Turkey.  It’s within the county where the backed winds and near 70 F dewpoints begin.  But the storm is in a small multicell cluster with potential for outflow dominance.  Storm shows only 3kft of 50dBZ above -20C.   Meanwhile Kevin and Steve are limited by the RPS list of only lowest 2 tilts.

0002z:  Both teams drafting respective SVR warnings.  One for the forward propagating storm in Armstrong county based on report as they’ve had issues with products.  MEHS was <1″ but there was an inch hail report.  They’re looking at MEHS and height of 50dBZ > -20 level.  The other one for the multicell event in Hall county.  They based their warnings on the MEHS, all-tilts and height of 50dBZ>-20 C level.

0010z:  Steve and Kevin issued a new warning for Donley and Collingsworth. MEHS and MEHS track for motion.

0011z:  John and Chris issued a new warning for northern Hall and far NE Briscoe counties.  New cell to the northwest based on the core peaking in the MEHS algorithm.

0024z:  John and Chris are looking at a new left mover approaching the southern LBB CWA from MAF.  No warning yet.

0029z:  Both teams drafting warnings for the line bridging both CWAs from Donley to Hall counties.

0039z:  Severe warning issued for Collingsworth county issued by Steve and Kevin for 70mph and tennisballs.  MEHS and 50dBZ height above -20C.

0042z:  Chris and John issuing SVR for Stonewall and SW Kent counties for that left mover coming out of MAFs.  MARC signature aloft, MEHS, and weak rotation.

0045z:  Chris and John impressed by the 50dBZ height 4kft > -20C.

0051z:  Steve says the Donley county storm is going downhill based on looking at FSI X-sections.

0100z:  Chris and John just issued a warning for Motley county minutes before a report came in.

0110z:  Storm acquiring supercell characteristics in northern Cottle county. GRLEVELx MEHS shows 3.2″ while gridded MEHS shows 1.88″.

0017z:  Chris and John issued a SVR

end of period discussion:

What to think of new products?  Took some time to get used to products in order to start warnings.  What value to use in shear?  Nobody knows.  Useful for pulse storms? Yes, it’s nice to isolate the bigger storms when there are many.  What’s popped up at 50dBZ above -20C level?

Nobody looked at biased MEHS.

Technology-wise, it would be nice to have two screens.  Could have NSE data on one screen.  Also add the WDSS signature into the templates.

Jim LaDue (EWP Weekly Coordinator, 11 – 15 May 2009)

Tags: None

Outlook – 11 May 2009

For week 3, the participants are Steve Hodanish NWS PUB, Chris Wielke EC Edmonton, Kevin Brown NWS OUN, and John Billet NWS AKQ.

This is orientaton day.  The IOP begins at 5:30 pm Four projects are on tap for week 3 of the 2009 EWP.

Stabilized air over OK in the wake of last night’s MCS precludes the possibility of convection over TX .  Overnight, lee troughing in the high plains will help lift the front in central TX northward toward the Red River Valley.  An intensifying LLJ interacting with the front could create another MCS over OK after the planned IOP closes.  No IOP is likely for CASA, PAR or the OK LMA region.

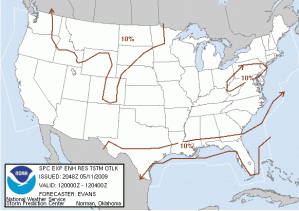
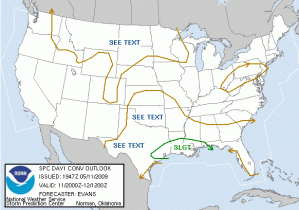
Of the HSV and IAD LMA regions, only the IAD region has the potential for convection.  A weak midtropospheric shortwave trough is expected to cross the IAD region accompanied by weak instability and marginally strong enough convection to product lightning.  However the possibility for severe weather events is too low to consider an LMA IOP there.  The following graphics show the SPC general thunder risk (left, top) and the day 1 outlook (right, bottom).

The four EWP participants will go through a CASA and a PAR case.

Jim LaDue (EWP Weekly Coordinator, 11 – 15 May 2009)

Tags: None

Forecaster Thoughts – Scott Rudlosky (2009 Week 2)

My participation in the EWP spring experiment was from a somewhat different perspective than most of the other evaluators, observers, and participants. Currently, I am a doctoral student at Florida State University studying CG and IC lightning. We make extensive use of the WDSS software, and I certainly advocate the multi-sensor, multi-radar approach that has been transferred to operations within WDSS. My current research seeks to quantify IC and CG patterns for comparison with these multi-sensor parameters in order to better diagnose storm severity. Therefore, I was extremely eager to observe the operational application of these products, and also how they may be improved.

The HWT-EWP is an ideal forum for forecasters and researchers to share insights. It provides forecasters with the opportunity to share insights into the development of the next generation of operational tools and allows researchers to more clearly define the forecaster’s needs. The following paragraphs detail some general comments and impressions.

The forecasters seemed reluctant to move away from their more familiar base products during severe weather analysis. This leads to one of the more significant points mentioned during our Day 5 debrief. The products that we create must be nearly bug free before the forecasters use them, because first impressions are very important and the tools may not receive a second look if they are not perceived as user friendly or helpful. This highlights the importance of residence training for these newly developed products.

I found the storm trends displayed in Google earth very helpful in diagnosing the state of a given storm; however, the comment arose several times that these trends seemed to originate from a “black box”. I suggest that the forecasters be introduced to the storm clustering techniques and/or that the clusters themselves are visually depicted alongside the trends during future experiments.

The CASA and PAR arrays had the advantage of extremely fine temporal resolution. The rapid updates increased the confidence of our warnings by allowing a more complete understanding of storm morphology. Although the ~ 1-min resolution was helpful, it also introduced a problem. Specifically, it was difficult to fully exploit the rapid updates when multiple storms were likely to require warnings. This is alleviated somewhat with two forecasters, but it raises the question of the frequency at which radar updates become less advantageous.

The only total lightning product that we evaluated during week 2 was a column density of LMA sources (i.e., vertically integrated LMA). The main question that I heard was how this product differed from composite reflectivity. My knowledge of total lightning and its relation to storm severity allowed me to make some use of this product, but the forecasters did not seem to find it very helpful. I suggest that additional products be created that allow forecasters to evaluate total lightning trends in both space and time. In addition to the trends that were displayed in Google earth (i.e., during the weeks with real-time cases in the LMA domains), this also could be achieved by including spatial plots displaying VILMA changes in time (i.e., 5 or 10 min differences/trends).

This opportunity was invaluable to my current and future research. I cannot say that I fully grasp the difficulty in “Crossing the Valley of Death”, but I now have a much clearer understanding of the difficulty involved in the transfer of academic research to operational applications. I appreciated the opportunity greatly and will do my best to incorporate all that I learned into my ongoing research. Please feel free to contact me directly (srudlosky@fsu.edu) if you have any questions in regards to my HWT-EWP experience or my current research.

Scott Rudlosky (Florida State University – 2009 Week 2 Evaluator)

Tags: None

Forecaster Thoughts – Tom Ainsworth (2009 Week 2)

Overview:

During the week of May 4-8, I had the privilege of visiting for the first time the National Weather Center (NWC) in Norman, OK. The purpose of my trip was to participate as an evaluator in NWC’s Hazardous Weather Test Bed 2009 spring “Experimental Warning Program” (EWP). EWP is designed to “test and evaluate new applications, techniques, and products to support WFO severe convective weather warning operations.” While Alaska, and especially Juneau, may not be known for severe convective weather, the opportunity to participate in EWP was valuable in several ways. First, I was able to evaluate emerging weather forecasting techniques and technologies that may have potential application in our data-sparse region. Second, I was able to network with a variety of people from around the nation working in both academia and government. Ensuing discussions covered ongoing field activities in different NWS regions and led to thoughtful brainstorming about future NWS services. And third, I accepted the offer to deliver a brown bag seminar on the last day of class. My brief talk was designed to raise awareness about science-service issues in Alaska. I concluded the talk by offering a friendly challenge to EWP to develop “new applications, techniques, and products” for Alaska Region WFOs which rely less on radar and more on other types of remote sensing.

1. Evaluating Emerging Technologies:

This year’s EWP focused on evaluating four potential WFO applications: 1) multi-radar/multi-sensor gridded severe weather algorithm products; 2) three-dimensional Lightning Mapping Arrays; 3) CASA (Center for Collaborative Adaptive Sensing of the Atmosphere) low power/short range radars; and 4) the Phased-Array Radar (PAR) operating in Norman.

The multi-radar/multi-sensor gridded algorithm products were made available via the Warning Decision Support System – Integrated Information (WDSS-II) developed at the National Severe Storms Laboratory (NSSL). Data from multiple radars and three-dimensional numerical model (RUC) temperature analysis grids produce more vertical volume samples than a single 88D can alone. Refresh rates are as quick as one to two minutes. Overlapping coverage fills gaps from terrain blocking. There are three WDSS-II domains across the south and mid-Atlantic states and a fourth “floater” domain that can be moved to an area expecting severe weather. Among the grids produced are echo tops above selected dBZ reflectivity cores or certain temperatures, lightning density, azimuthal shear, rotation tracks of the highest observed cyclonic shear, Maximum Expected Size of Hail, and vertically integrated Lightning Mapping Arrays (LMA) detecting source points of total lightning in 3D.

LMAs detect VHF radiation emitted as lightning propagates. Unlike the existing National Lightning Detection Network (and Canadian Network utilized in SE Alaska), LMAs detect both in-cloud and cloud-to-ground lightning. Emerging research is identifying a link between increased lighting activity, intensifying storms, and severe microbursts. Each of these parameters is plotted over a Google Earth background and trends of each parameter can be tracked for individual thunderstorm clusters using a multi-scale graph display.

CASA radar output can reveal storm structure, especially in the lower atmosphere, with much higher spatial and temporal resolution than the 88D, especially if the CASA radar is situated at a distance from the 88D. In fact, the rapid update cycle (~60 seconds) and short CASA radar range (~40 km) was difficult at first to get used to. PAR data sets have the range of the 88D and the higher resolution of CASA technologies. PAR is “electronically steered” S-Band radar that provides “targeted” scanning within a 90-degree azimuth sector. Its storm scanning strategy is significantly faster than the 88D which greatly enhances the operator’s situational awareness of storm trends. The PAR may one day replace the aging 88D network.

In summary, participating in the EWP was easily the most intensive, hands-on exposure to new radar technologies I have had since I attended the 88D Operations Training in Norman 15 years ago. All of the tools and applications I tested have significant potential for improving very short term forecast decision making. Assessing each application is literally the stuff of PhD dissertations. Unfortunately for Alaska WFOs, applicability of most of these technologies in the foreseeable future will be negated by the lack of requisite archive Level 2 data, no over-lapping radar coverage areas, the sparsity of conventional surface based data sets and the resultant impact on RUC-II model analysis. EWP facilitators requested field offices submit case studies and Level 2 archive data to which the tools can be applied. Unfortunately, the FAA does not maintain Level 2 data from any of the Alaska 88Ds. PAR and CASA radars, in my opinion, have the highest potential for use in Alaska Region.

2. Professional Networking:

It was quickly apparent to me the NWC is an important and very active facility for NOAA. It symbolizes the advantageous partnerships between university training, applied research, and NWS operations. The EWP work space was literally surrounded by the Norman Forecast Office, NSSL, and the Storm Prediction Center (SPC). During the week I was at NWC, a major tornado field research project covering the Great Plains over five weeks (VORTEX-2) was kicking off with international media attention. Precise orchestration of people and events in NWC this week – including several public tours per day – was managed by University and NOAA public affairs personnel. I was able to meet up with two OU graduate students with connections to WFO Juneau: one was hired in 2007 as a STEP; the other was hired as a SCEP this year.

My co-evaluators in EWP this week represented an equally diverse group: a Lead Forecaster from Chicago; a General Forecaster from Seattle; and a PhD candidate from Florida State University. Each person brought a different set of skills and experience to the program. Discussions during breaks and after hours generally drifted to future weather forecasting operations and trends of university research activities. I learned from conversations during the week that there are a number of different interpretations of the concept “decision support services”. DSS is a term becoming commonly associated with NWS Strategic Planning, and is a major agenda item in the National MIC/HIC Meeting later this year. My sense is field offices would benefit from having a clear and consistent definition of what NWS upper management means by DSS.

3. Brown Bag Seminar:

NWC routinely offers brown bag seminars by OU faculty and NOAA/NWS staff. Visiting scientists are also offered the opportunity to present short seminars. In the case of EWP, visiting evaluators are able to give a short presentation during the weekly de-briefing session on Friday. I agreed to speak about science and service issues in Southeast Alaska and demonstrate what makes warning decision making in our region particularly challenging. The presentation highlighted our large AOR, complex terrain, sparsity of in-situ data (including radar), and the value of high resolution satellite data to warning decision making. In closing, I requested the Hazardous Weather Test Bed (HWT) audience to consider ways they could apply their mission to develop “new applications, techniques, and products” for WFOs in Alaska Region and elsewhere that may rely less on radar and more on other types of remote sensing. In response, I learned the HWT intends to hire a student next fiscal year to begin investigating and developing warning decision applications related to satellite imagery. My presentation slides are available on the regional network (R:/) in the “Juneau” folder (HWT-NWC SEAK ScienceService 2009-05.ppt).

Summary:

I am very grateful to have had the opportunity to travel to the NWC May 4-8 and participate as an evaluator in this year’s Experimental Warning Program. The EWP cadre knew their material thoroughly, was well prepared, and interacted well with visiting evaluators. The amount of new material presented was considerable but, over time, was manageable. The NWC is a very busy place with OU faculty and students, NOAA researchers, and NWS NCEP and WFO operational staff. The interaction with these groups and fellow evaluators during the week was professionally stimulating. And even though there are serious road blocks to using the new technologies anytime soon in Alaska Region, the staff there was open to hearing objective, constructive feedback. I recommend supporting any future opportunities for Alaska Region field office personnel to visit and experience NWC.

Tom Ainsworth (NWS Juneau AK – 2009 Week 2 Evaluator)

Tags: None

Week 2 Summary: 4 – 8 May 2009

MR/MS

-Trends from MR/MS grids provide an excellent tool for the mesoanalyst and situational awareness given the capability to see the long-term trends

-Avg. trends in a sector/area to see the “average storm behavior might be helpful

-Grids of the time change fields might be helpful (i.e., the change in MESH for a storm in the past 10 minutes)

-Probability of lightning not useful with the put-get type advection; a forecast swath would be much better to see all areas which the storm might move over in the next N minutes

-Divergence fields for MARC signature

-Need to investigate how radar coverage affects MR/MS grids

-Send MR/MS grids to WTDB to help expose to more forecasters?

-Forecasters seem to have their own preferences for what levels and echos they would like to see (i.e., maybe dBZ @ -30C instead of -20C).  MR/MS set up needs to be configurable on the fly.

-Will need a salesman at each office for MR/MS.  They need to be knowlegable and experienced with MR/MS so that they can sell it to other forecasters.

CASA

-Too many panels; all the information took away from the experience with CASA data

-Idea for WG: move to tabs to help sort radar data?

-For wind study, it was suggested to get experienced forecasters (i.e., forecasters from offices who experience derechoes or main climatological threat is wind) to evaluate how useful the CASA data is for wind threat.

LMA

-More trends of the data

Overall/General Comments:

-One team member on Google Earth and one team member on AWIPS worked well

-AWIPS for canned cases

-Visiting forecaster: Can we get flexible shifts for real time events?

Kiel Ortega (EWP Weekly Coordinator, 4-8 May 2009)

Tags: None