An official website of the United States government
Here’s how you know
Official websites use .gov A
.gov website belongs to an official government
organization in the United States.
Secure .gov websites use HTTPS A
lock (
) or https:// means you’ve safely connected to
the .gov website. Share sensitive information only on official,
secure websites.
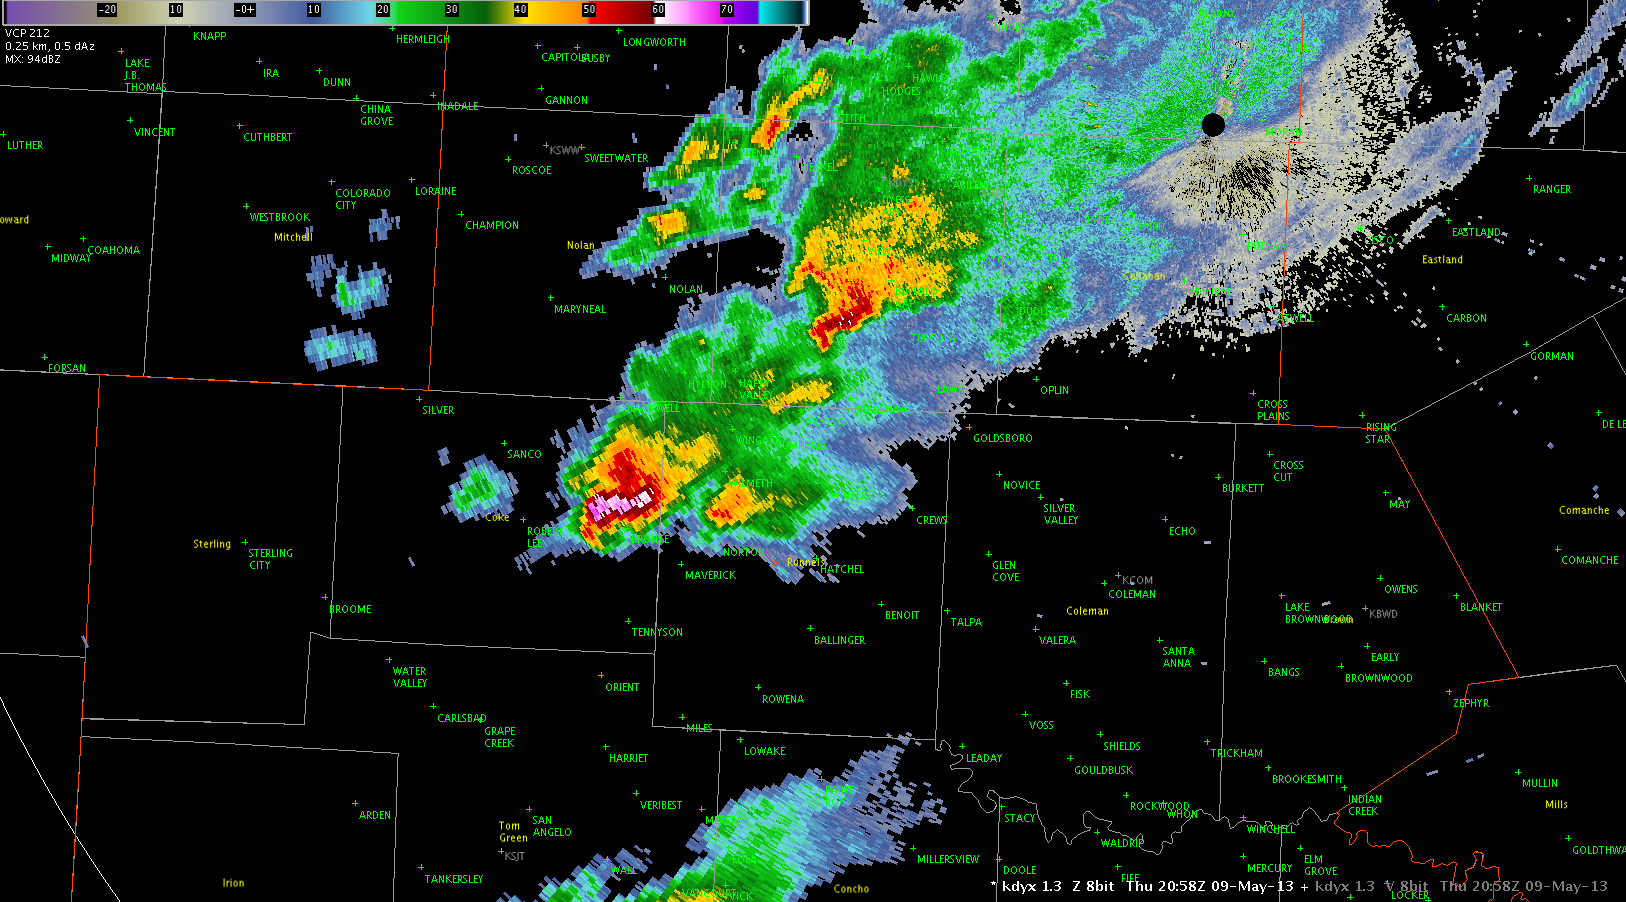
A supercell thunderstorm developed north of San Angelo TX at about 2030Z, and became severe as it moved east. After the storm made a hard right turn and began moving southeast, it grew to an extreme level of intensity, especially with regard to hail potential.
DYX radar showing an intense TBSS signature at 2137Z.
About a half hour later, t he storm continued to strengthen, now showing a TBSS with > 30 dBZ and a 70 dbZ core that extended to over 25k feet.
DYX 0.5 degree reflectivity at 2210Z, showing an intense TBSS signature.
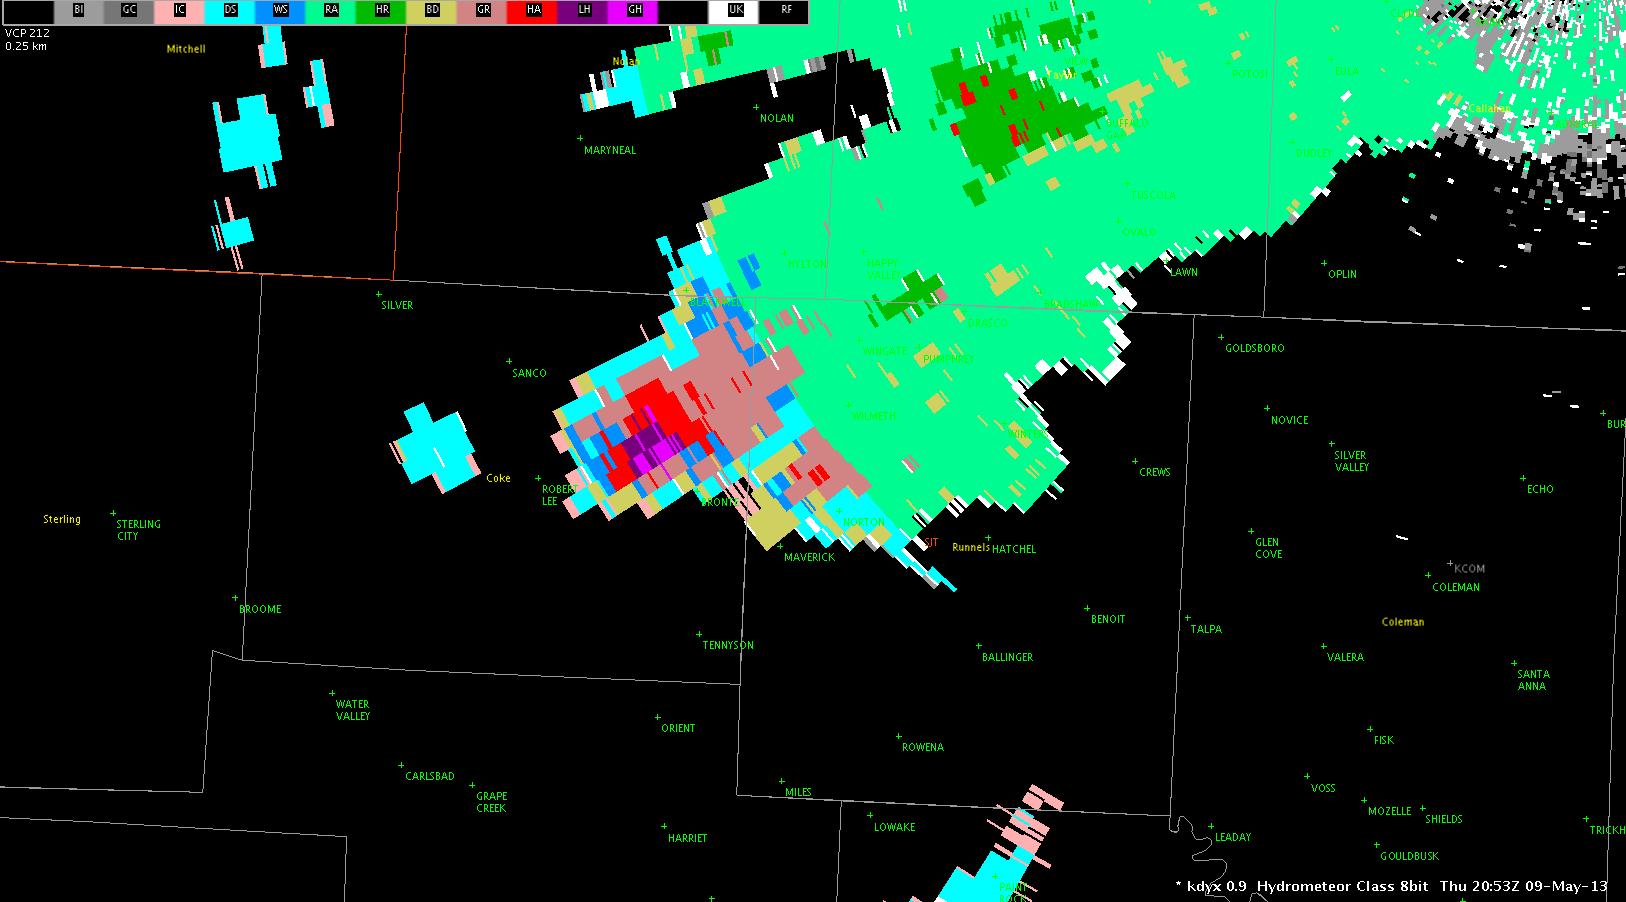
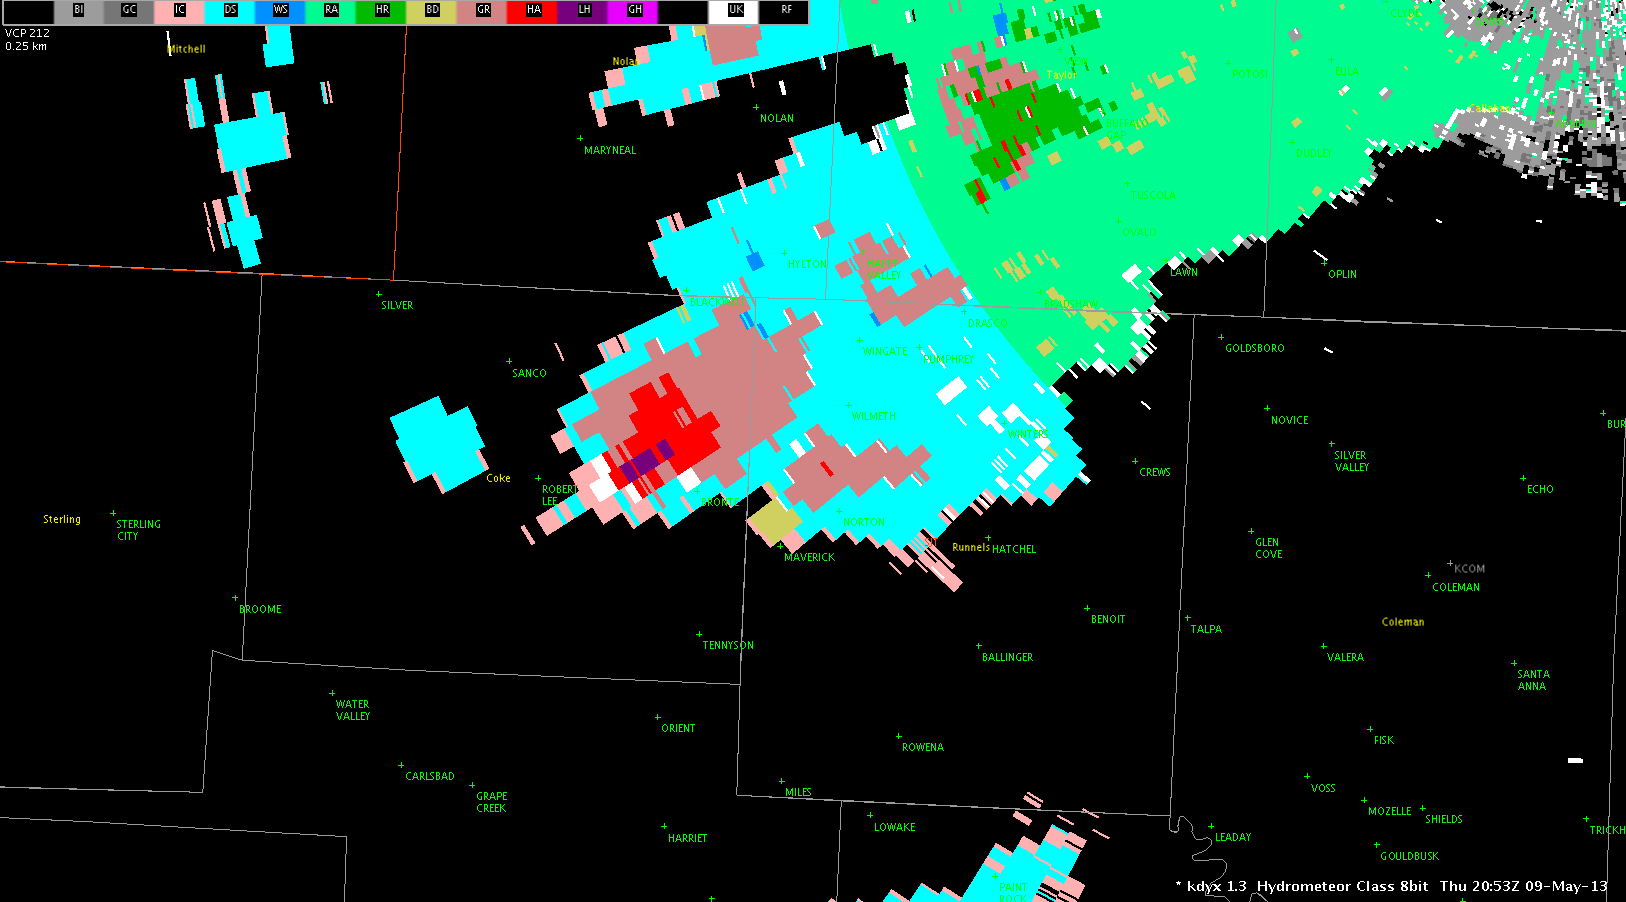
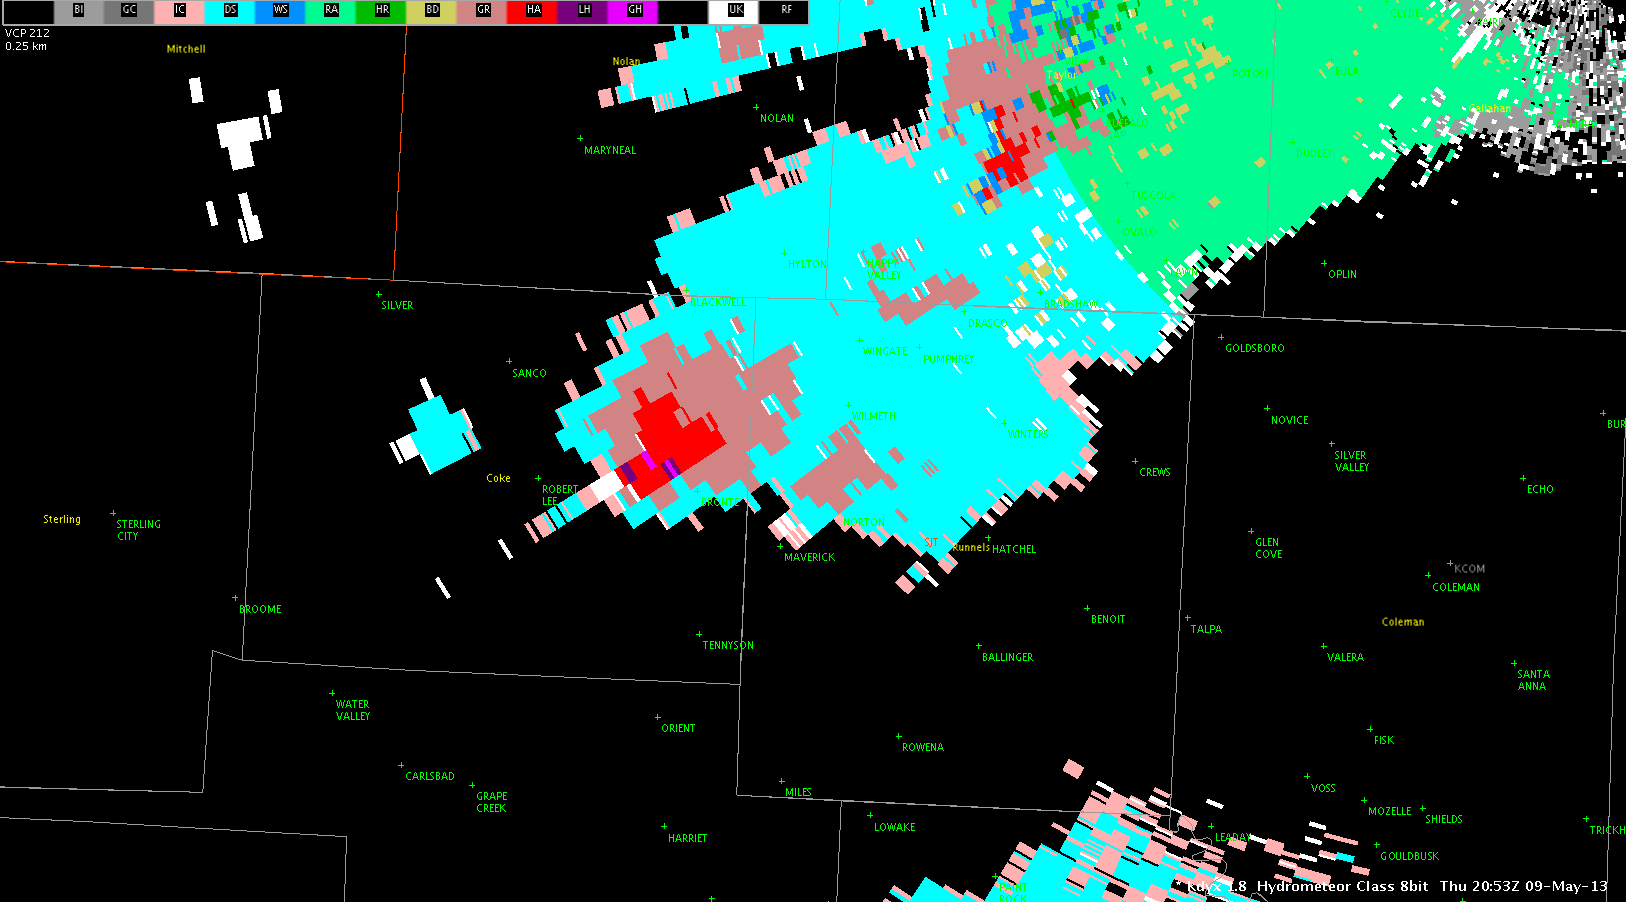
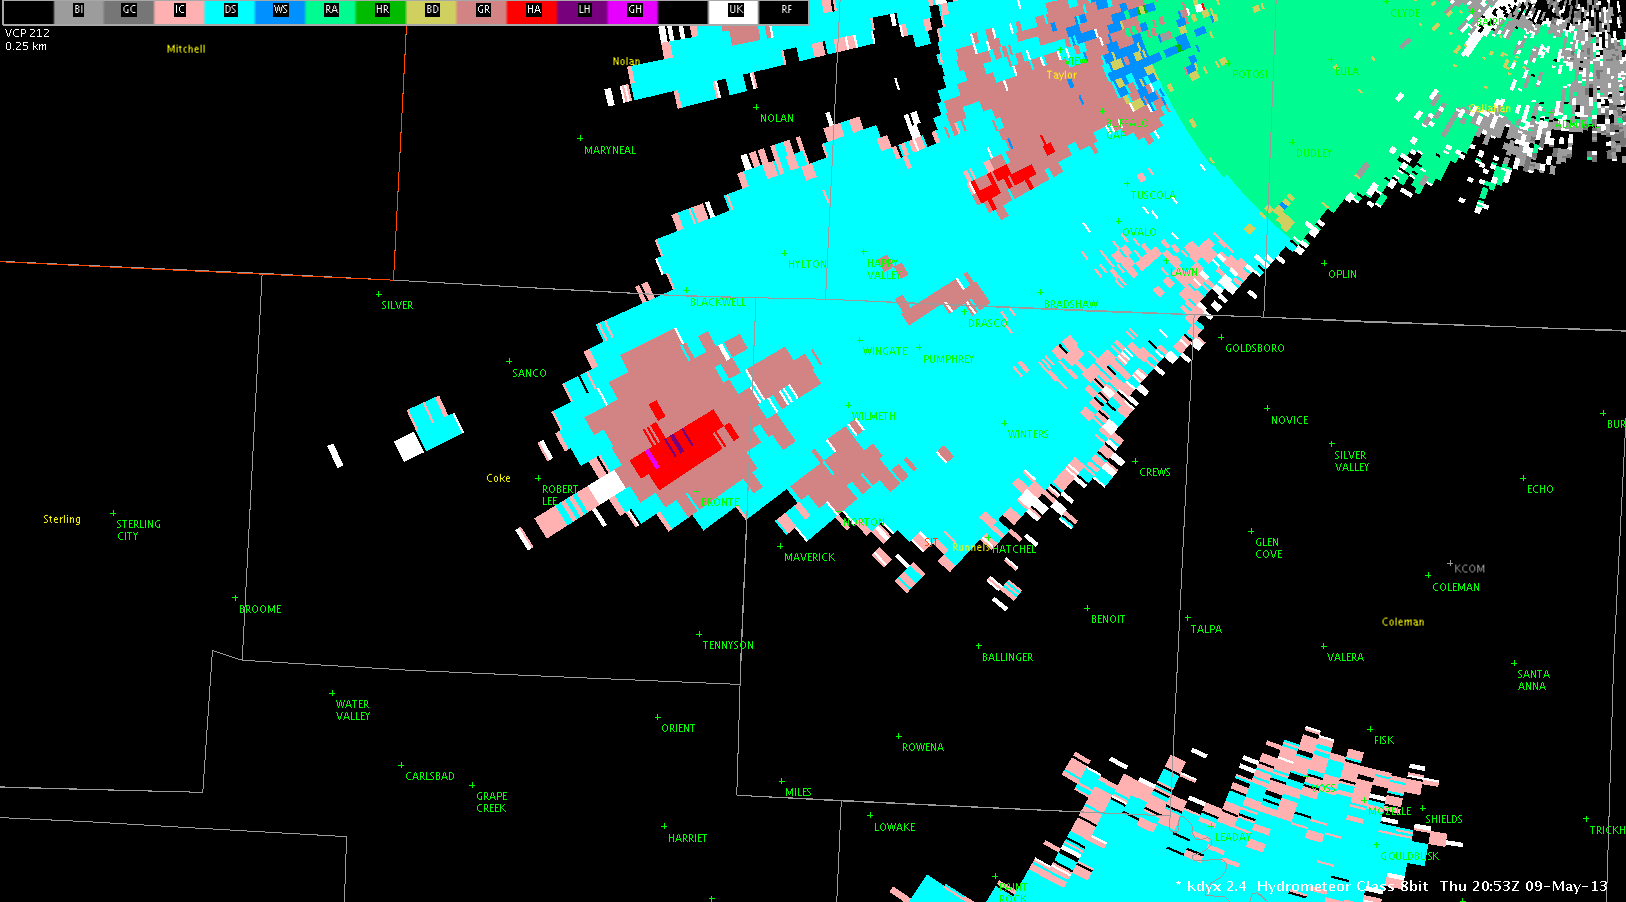
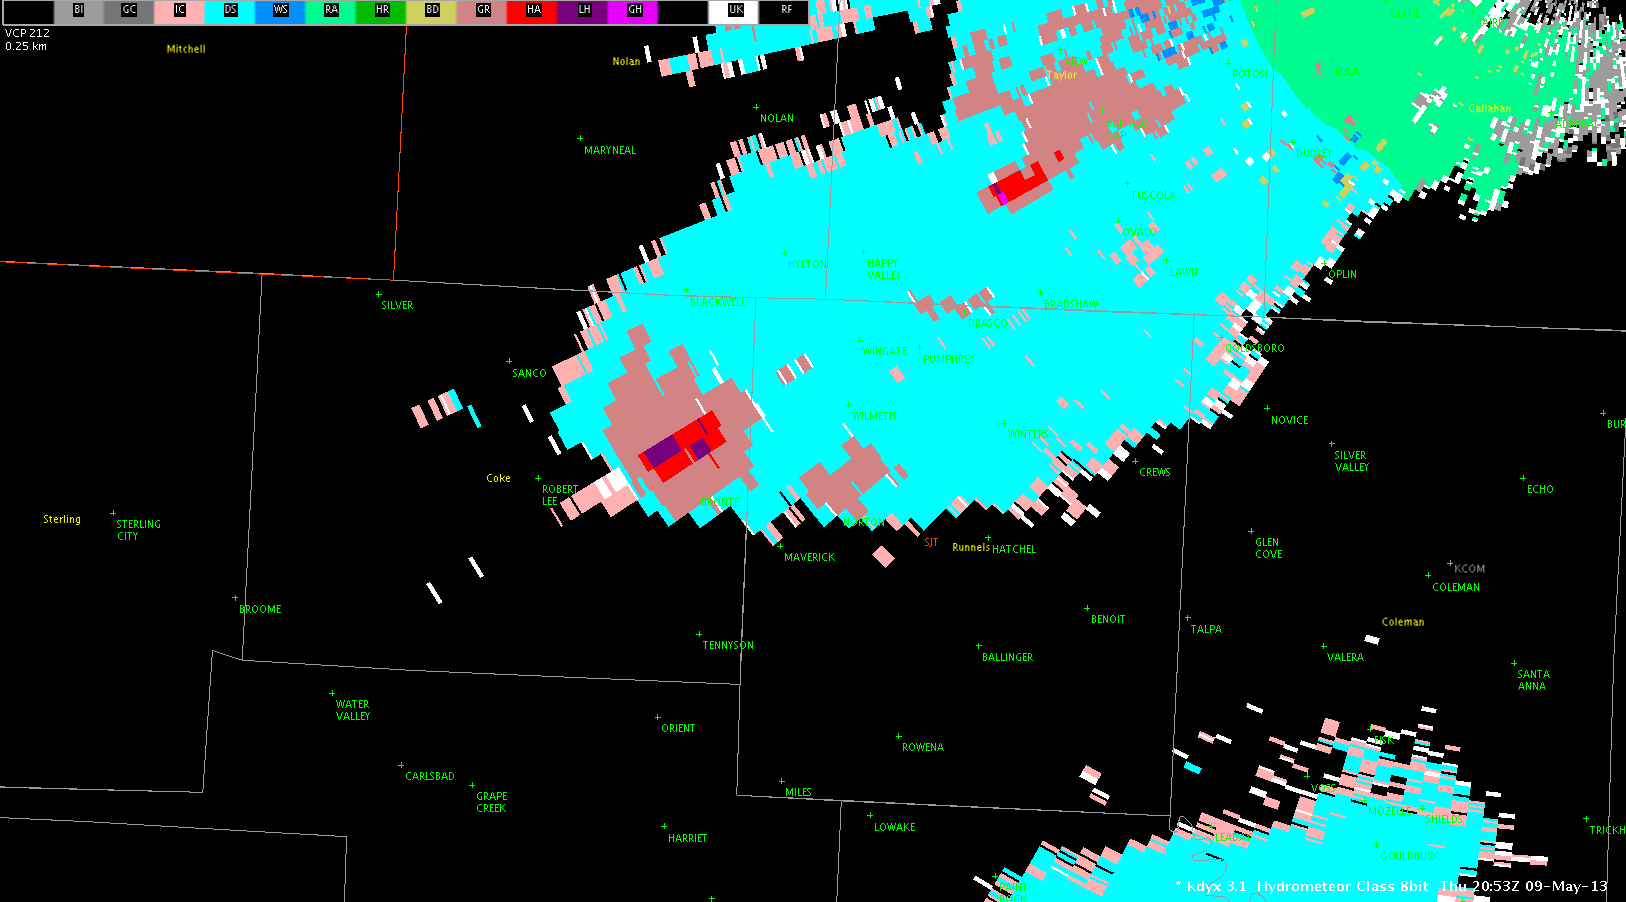
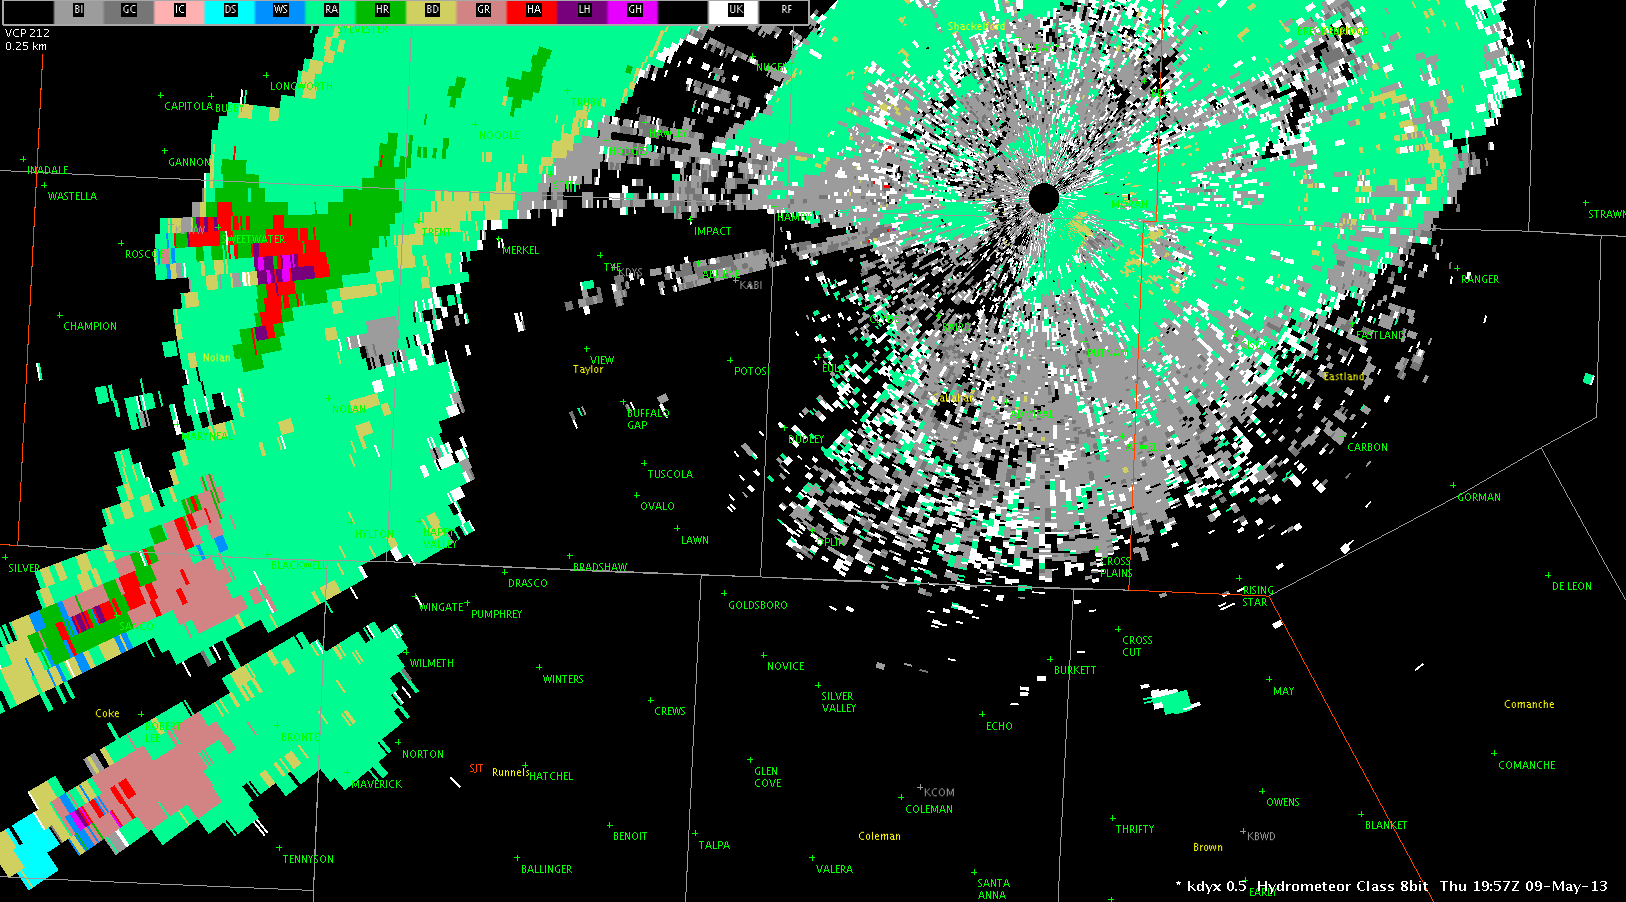
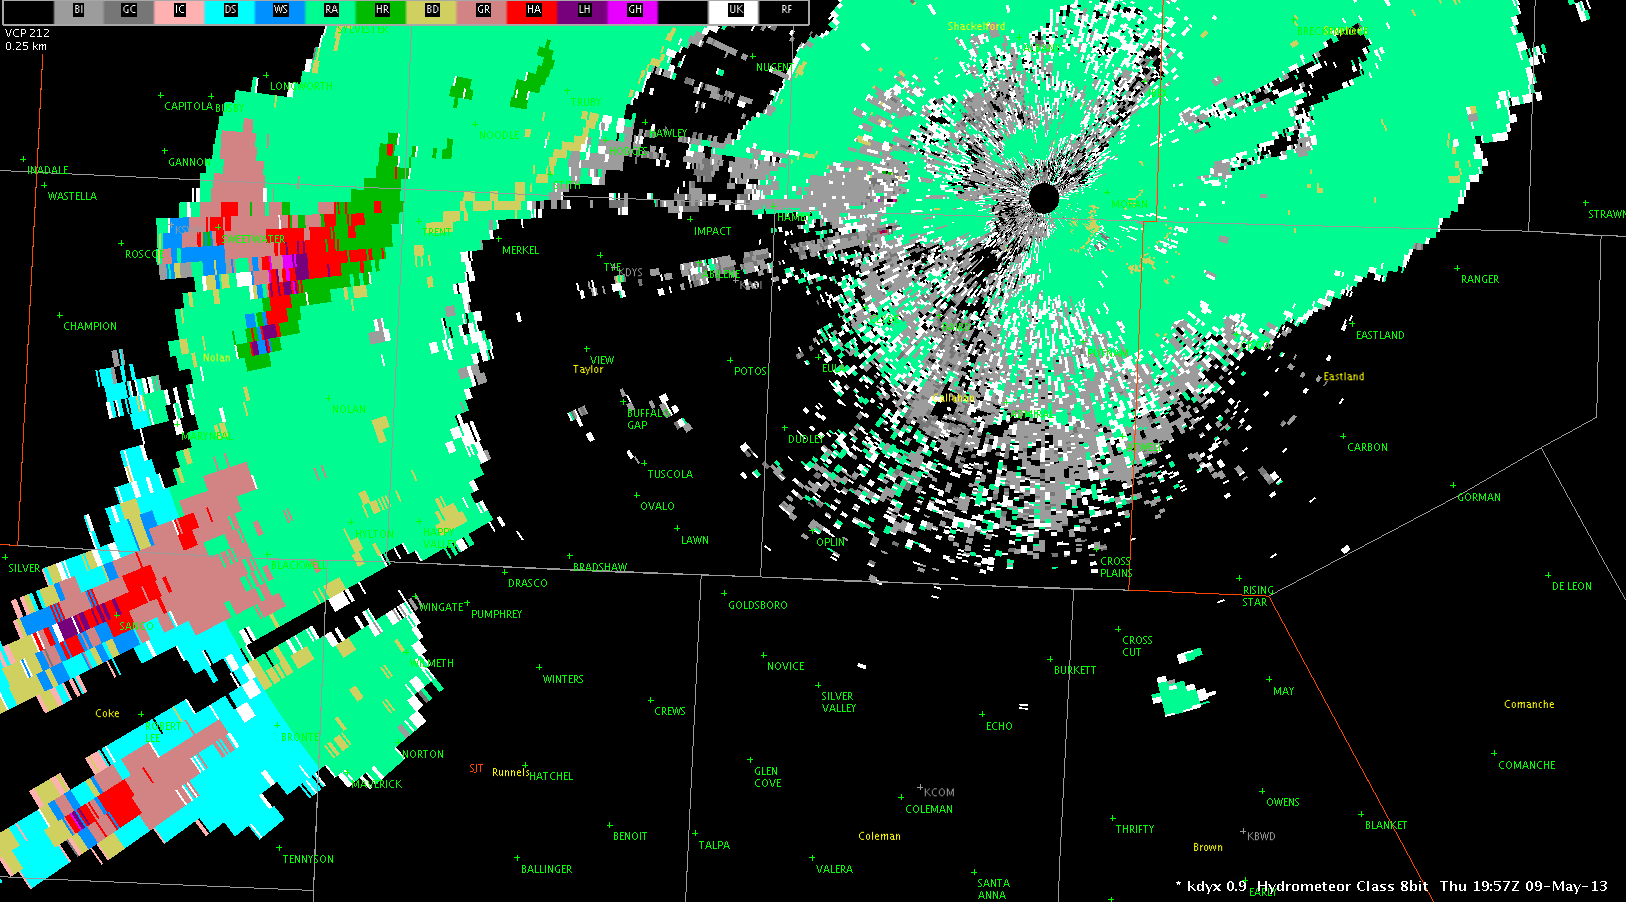
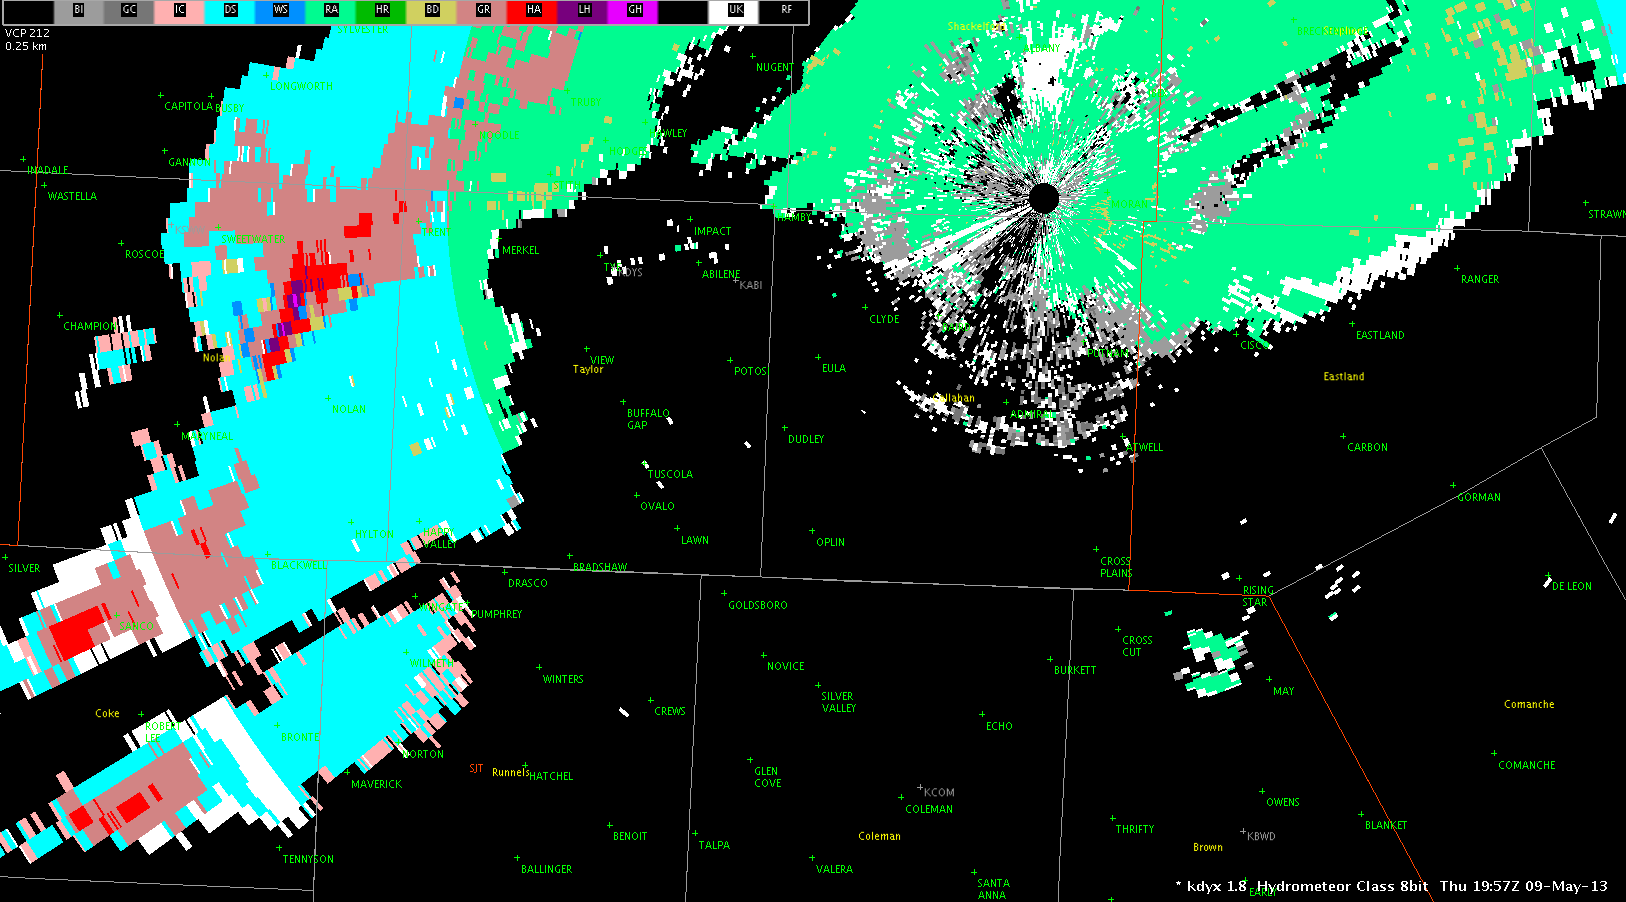
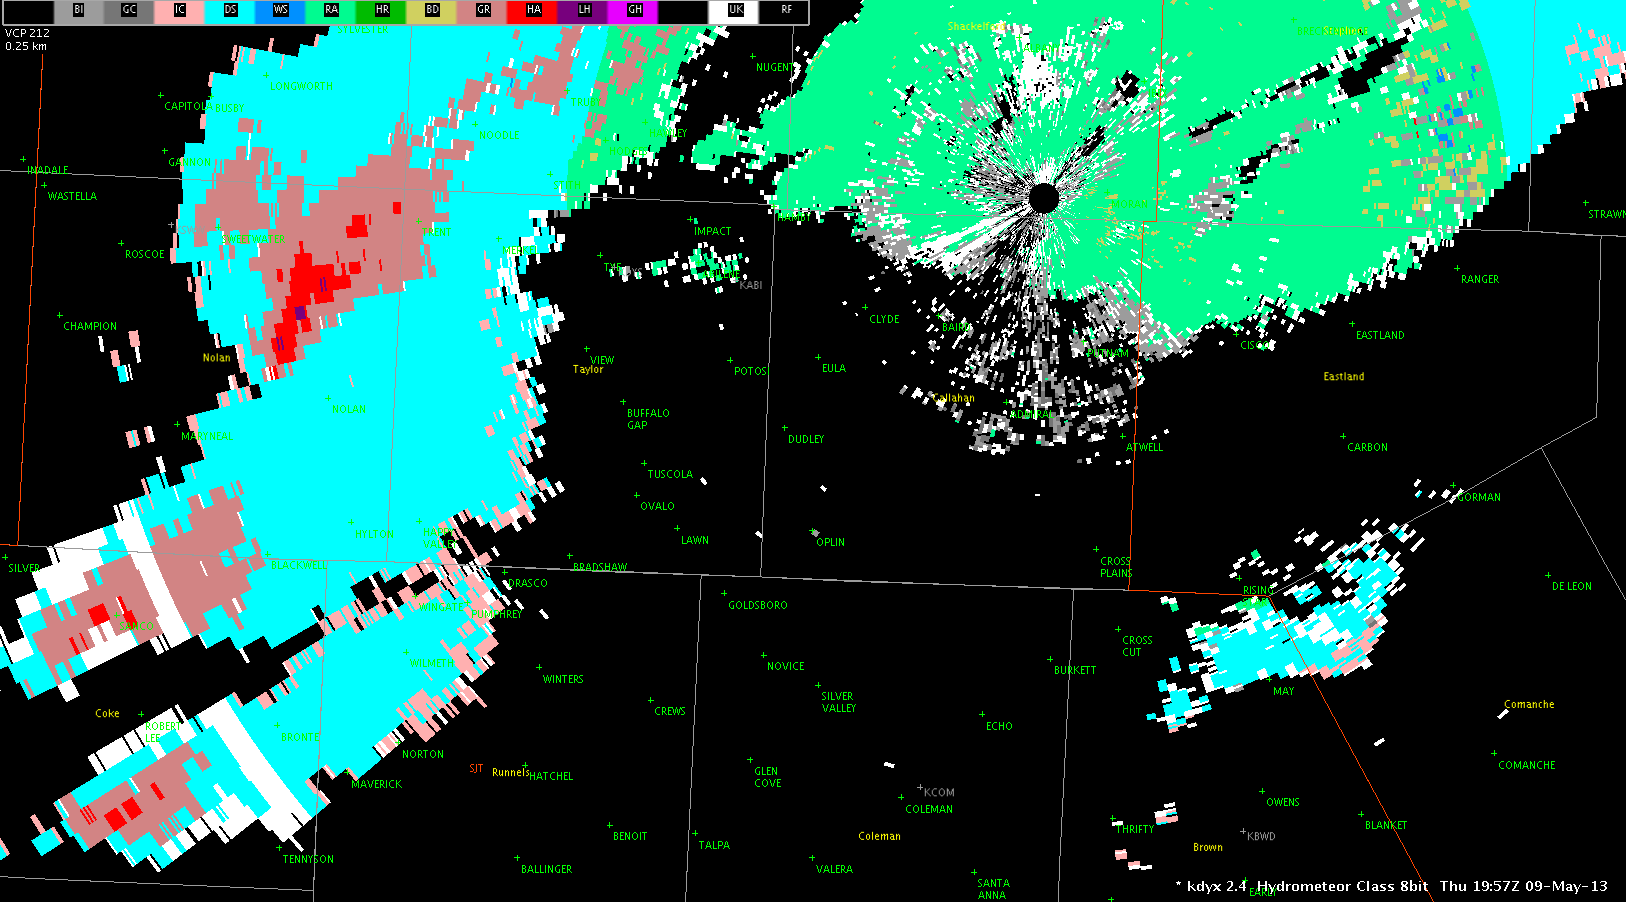
The HC product showed giant hail at numerous slices throughout this period of very high storm intensity. Here are examples from the 2210Z volume scan.
DYX HC at 0.5 degrees (2210Z).DYX HC at 1.8 degrees (2210Z).DYX HC at 4.0 degrees (2210Z).
At the time of these images, we received reports of baseball size hail, and numerous reports of golf ball size hail.
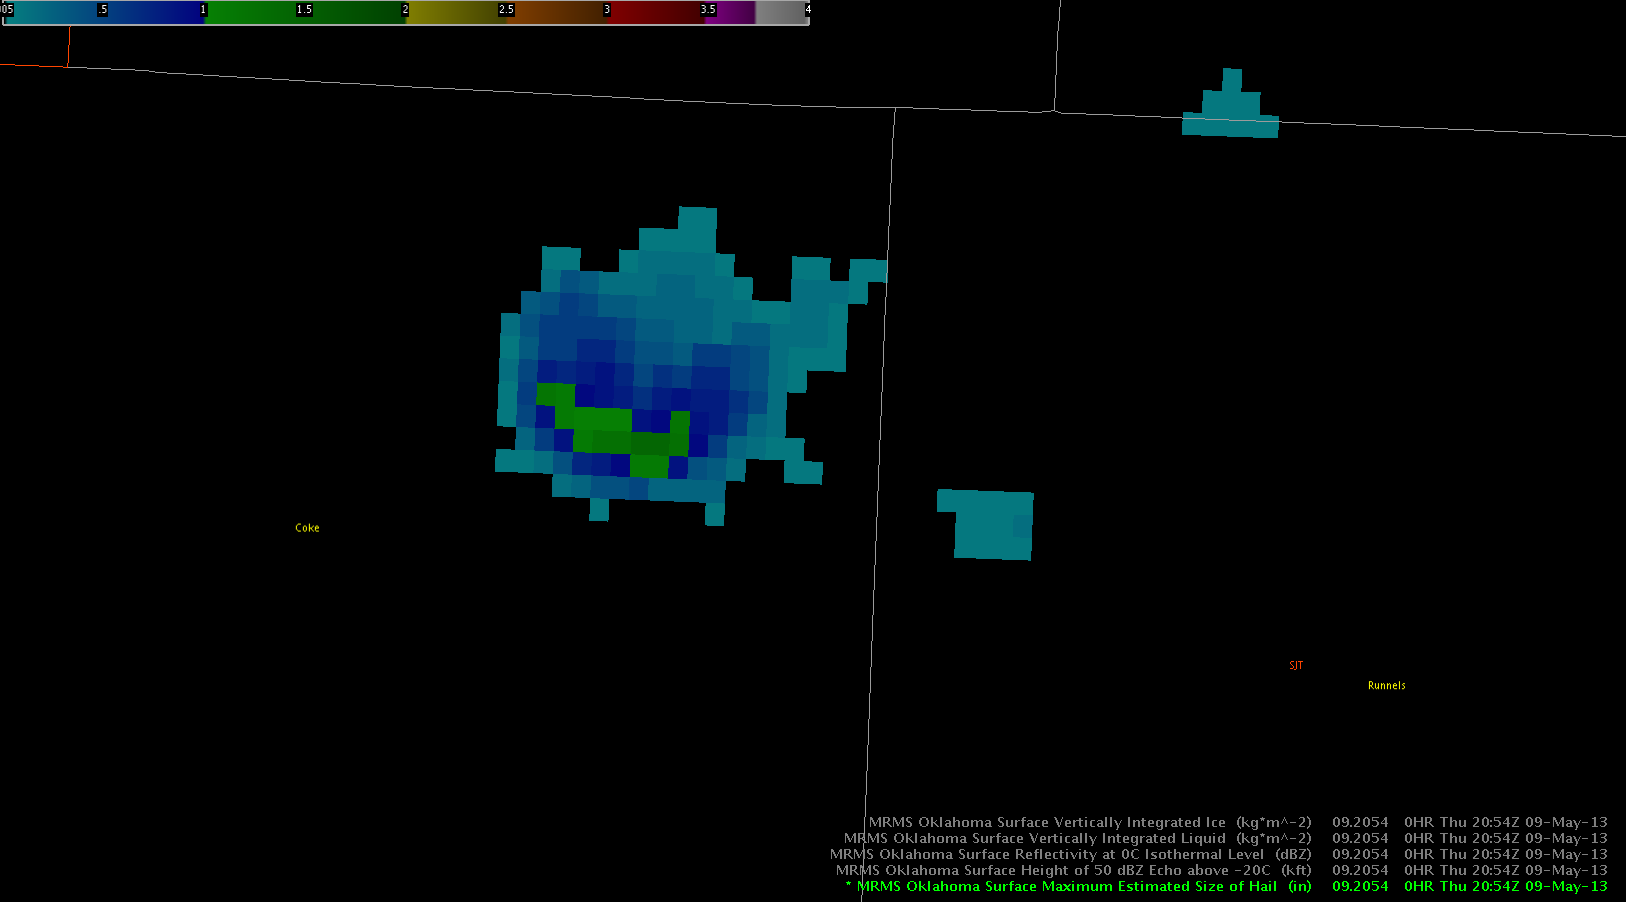
Here is a look at a plethora of MRMS products at 2210Z.
MRMS at 2210Z (part 1).
MRMS at 2210Z (part 2).
MESH showed a maximum hail size of over 2.75″ in this image (and actually peaked at over 3″ near the same time). This is in the top left of the first MRMS image.
POSH (which is directly proportional to MESH) reached values of 100% when MESH indicated about 2.5″ or greater. This is in the top left of the second MRMS image.
Reflectivity at -20 degrees C (top right in the second MRMS image) is over 70 dBZ. The 60 dBZ echo reached over 20k feet above the freezing level (bottom left in the second MRMS image). Vertically Integrated Ice (bottom right of the second MRMS image) is over 50 kg/m2, too high for the default color scale.
This data helped provide forecaster confidence in the fact that hail was extremely large in this particular supercell.
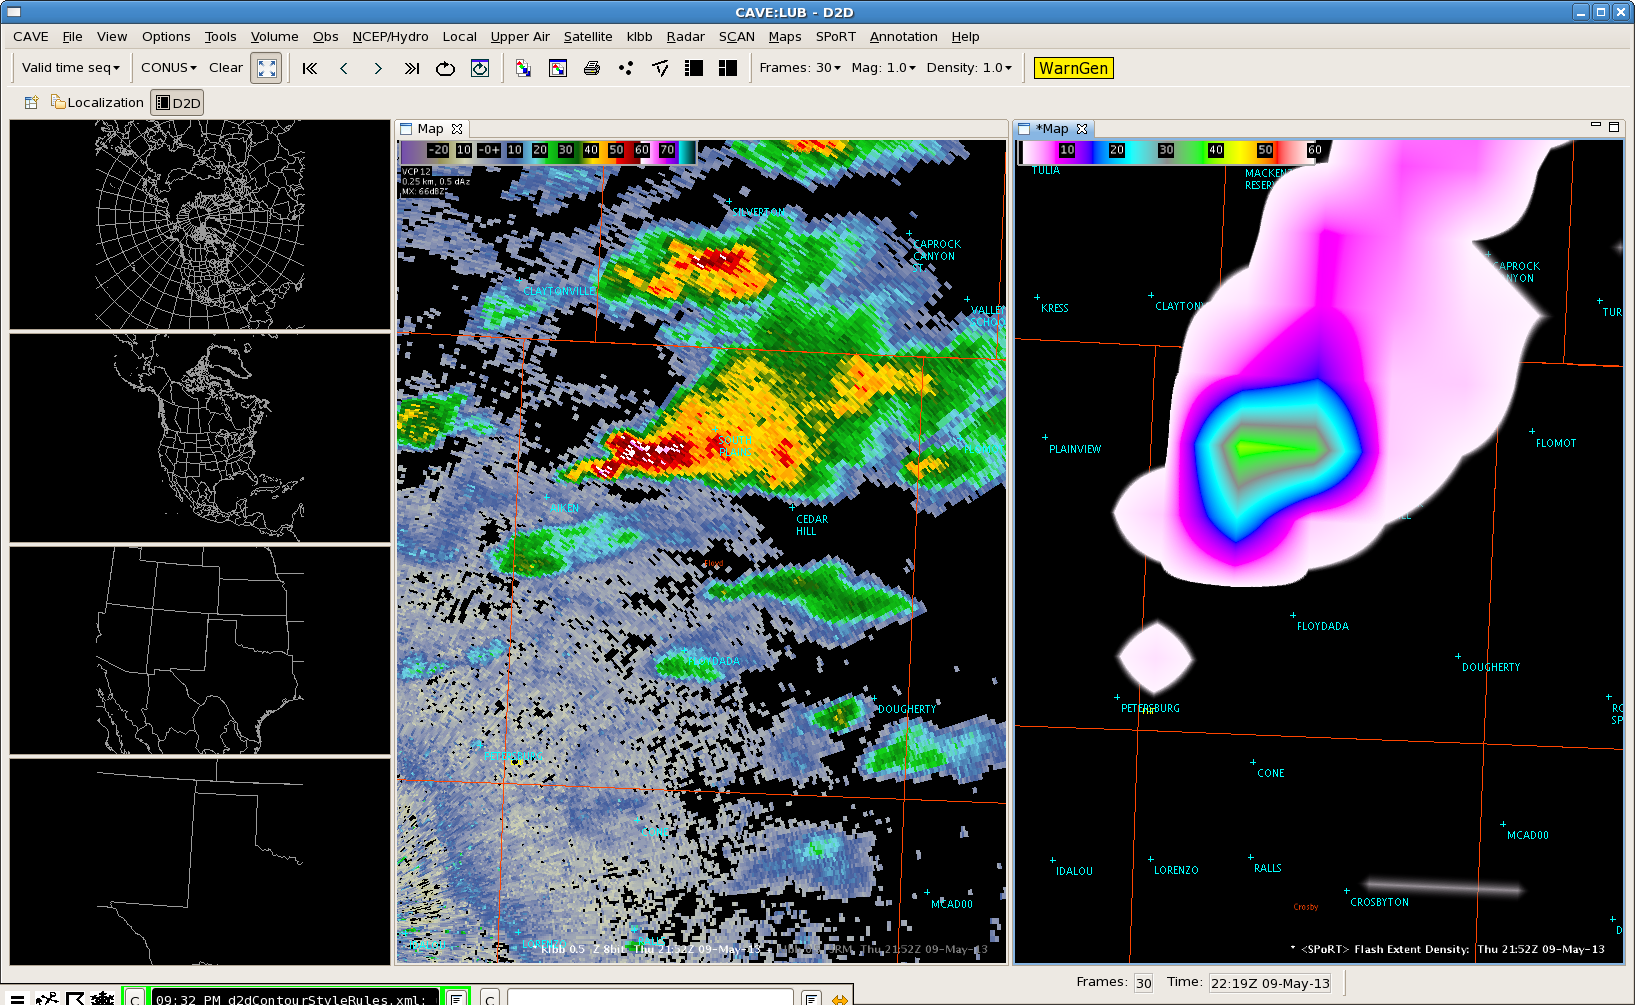
We finally had storms develop within the West Texas LMA. The strongest updraft this evening showed marked ramp up of flashes to 40 just as the storms 50 dBZ core reached 26.25 kft briefly before coming back down about 10 minutes later with the flash density also subsiding back to 15 to 25 flashes. Although the storm didn’t reach severe criteria, it was beneficial that the Flash Extent Density updates in 1 minute intervals, which lets the warning forecaster monitor for rapid updraft development between radar volume scans. This storm resulted in a report of dime size hail.
On Wednesday, we began operations in the Development Lab. After a short debrief of the previous day’s events, we discussed the Day 1 forecast. We agreed that the Norman and Dodge City County Warning Areas were most likely to receive severe weather. Before we decided where to operate, though, we asked Jimmy Correia (SPC) to give a forecast briefing for the Experimental Forecasting Program. From his briefing, it became apparent that convection was most likely to develop in the Norman CWA first. So, it was decided to operate there initially.
Our forecasters were divided into three teams: two warning teams and one mesoscale team. The North warning team consisted of Hayden Frank and Jonathan Buseman; they covered the warnings in north of I-40 in Norman’s CWA. The South warning team consisted of Marc Austin and Nick Hampshire; they covered the warnings in Lubbock’s CWA, then the southern half of Norman’s CWA. Andrew Hatzos and Jonathan Kurtz filled the Mesoscale Desk. We kept these teams throughout the afternoon and into the early evening. Around 5 p.m., though, it became apparent that Dodge City’s CWA was likely to see severe weather. For this reason, Jonathan Kurtz was moved to the DDC Warning Desk.
A squall line developed just west of the National Weather Center toward late evening, which gave us an opportunity to observe the weather for which we were forecasting. The Norman mesonet registered a 40 mile wind gust, and we observed blowing dust from the observation deck of the National Weather Service. After issuing almost 40 warnings, the EWP crew finished operations.
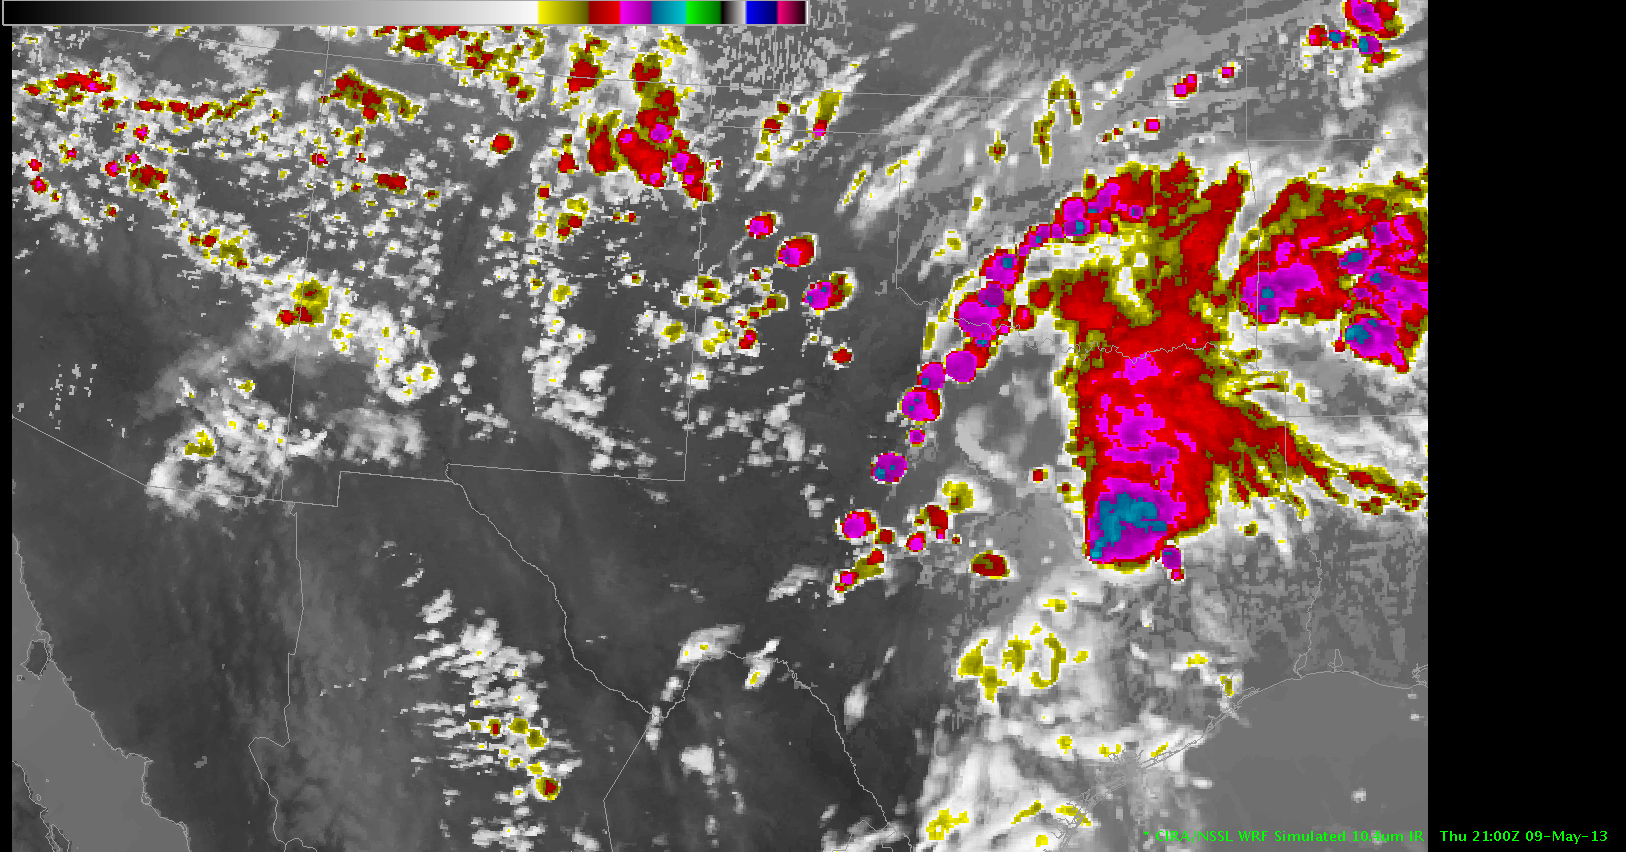
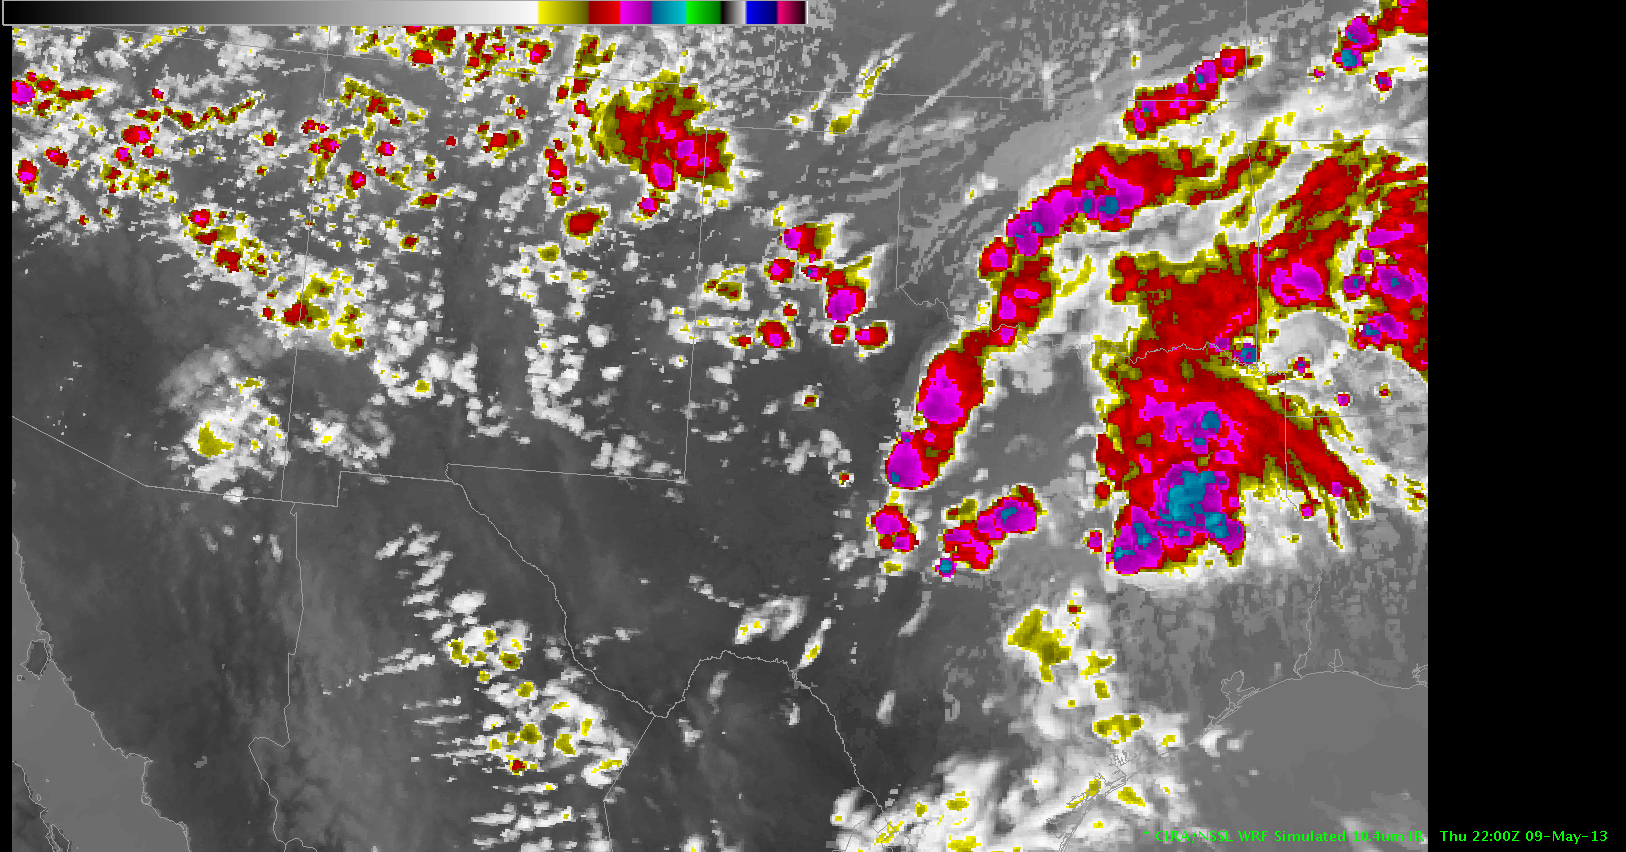
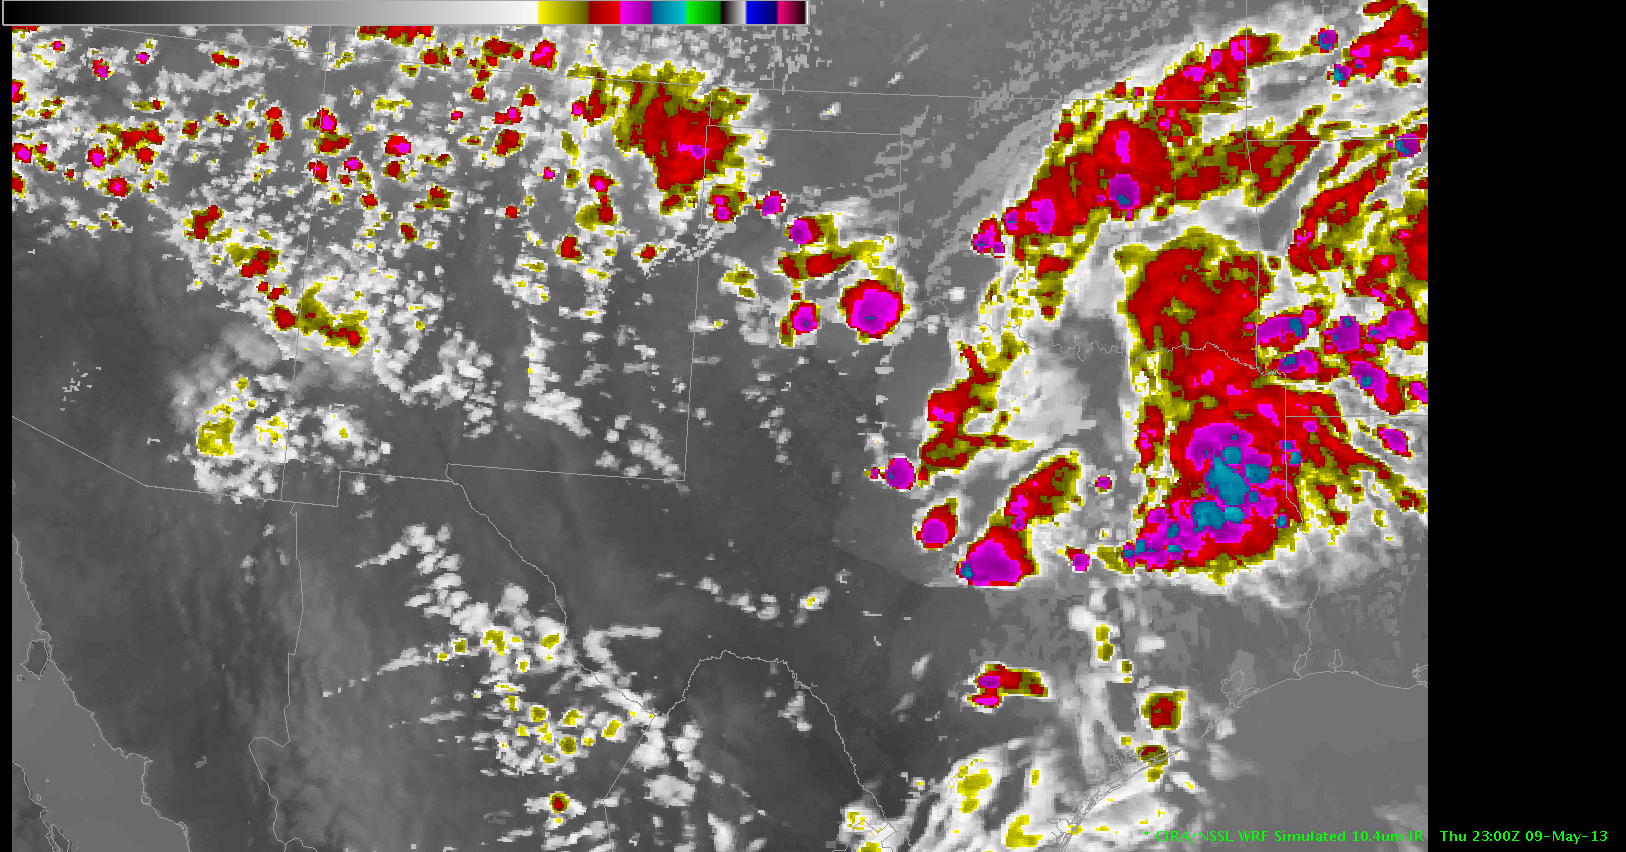
NSSL WRF simulated satellite imagery accurately depicted convection erupting across West Texas as an outflow boundary from a previous MCS across north-central Texas interacted with the dryline. The three following images show a westward propagating outflow boundary interacting with isolated cells along the dryline across portions of West Texas.
NSSL WRF simulated satellite imagery from 21Z.Simulated satellite imagery at 22Z.Simulated satellite imagery at 23Z.
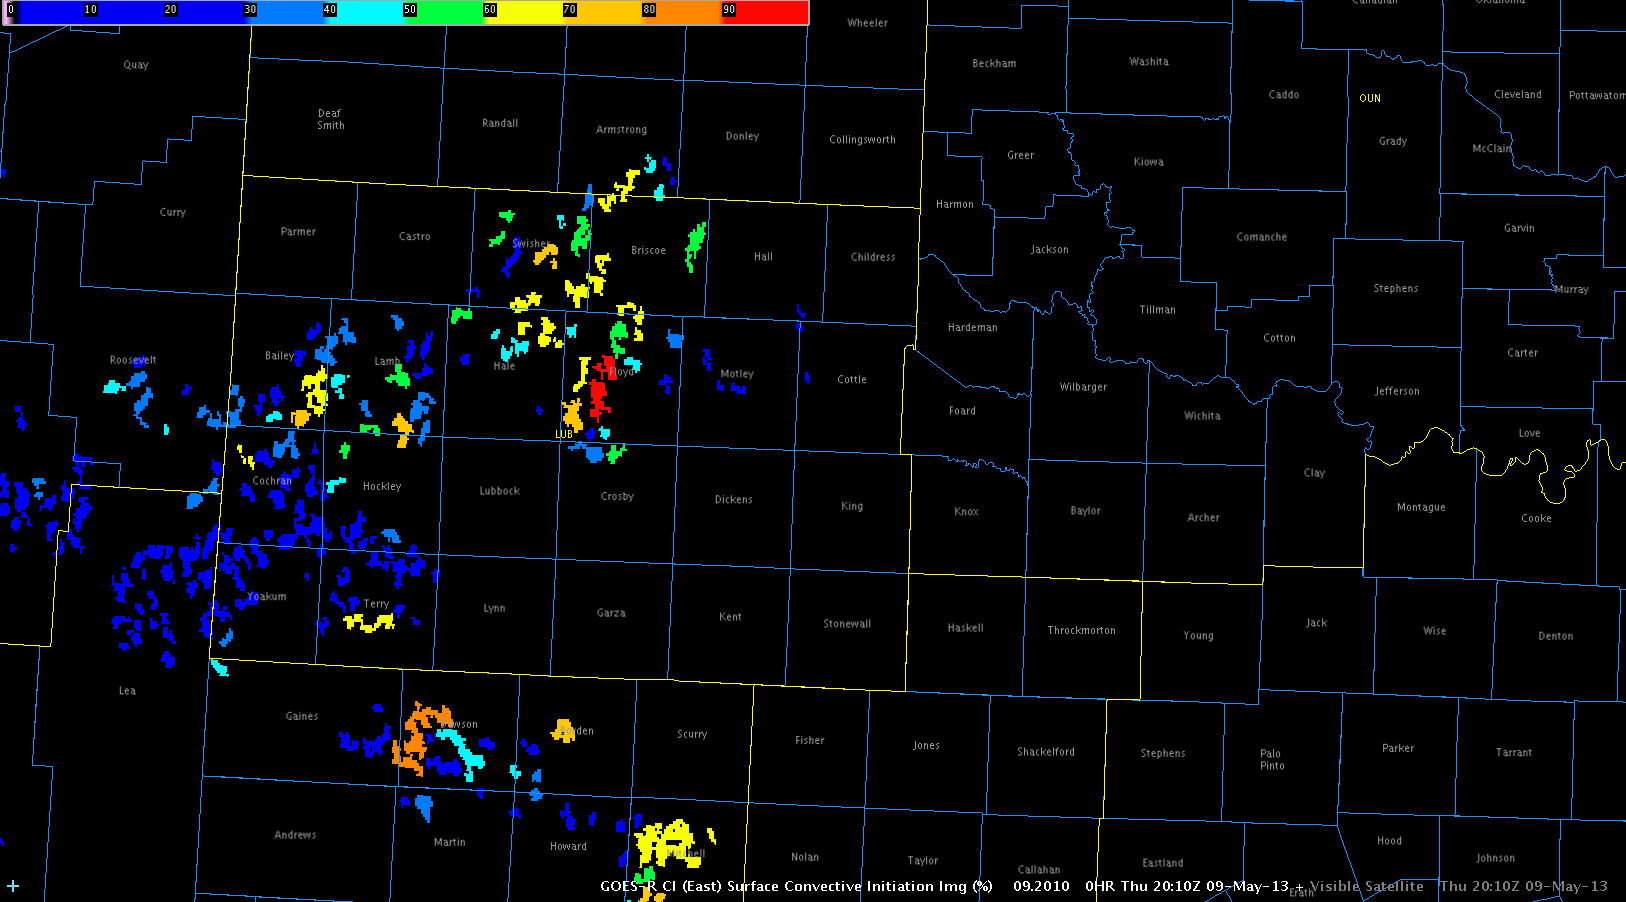
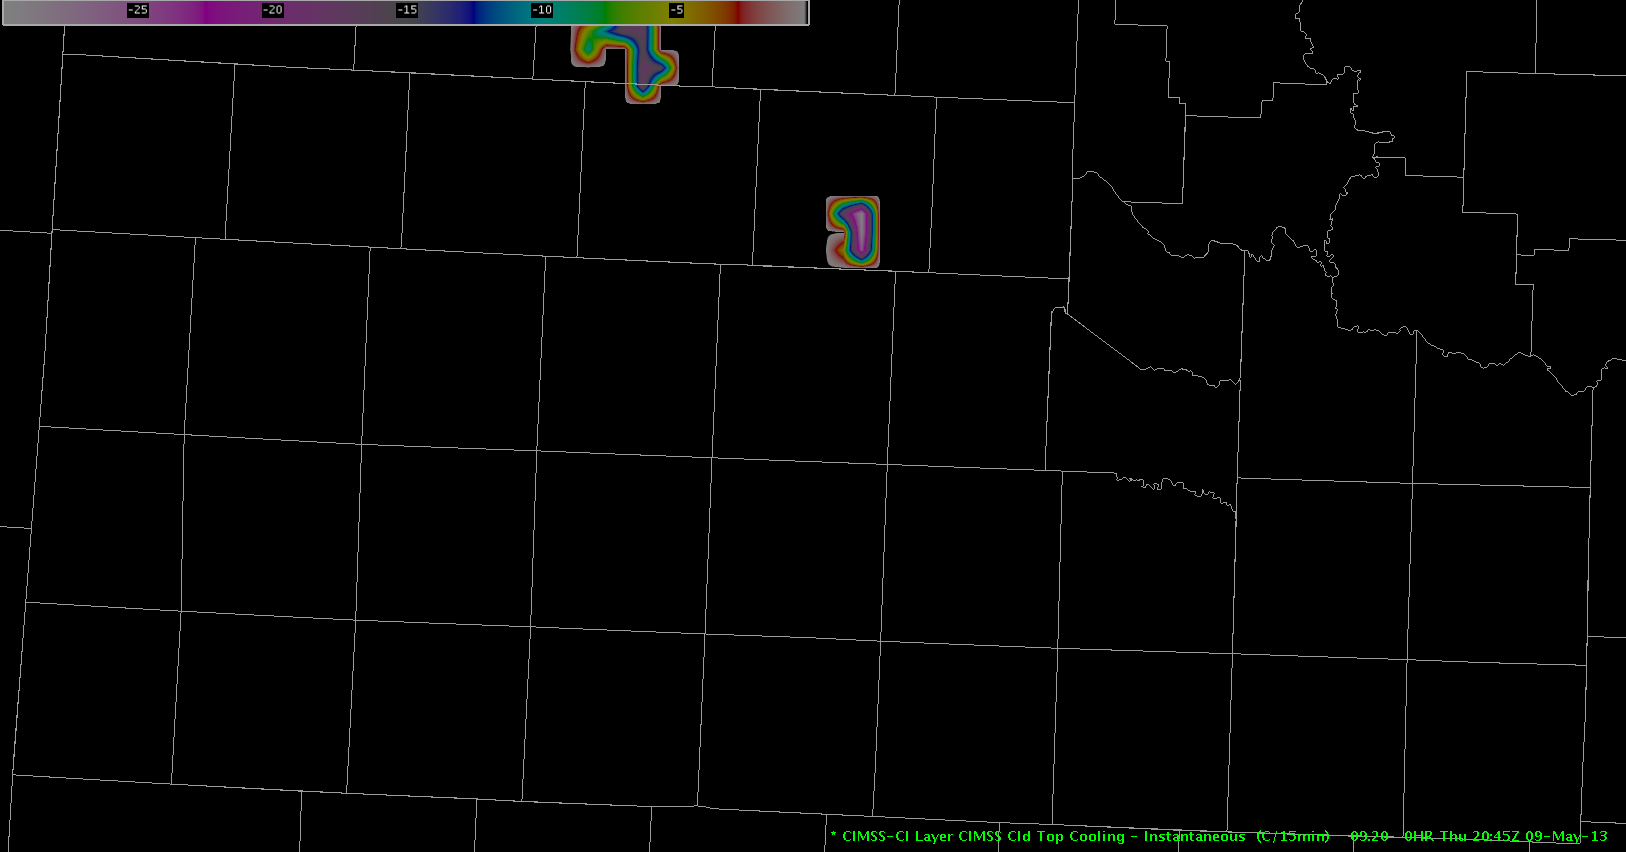
The UAH CI and UW-CTC products were also very persistent in developing convection across the extreme southern Texas panhandle and adjacent portions of West Texas.
UAH CI product prior to convective development this afternoon.UW-CTC product showing persistent cloud top cooling of 15 to 25 C/15 min.
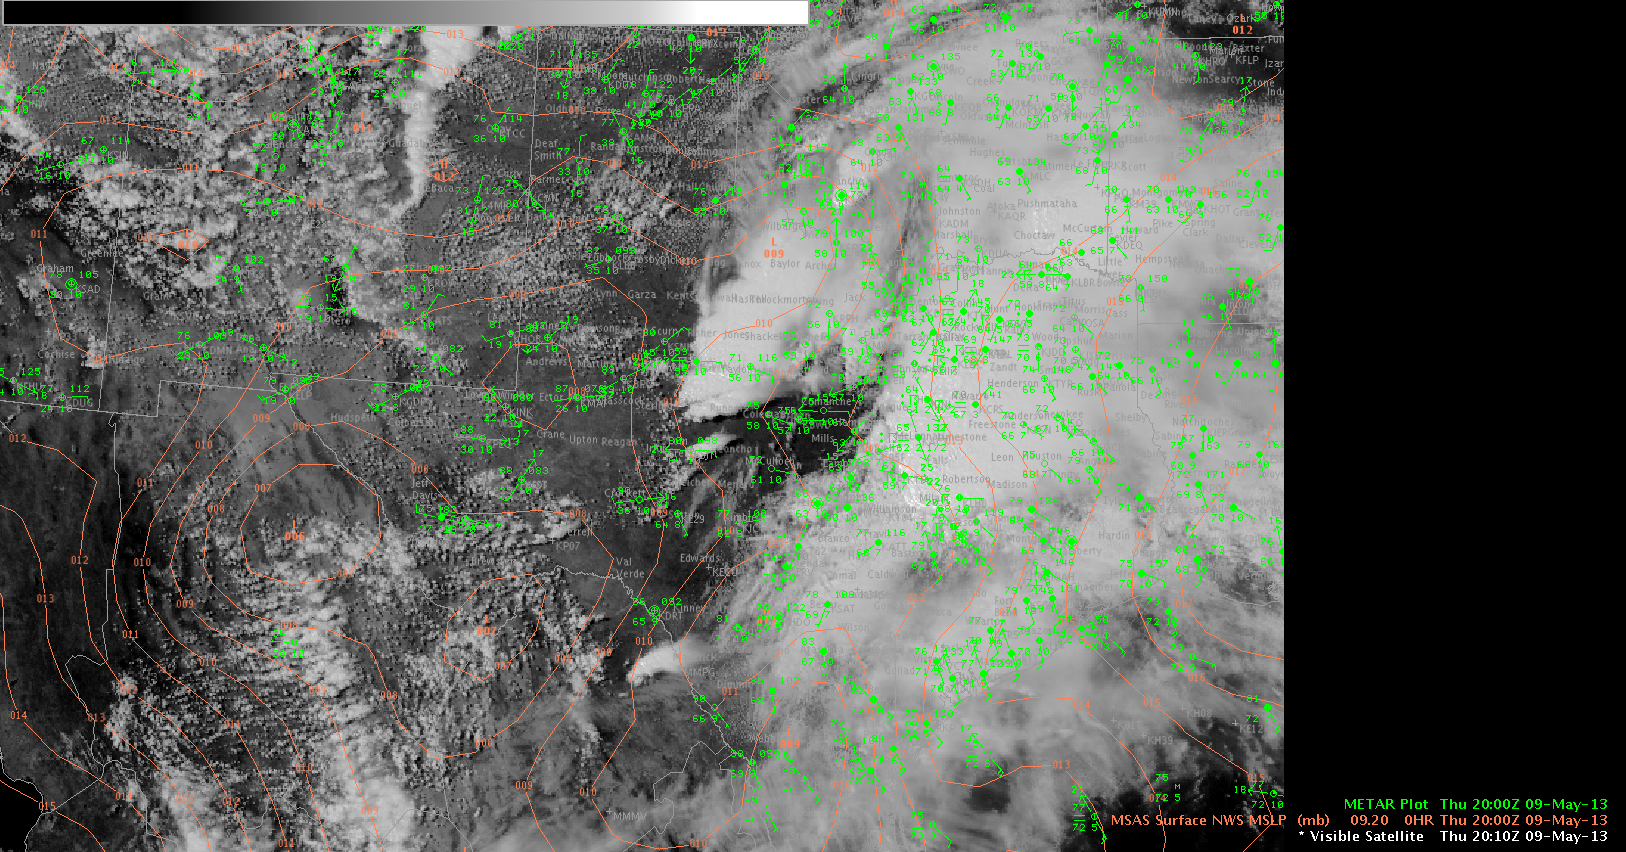
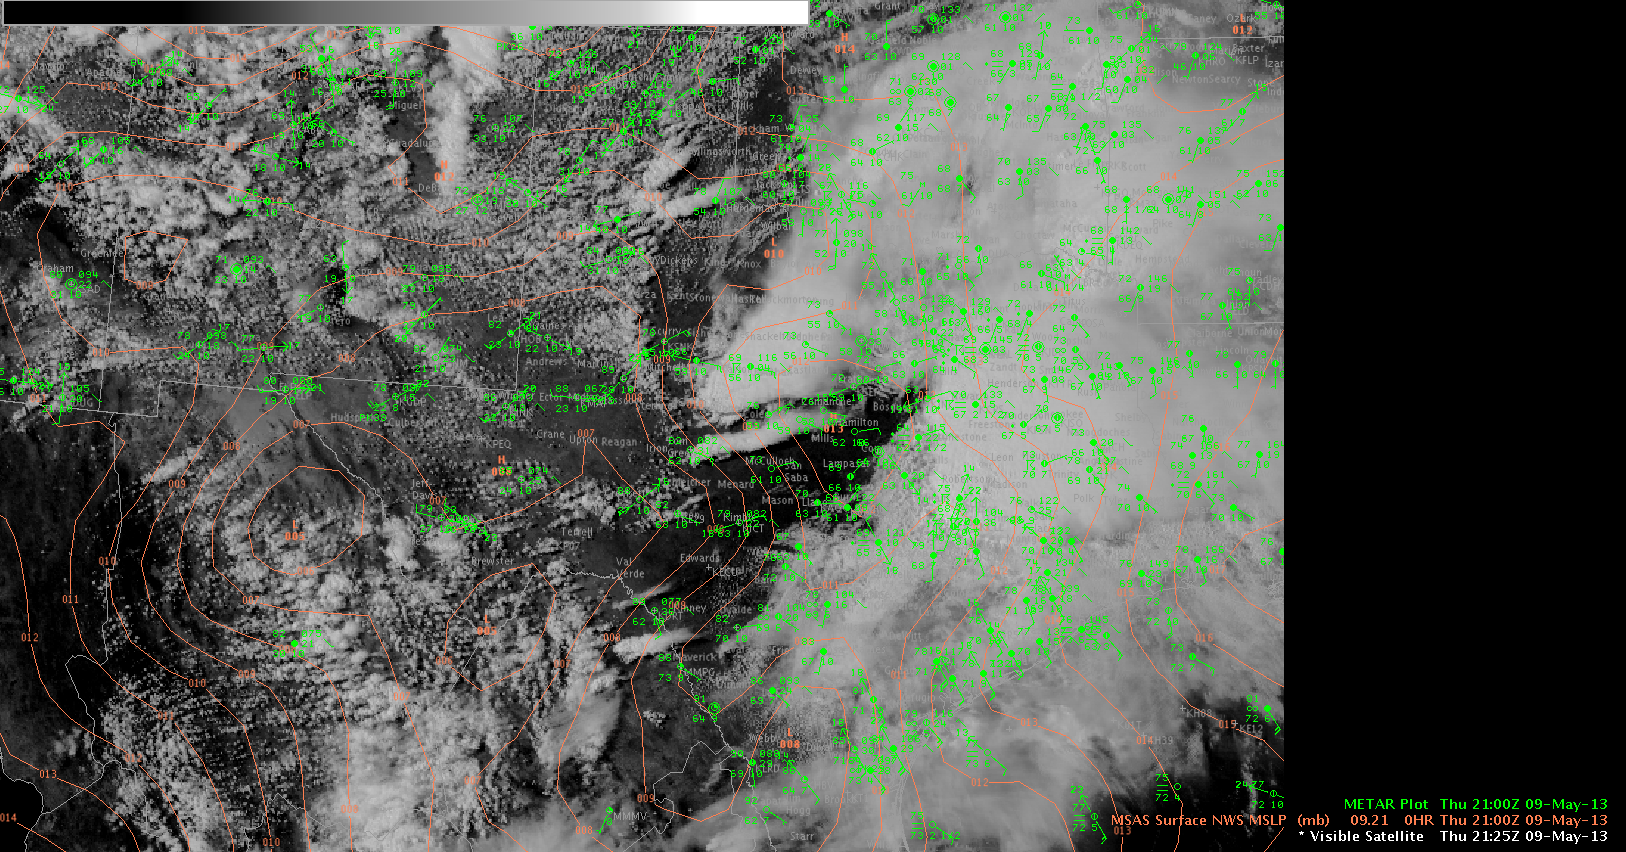
Satellite imagery verified convective development across West Texas. While impossible to forecast the exact location of initiation, the general area was well represented with lead times of up to around half an hour. Convection can be seen beginning near 2010Z and lasting well into the afternoon hours.
Visible satellite imagery overlaid with analyzed mean sea level pressure and surface observations at 2010Z.Same as above at 2125Z.
The image below shows several intense (less than -20 C per 15 min) signals over West Texas in Lubbock’s area. This is a bit of a surprise as most activity was expected to develop farther east. With somewhat limited moisture, we will monitor this area for possible high based severe thunderstorms. If these storms do develop and head east into better low level moisture, they may pose a severe risk across southwest Oklahoma or western north Texas later today.
**Updated at 2305 UTC**
As was advertised by the CTC product nearly two hours in advance, marginally severe high based storms developed over the Texas Panhandle in AMA’s area. This lead time was likely due to the relatively dry environment, which was not conducive to rapidly developing severe storms.
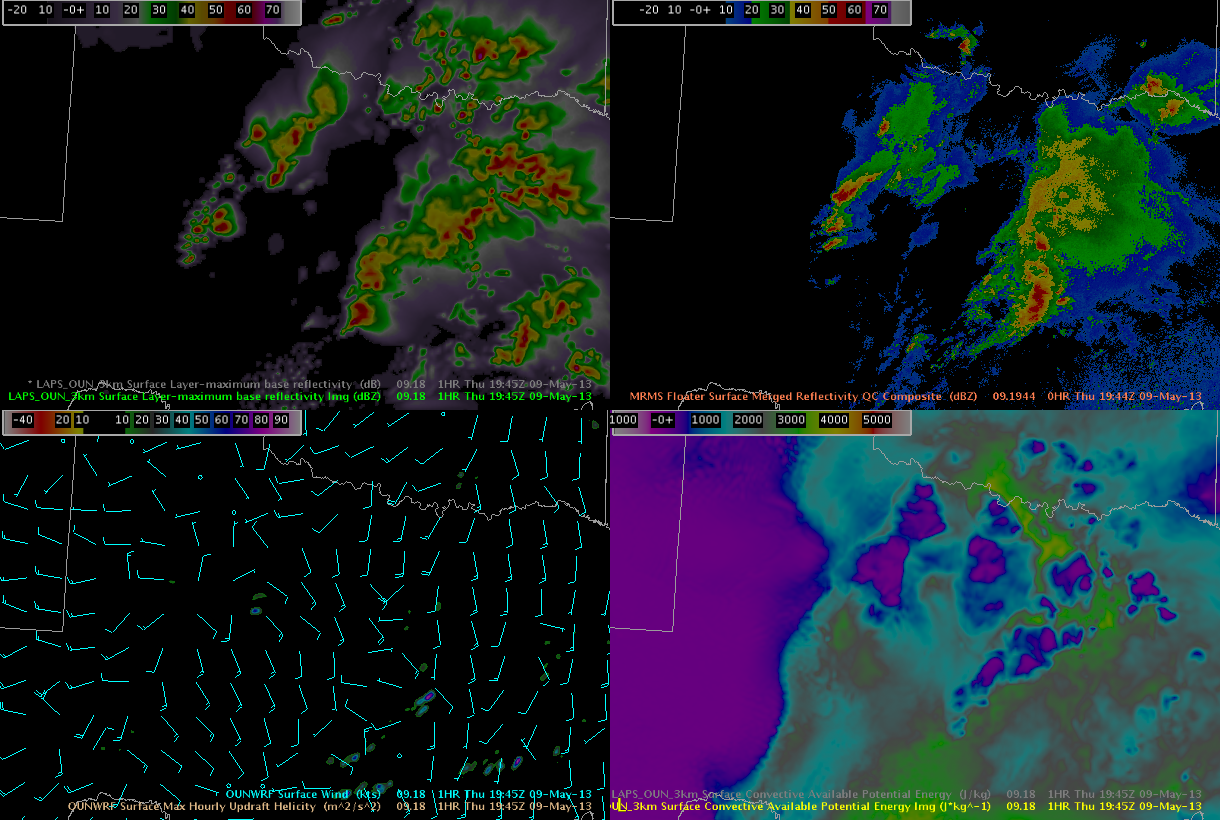
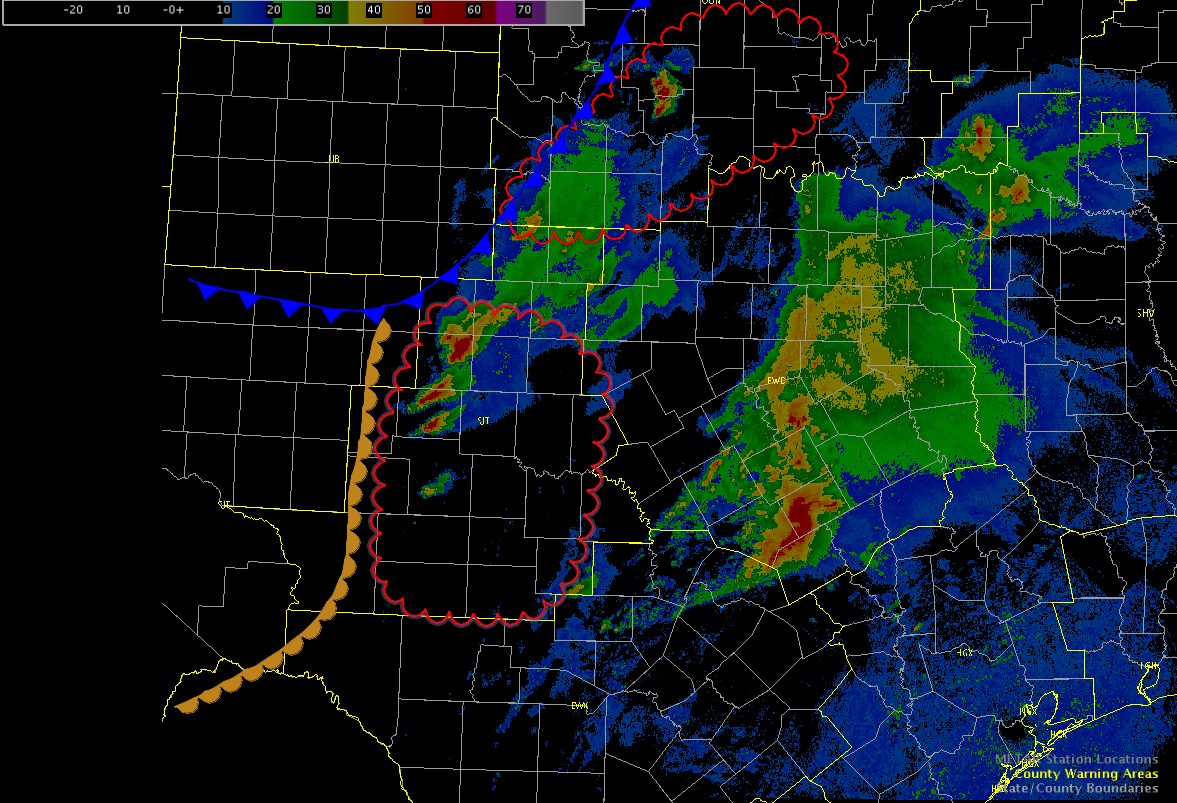
The 18z 3 km LAPS forecast of surface layer maximum base reflectivity has done a decent job predicting the location and track of new updrafts across central Texas, within SJT’s CWA. The below image contains the 1945z forecast of surface max reflectivity from the 3 km LAPS in relation to the 1944z MRMS merged reflectivity QC composite. Note the new individual cells developing across west central Texas on the MRMS Composite and the nearly similar forecast by the 3 km LAPS in both time and space. However, the LAPS forecasts do have their limitations, as the forecasts produced from the initial LAPS product are a function of the WRF. Note the LAPS forecast was not able to handle the timing of the linear complex moving across the FWD forecast area (eastern side of image). The LAPS forecast was a slower and favored individual cells within a line, rather than the complex line that developed and surged eastward.
LAPS refl, MRMS QC Composite, OUNWRF Max hrly updraft helicity/sfcwinds, OUNWRF sfc CAPE
With this event, the LAPS has been a valuable mesoanalyst tool this afternoon, especially within combination with the other short range guidance/mesoscale models.
The HSDA algorithm has been persistent in diagnosing large hail with height. Several reports have been received verifying the accuracy of this depiction.
HSDA algorithm showing large hail at the 0.5 degree radar elevation.Same for 0.9 degree slice.1.8 degree slice.2.4 degree elevation.
Destabilization continues to occur further north into the southwestern portions of the OUN CWA. Surface CAPE values are approaching 3000 J/kg and CIN values are near zero. One severe storm has developed along the surface boundary and additional thunderstorms should develop.
In the SJT CWA, thunderstorms continue along the cold front/dryline. Thunderstorms should continue to build southward into the instability axis to the south. CAPE values remain in the 2500 to 3000 j/kg range with little CIN.
The severe storms in the southern FWD CWA continues to track ESE, but with no additional severe activity expected in the near-term, the FWD team has no moved into the OUN CWA where additional storms are expected and the pGLM data can be utilized.
Red outlines mark highest confidence for significant severe weather.