Final Thoughts

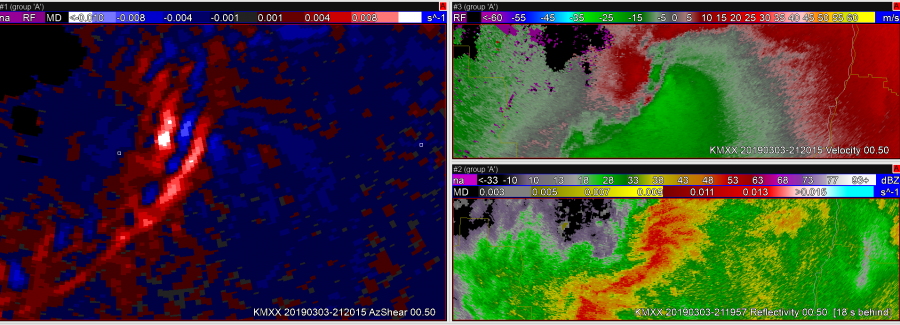
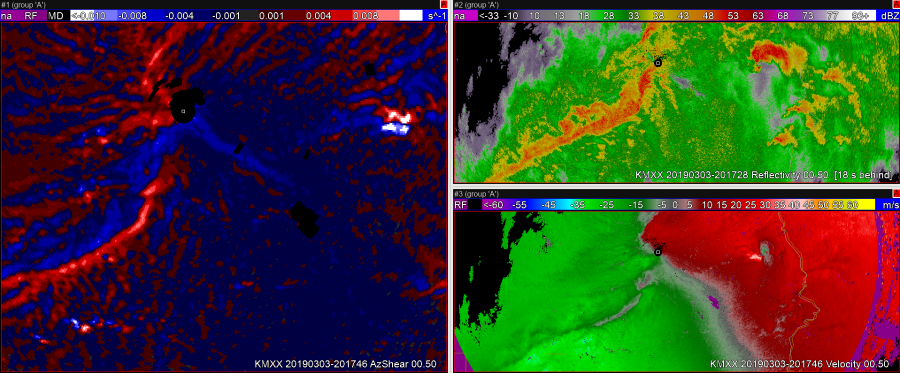
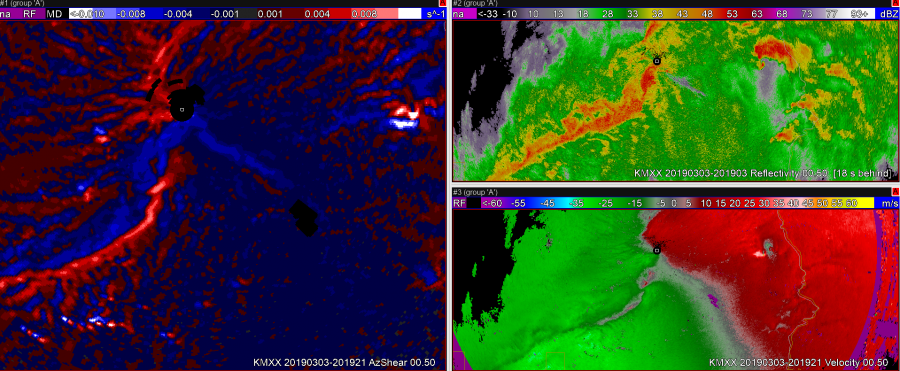
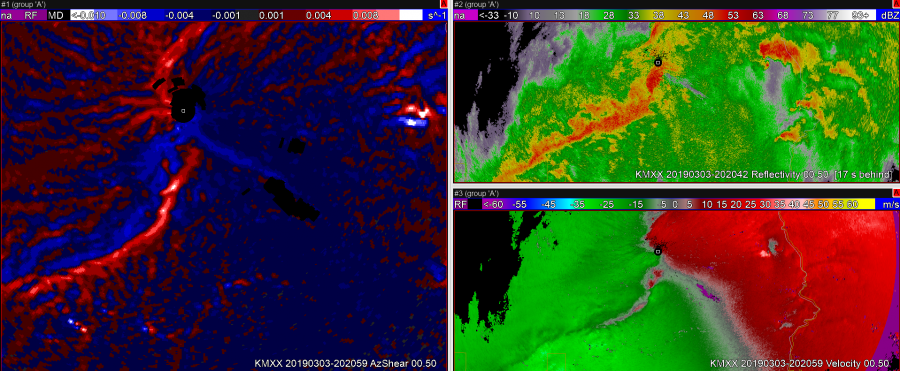
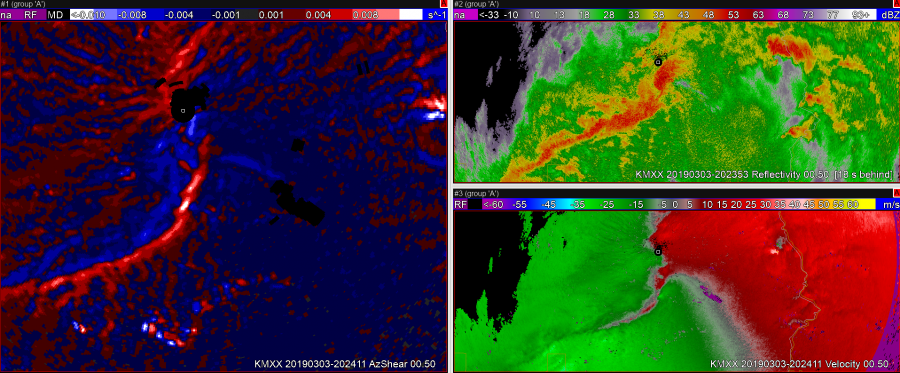
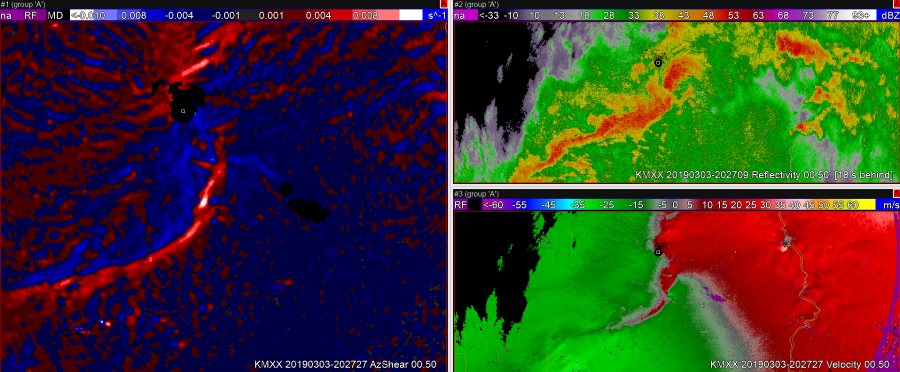
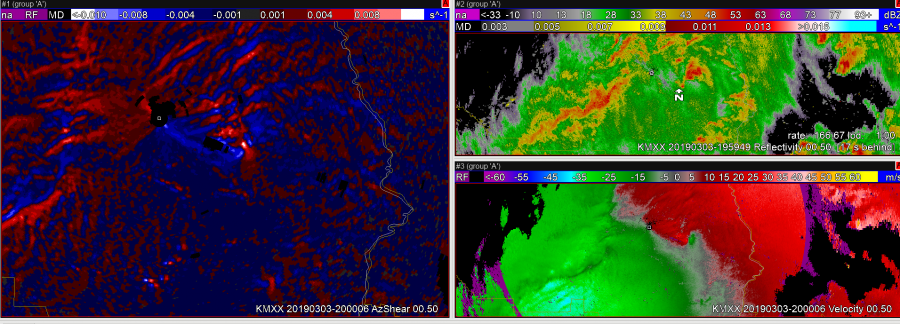
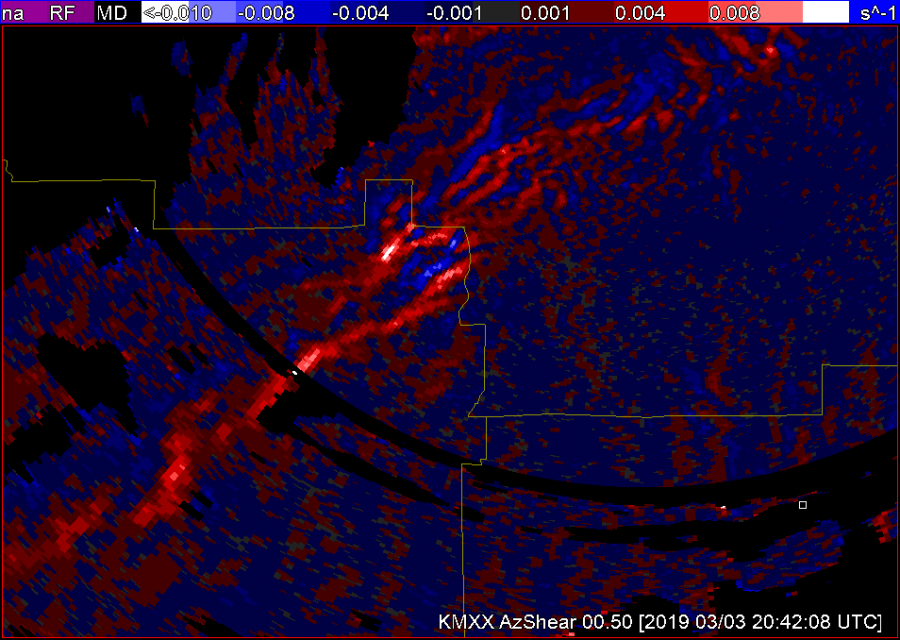
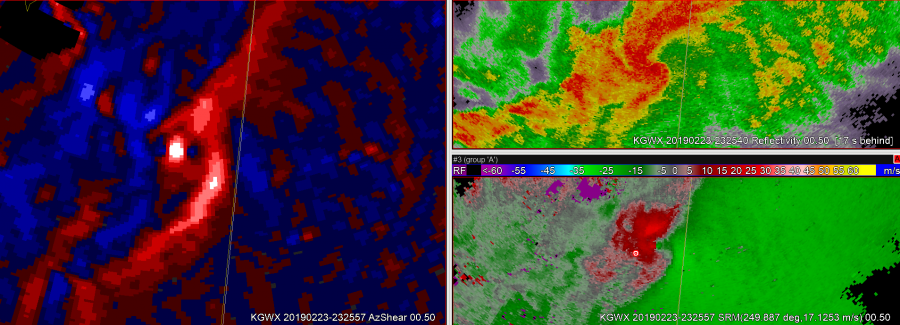
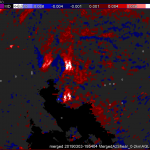
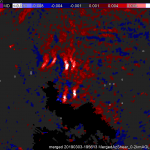
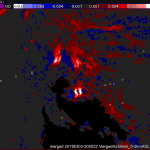
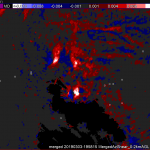
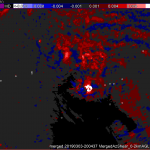
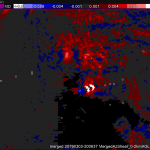
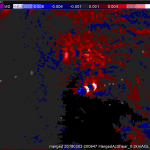
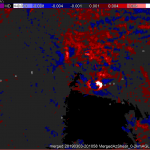
Overall – impressed by Inst AzShear.  Think this could be a real game changer.  Would like to see this fast tracked into AWIPS.

  1.  When used in conjunction with other base and DP products – really supplements storm structure evolution – e.g. gust fronts, UDCZ, RFDs.
  2. Areas of highest values > 0.01 are easy to see – and give forecasters an easy method to triage what storms need attention.
  3. Focused much of my time with Inst AzShear at 0.5 deg.  Did tilt up on a number of occasions to find values near cloud base – and often times very similar to lowest cut.  Would be interesting to see how this performs with mid-level mesos – for things like hail production
  4. Only real drawback I see is the “noisy” appearance to data – especially in areas of ground clutter, wind farms, etc.  But I think forecasters would get used to it quickly.
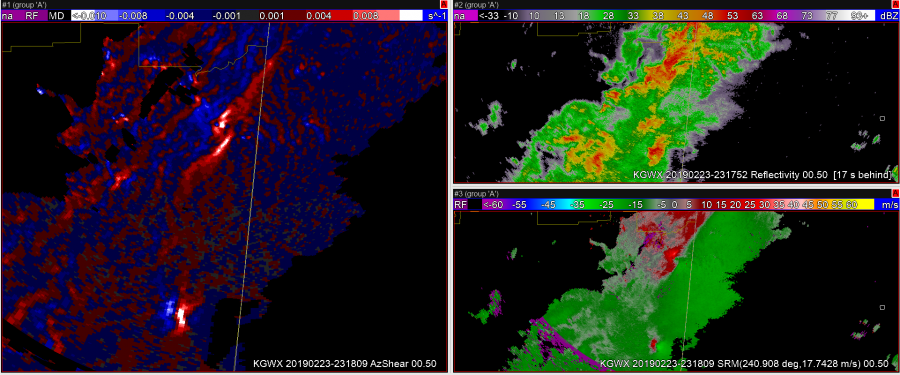
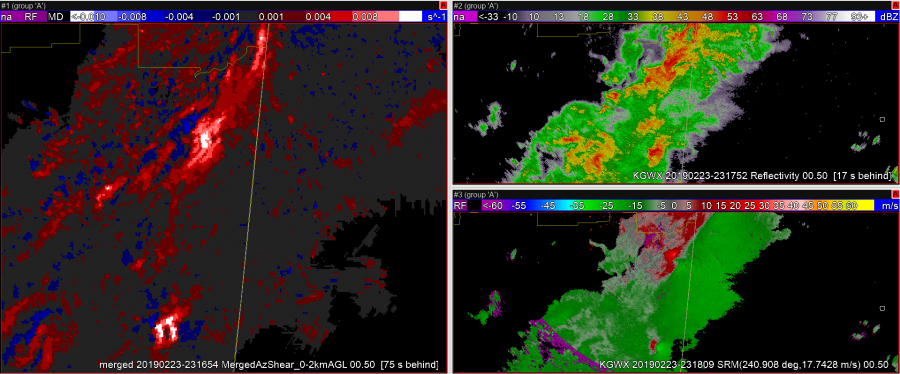
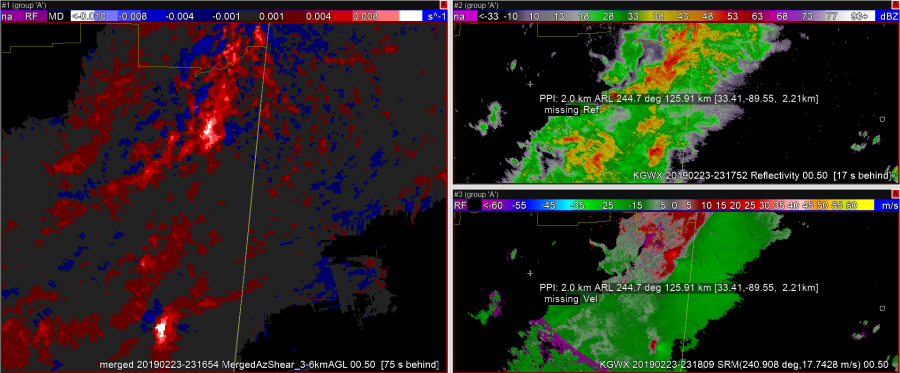
  5. Merged products also useful – both individual and tracks – mainly from an SA perspective – trends, tracks of meso, polygonolgy, etc.

Weak Pulse Storm Analysis – GLM

In the below GIF from Top Left to Bottom Right you have:

  • GLM Flash Extent Density from GOES-16 (East) and GOES-17 (West)
  • GLM Average Flash Area from GOES-16 (East) and GOES-17 (West)
  • GLM Total Optical Energy from GOES-16 (East) and GOES-17 (West)
  • ENTLN Ground Based Lightning Detection and GOES-16 1 Minute Channel 2 Visible Satellite.

The animation shows the quick pulse life cycle of the storm – you can watch the updraft grow and then the anvil get sheared off of the storm in the visible satellite. The Flash Density and the Optical Energy show a quick uptick and GLM registers at the same moment the first ground indication shows up. The Optical Energy maxes out as the storm grows to its tallest before the top gets sheared off. The Flash Density seems to follow the progression of the updraft eastward as well. The smallest Average Flash Area also follow the ‘newest’ and/or ‘growing’ parts of the storm. While convection continues from the cell (it is sitting along a boundary across the SE Part of MAF’s CWA), it does weaken (looks like lower tops in visible – could certainly check this in other ways) and you use lightning from all networks.

While there is nothing ground breaking here it does show how GLM handles pulse convection and the trends in the GLM data. The one downside that I would note here is the lack of some sort of downtrend before the storm weakens. It seems the data generally peaks then goes away rather than drops before the storm dies. It is important to note that the coverage of the various products did gradually decrease (went from several pixels, to two, then none) as the storm weakened.

-Alexander T.

Viewing storm trends using merged AzShear products

Merged products end up showing trend information as new sails cuts come in. In the cases below, notice that the northern storm’s AzShear is weakening over time and the southern storm is increasing.

Above, you can see on the northern storm that the last tile shows weaker leading AzShear. At the same time, note that the leading AzShear signature in the southern storm is increasing.

The northern storm continues to dissipate as the upper tilts catch up to the sails cuts that were weakening earlier. While the southern storm continues to increase in AzShear intensity as the sails cuts would suggest.

At this point the northern storm is gone and the southern storm is quite strong and large.

So not only does AzShear provide a situational awareness of the strength of a couplet, it can also show rotational trends in a storm over time assuming that SAILS is turned on. Plus, the more sails the more information you’ll get in these plots. In the case above it appears SAILS2 was on as you’d get two leading signatures before the data merged back into one storm.

–FLGatorDon

SJT Mesoscale Discussion

There is a warm front draped across the northern portion of the CWA with widespred cumulus developing along the front and broken skies in the warm sector. GOES-16 Day Cloud Convection RGB and Day Cloud Phase RGB show that a few of these storms have already glaciated indicating the convective initiation is underway. (Below)
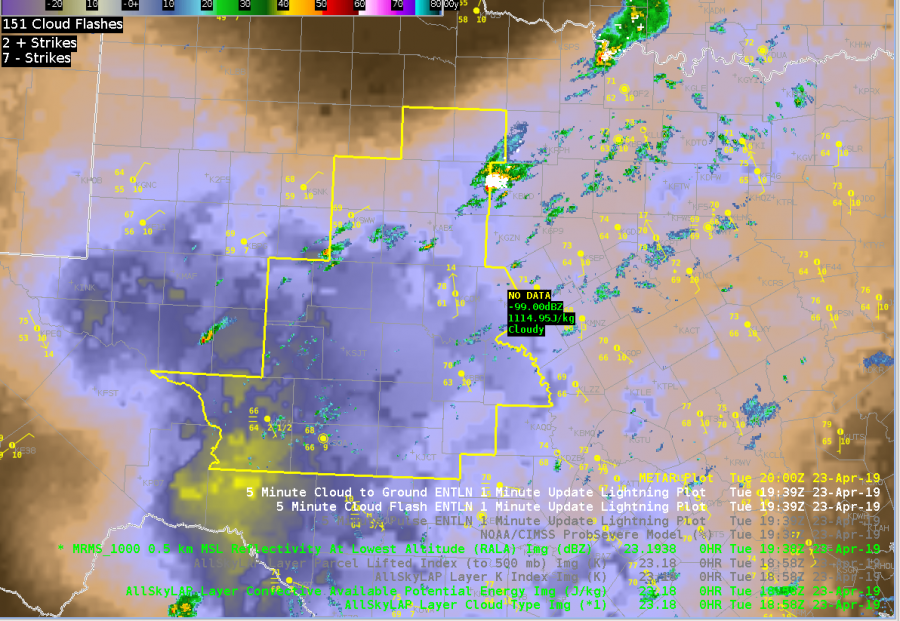
Laps All Sky retrievals show a relatively sharp instability gradient along warm front where our convection initiated. Storm motion is likely to be parallel to the front, so convection that does will likely be relatively long lived. (Below)
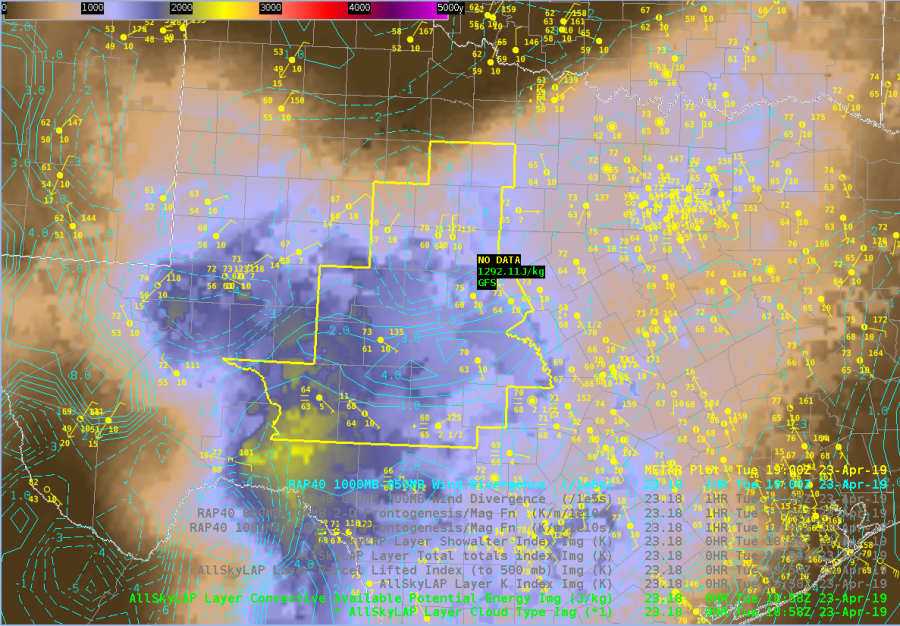
Laps All Sky LI further indicates that the airmass is relatively unstable and there will be little convective inhibition at least in the midlevels. (Below)
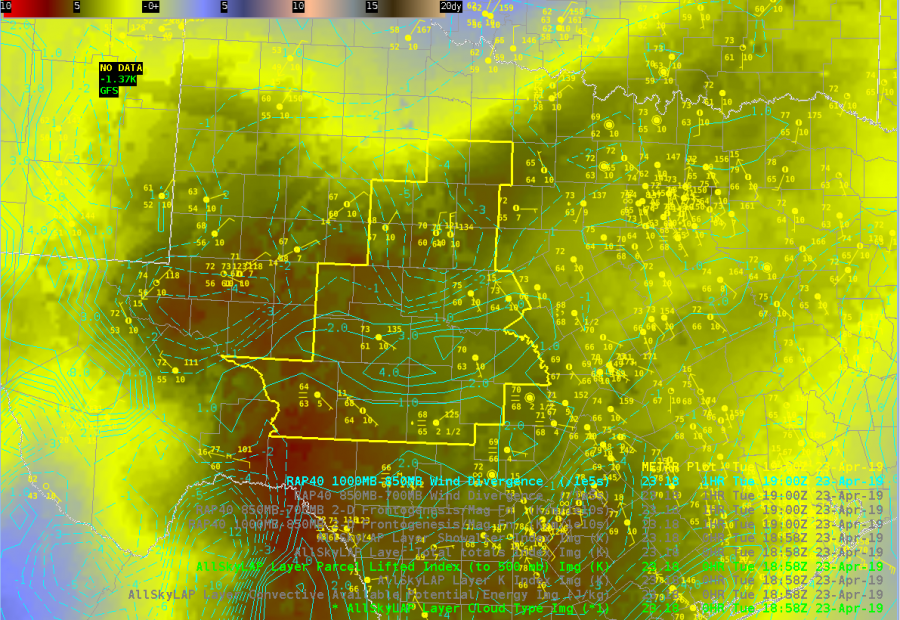
All Sky TPW indicates a relative moist airmass across the CWA with PWs above 1″ for most of the CWA. This matches the 12z sounding from MAF relatively well, and is well above the 90% threshold of the sounding climatology for that location and date. It’s interesting that the mid-level moisture (bottom left) is higher than the low level moisture (bottom right). Not quite sure what to make of that at this point. (Below)
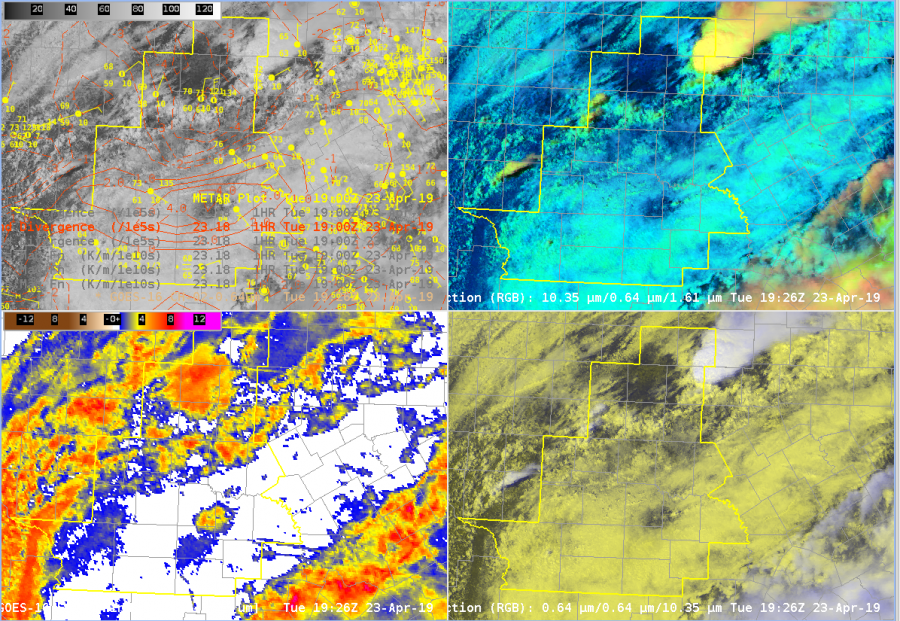
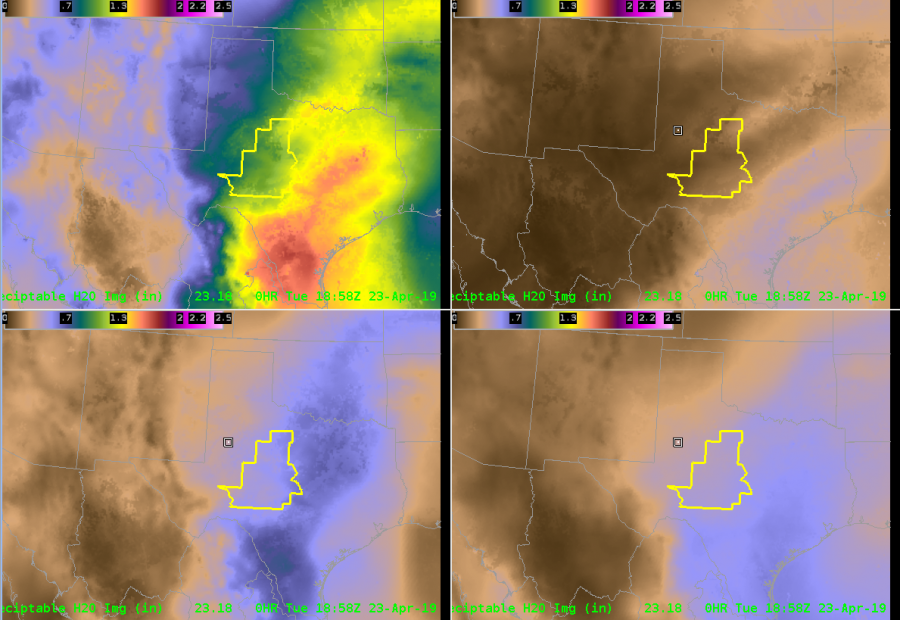
Finally, MRMS RALA indeed shows that showers and storms have developed along the front. When animated (not shown), you can see that the storms are tracking along the front, heightening my concern for flooding. 

Sandor Clegane

AzShear Inflow and RFD/Gust Front Signature

Around 2120Z – interesting structure on a storm SE of KMXX.   Can see in Azshear – inflow from the south immediately ahead of the gust front.  However, behind this feature – can see an area of enhanced Azshear.  Question would be – how much would the PBL be worked over – cooled – and how might that influence tornadic potential?  Yet – another easy depiction on what is going on with storm evolution.

QLCS and Single RDA AzShear

The single radar AzShear product continues to show utility in diagnosing storm structure and trends which leads to higher confidence and earlier warning decisions (in addition to the overall SA nature of the product).

In this case you can clearly see the line segment transition from (see captions):

Mainly linear
Starting to see ‘S’ shape develop in a segment of the line in the AzShear enhancements
Now a notch is beginning to develop in the same area in the AzShear product. Probably getting a box drawn up now based on trends in AzShear
The blue’s in the AzShear are starting to fold into the line, and while inbounds are increasing in the V field, the notch isn’t as evident. I’d probably have a warning out now based on AzShear pushing me over the edge.
Outbounds are just starting to appear on the V product while I’m happy I already issued a warning because of AzShear
Thinking about a Tor here based on V data, not sure if I’d issue yet.
Warning for sure based on V at this point.
AzShear increased my confidence in the base products enough to get a warning out 3-5 minutes earlier than if I was just looking at some form of Z/V data.

— FLGatorDon

KMXX – Inst AzShear

Using a combination of Z, Zdr, inst AzShear from KMXX – can see development of low level mesocyclone quicker than V/SRM alone.  Can see the “white” > 0.01 s1 show up as early as 2000 UTC on the main TOR- while Z/SRM shows mainly a convergent signature.


Looking down the convective line – south of KMXX – examining the Azshear around 2040 UTC.  Area near the county border does trigger above 0.01 – whereas areas further south are slightly weaker (see image).  Would be interesting to know which of these produced tornadoes.  Reminder – plotting the tracks would be great!


AzShear Case Assessment

First time looking at these products (Single Radar AzShear, Merged AzShear 0-2km, and Merged AzShear 3-6km) and I’m already liking how quick it is to pull my eyes to areas I should be paying close attention to. The most obvious feature is the circulation well to the SW of the radar site (close to 115km out), but what I find to be even more useful is watching mid-level rotation tighten into a low-level circulation closer to the radar site (around 51km away). In the first screen capture below, the Single Radar AzShear product highlighted the RFD bulging out, which is very useful in being able to fully diagnose the developing case. In an operational setting, having the full suite of AzShear products available to supplement traditional radar products could raise confidence when making a warning decision. Both of the merged products increase my confidence in the vertical depth of the circulation, but is also useful when diagnosing shallow circulations, at least in this one case I’ve been looking at. I’ll be interested to see how these products perform in other cases, particularly ones that involve the more shallow QLCS TOR-scenario.

All that said, I will say that there are enough false positives appearing in the AzShear product suite, particularly the Single Radar one, that caution should be taken if using solo, without reference to the traditional radar products. In an even more active scenario, I could potentially see false positives taking the warning forecaster’s attention away from features that need closer attention.

~Gritty

Storm Structure More Evident with AzShear

The AzShear products seem to accentuate features such as the RFD which could allow for a better assessment of RFD strength and the potential for new tornado genesis in cycling supercells.

In this specific example the initial tornado weakens or dissipates, and when faced with a decision whether to continue or re-issue a warning, the enhanced RFD signature would have prompted me to continue the warning. Sure enough, several scans later a new circulation developed that would have prompted a new tornado warning on its own.

— FLGatorDon