Primary area of interest on this storm is the western-most mesocyclone highlighted by the NMDA. Unfortunately, the NMDA identifies this rotation with several different names, making it difficult to track through time. Sandor Clegane
More Lightning Analysis…
So far, the MFA is following the previous logic of using it as a way to identify vigorous updrafts. Below, the progression in a 15-minute period follows that correlation between the smaller flashes increasing in area indicating a strengthening cell(s). However, I could see its utility degraded in a larger-scale multicell environment with clusters close together, especially as the areas of smaller flashes increases, given the low-resolution of the grid itself. As for Total Optical Energy (TOE, at the bottom), I think there is benefit in using this product as well to monitor trends, but I had to use a different color curve for it to stand out to me more (last animation, below).
~Gritty
2146Z:

2155Z:

2200Z: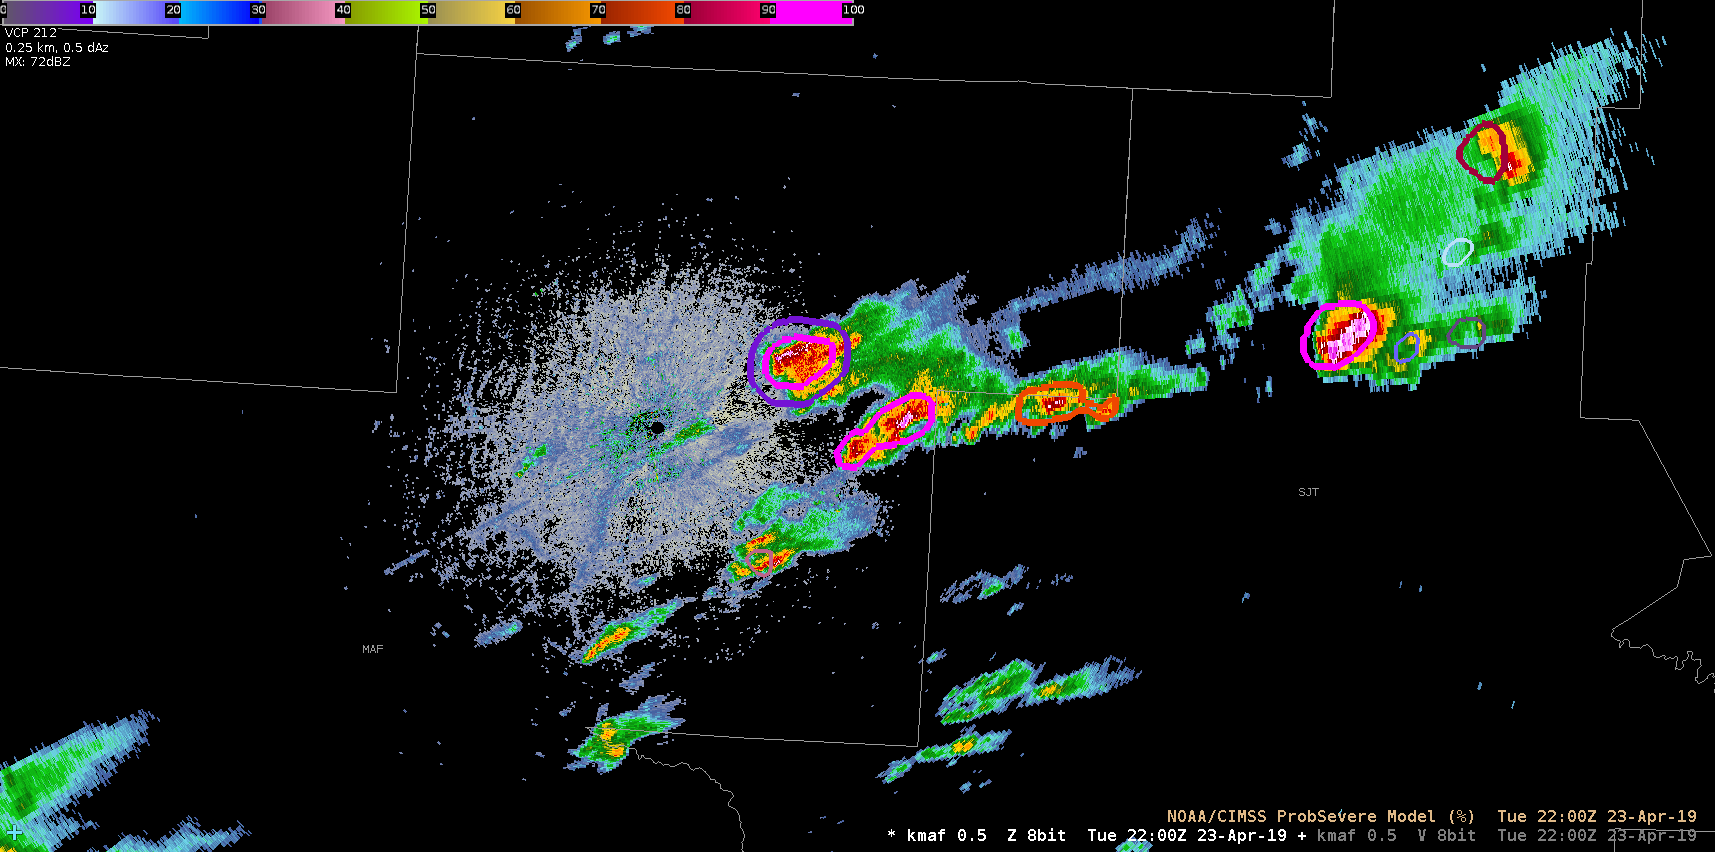

TOE Loops:

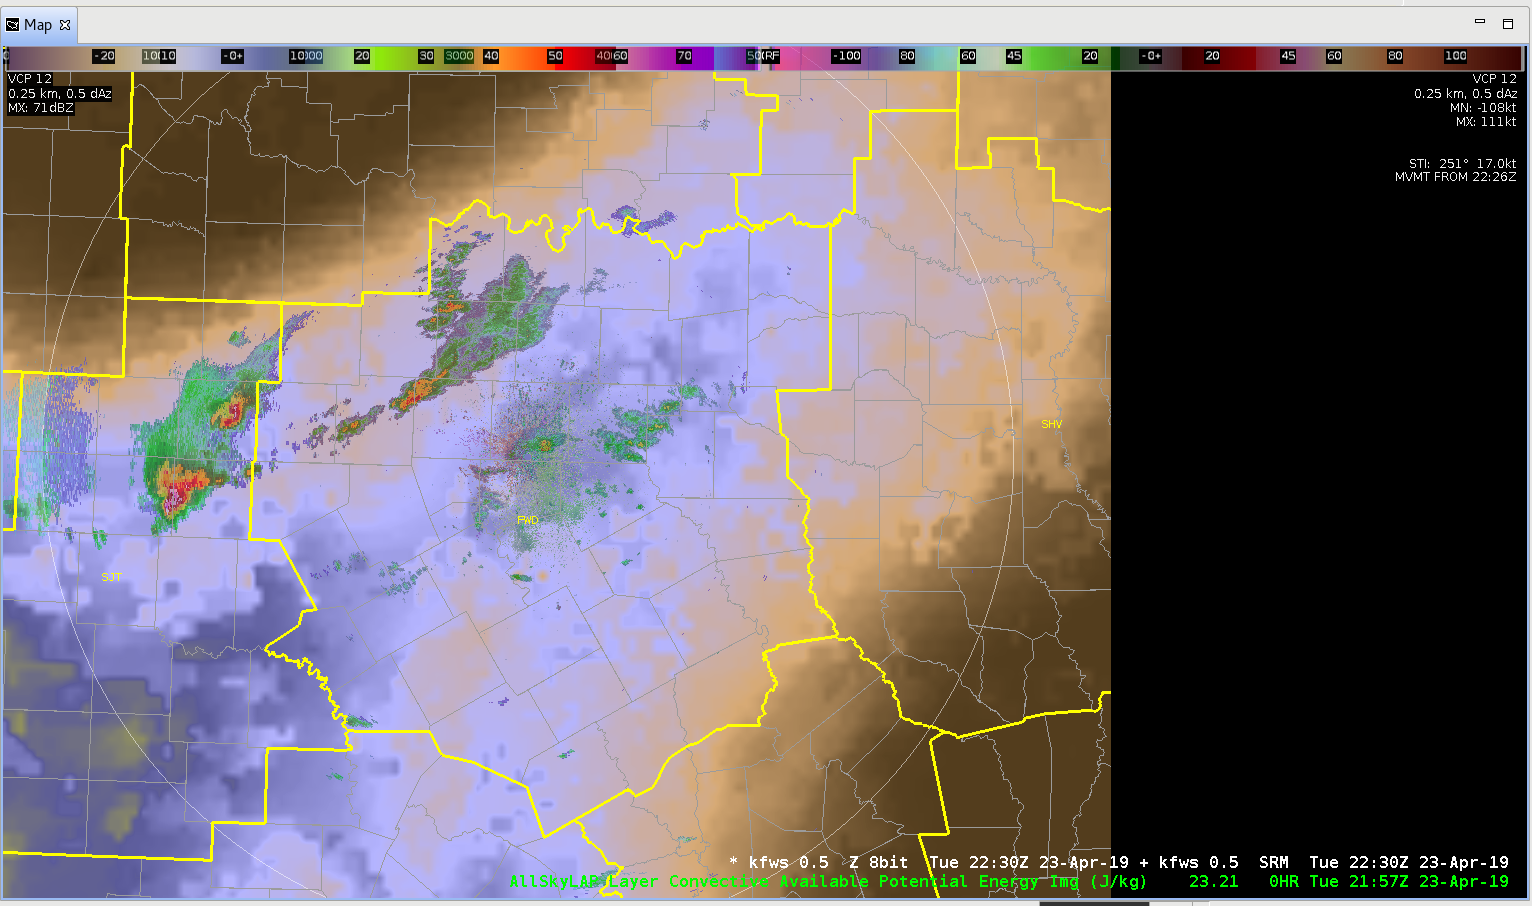
AllSkyLAP – CAPE vs Radar
Easy display for SA is to plot radar (Z) over the AllSkyLayer CAPE. In this case – storms are moving off slowly to the NE – in an area of similar CAPE values. With expected cloud cover, further destabilization is not anticipated. Thus, would expect storms to remain at current levels – or perhaps slowly intensity. Would need to be monitored – but “rapid intensification” is not expected.
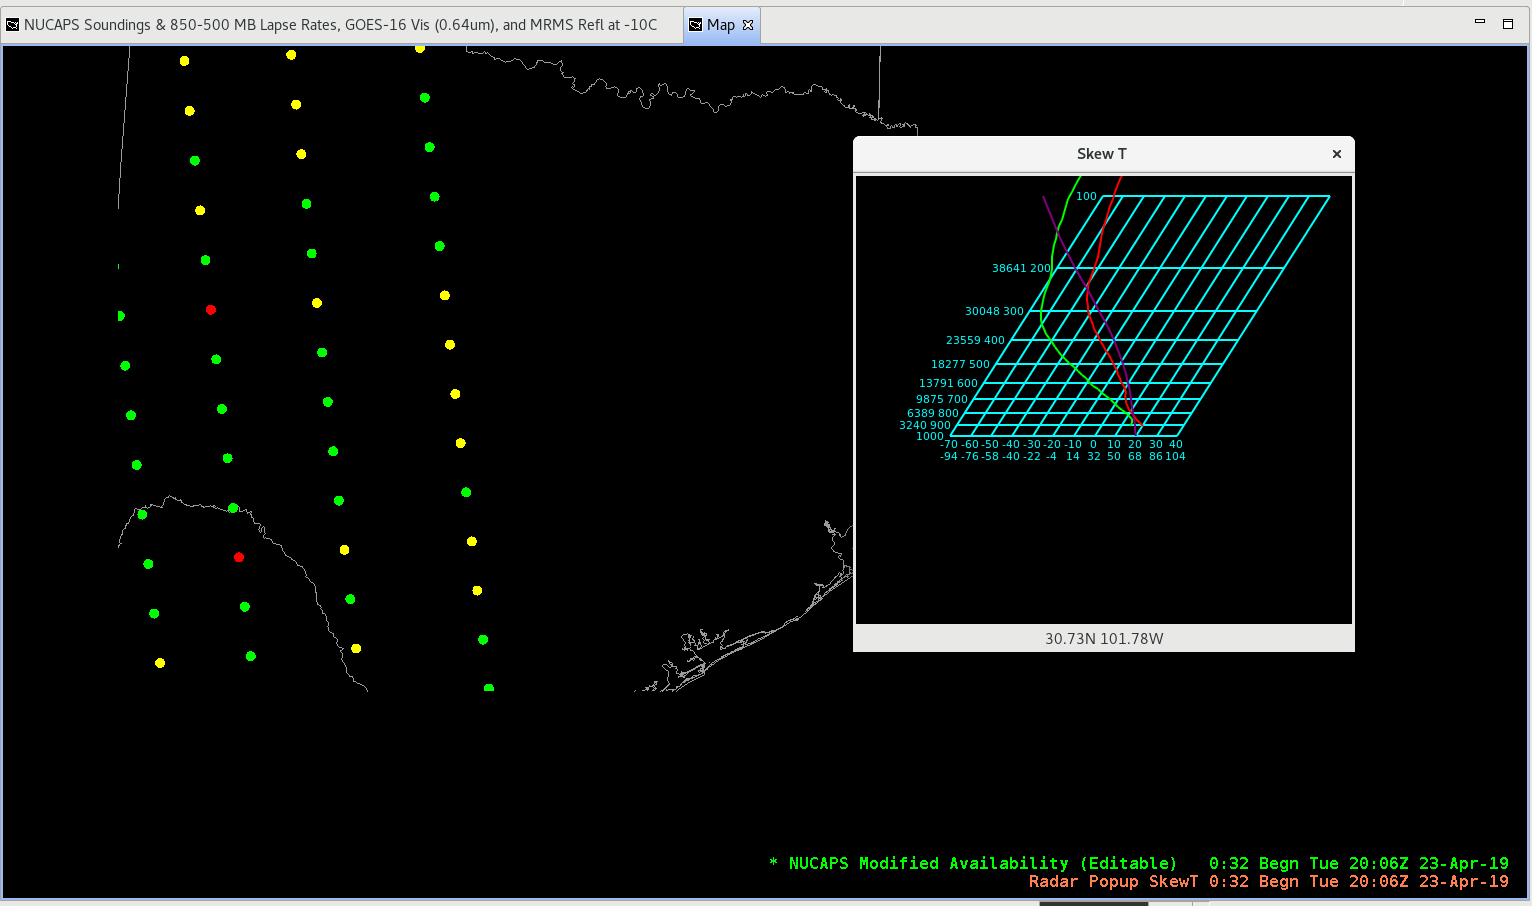
NUCAPS – PopUp SkewT – Needs Improvement
One way to increase NUCAPS sounding data usage is to improve the ability to display “mouse over” soundings using the PoP-Up SkewT. See the example below – I was able to mouse over the various points and display the NUCAPS soundings.
However, the PoP Up SkewT display is small, crude, and cannot be enlarged. If a version of NSharp could be integrated into the PoP Up SkewT (e.g. larger SkewT with thermodynamic variables below) – then forecasters might use it more often. The current PoP Up SkewT is probably 10 yrs old – and needs improvement.
SJT Mesoscale Update #2
NUCAPS retrievals became available around 21z, so I decided to do a new mesoscale analysis. I wanted to know about the air in the warm sector that the storms will likely be ingesting. The first retrieval I looked at was the southern-most green dot in the eastern most MUCAPS swipe. The sounding in this retrieval came in with a surface temp about 20 degrees cooler than the observation, so I’m thinking this retrieval is either being contaminated by ongoing convection or actually sampling north of the warm sector. The retrieval just to the south of that had surface temperatures more reasonable, and the associated skew-t is shown below.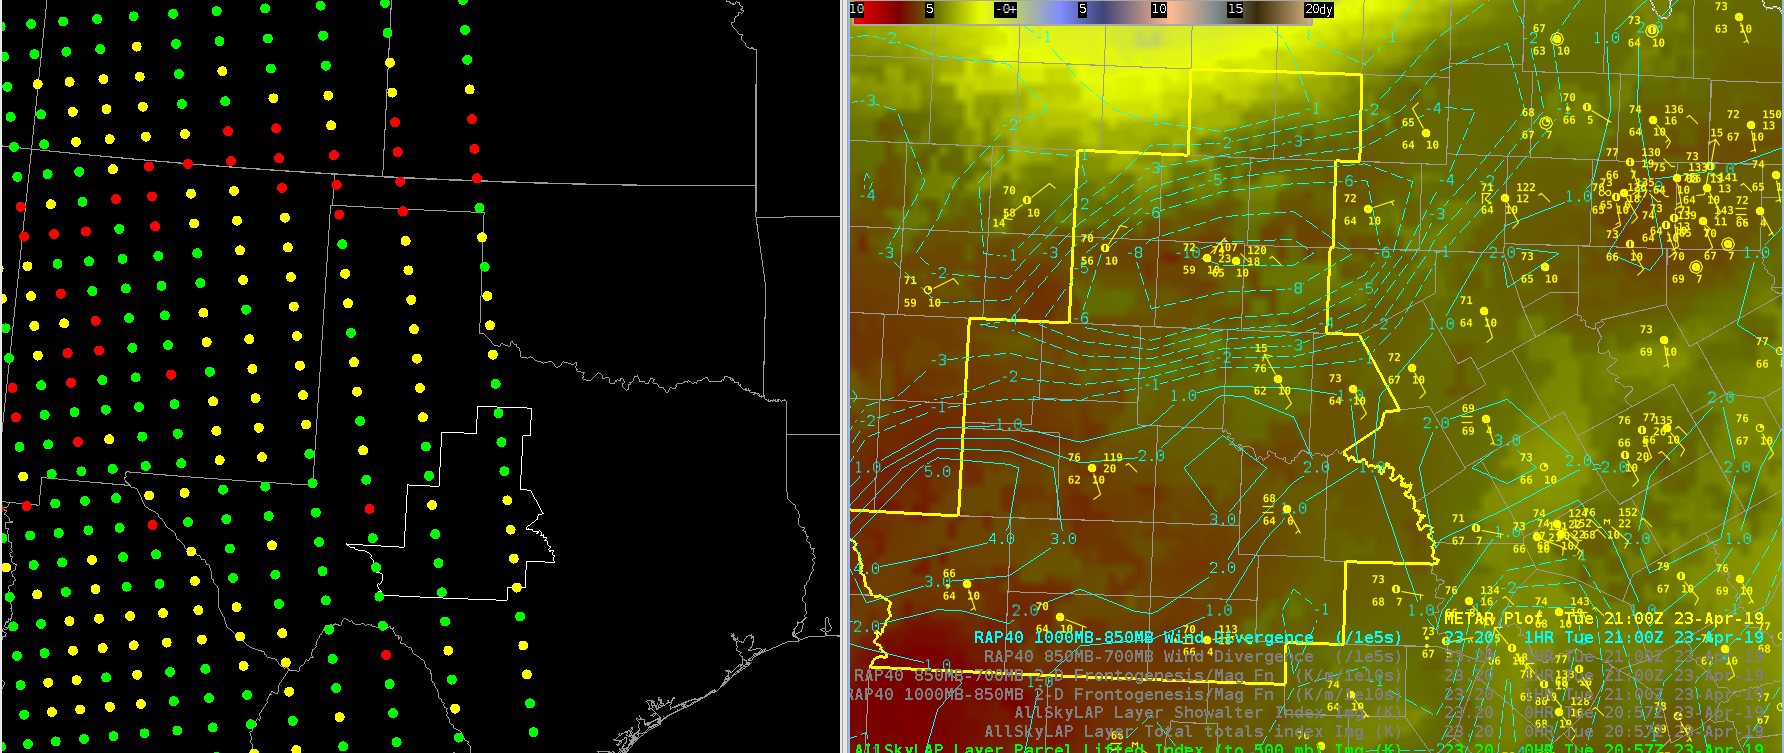 After a quick adjustment to the lowest points on the sounding, this clearly looks like a severe weather sounding. I’m hesitant to rely on CAPE estimates given the dependency on the boundary layer, but indicies more reliant on mid level obs (LI) are still indicative of strong to severe storms. This compares well to all-sky LAPS retrievals (above, right).
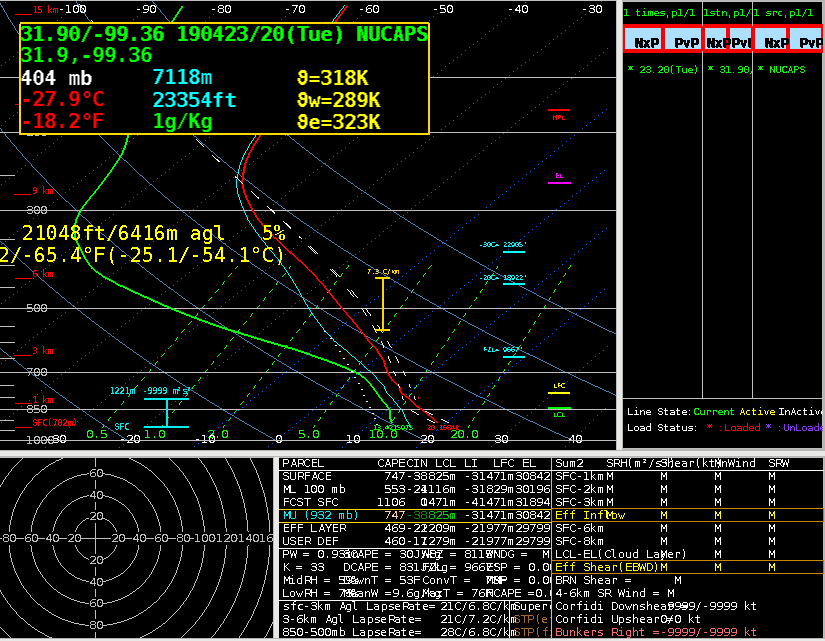 In typical operations in which I do not have access to these products, I would rely on the SPC mesoanalysis (below) to estimate instability. The NUCAPS and LAPS All Sky retrievals do somewhat increase my confidence that the mesoanalysis is close to reality. However, Given my conceptual model of how the atmosphere should be behaving, I was already highly confident that the atmosphere is quite unstable in the warm sector, so the increase in confidence from NUCAPS/LAPS is somewhat limited.
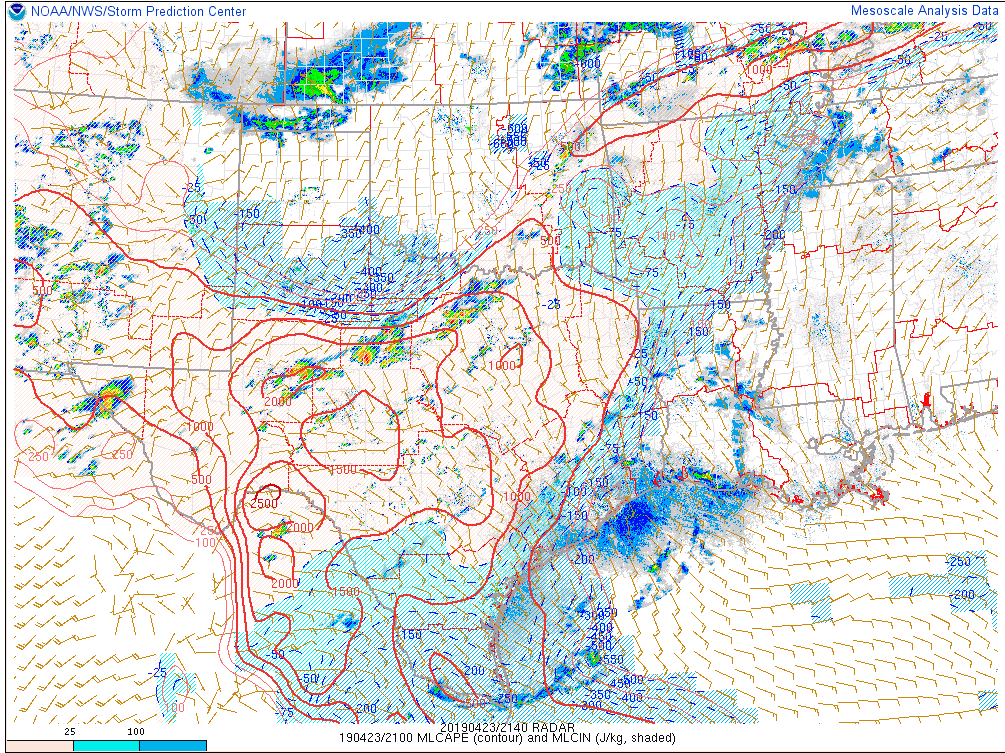 Sandor Clegane
NUCAPS Modified vs. Non-Modified
With an afternoon pass of NOAA 20 there are now NUCAPS soundings over our active area of MAF and SJT. Looking at the non-modified and modified soundings there are several different things to note. On the image below the raw NUCAPS sounding is on the left and the Modified is on the Right. From this view it may be hard to see the differences, but a few are listed below.
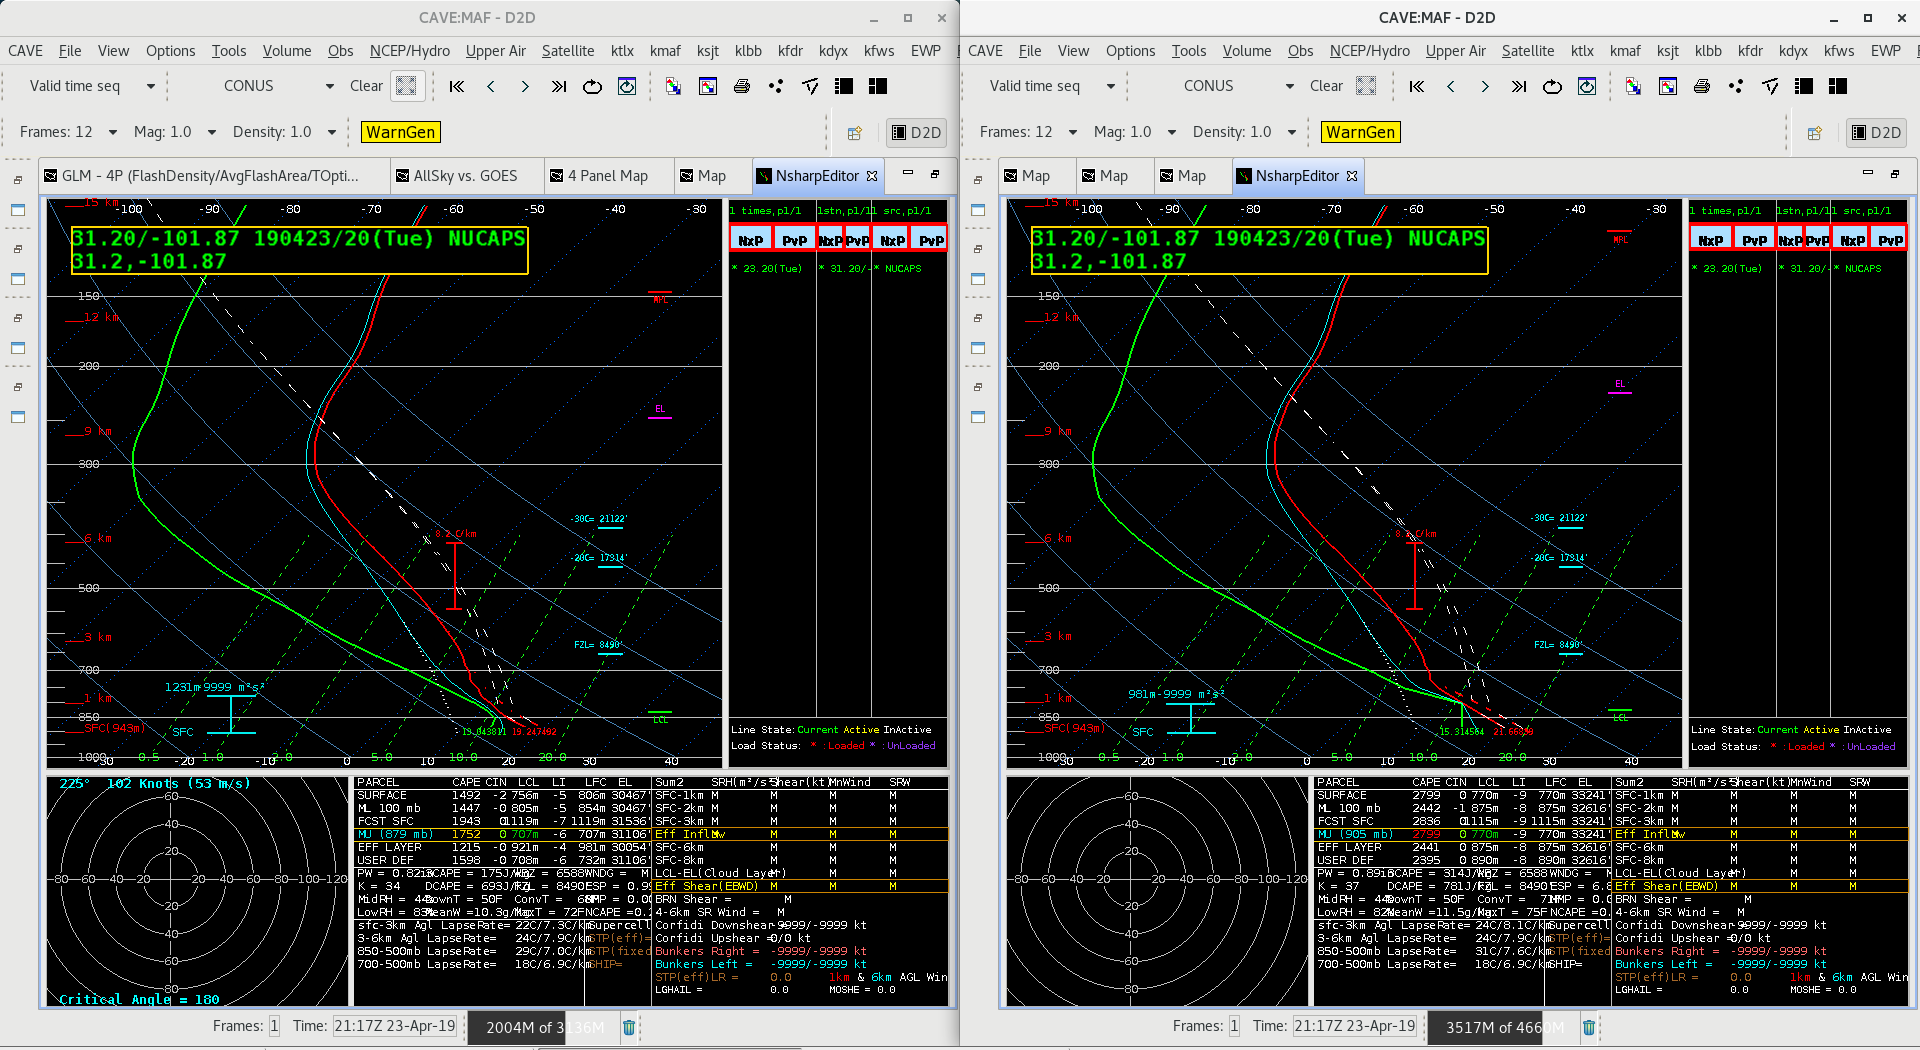
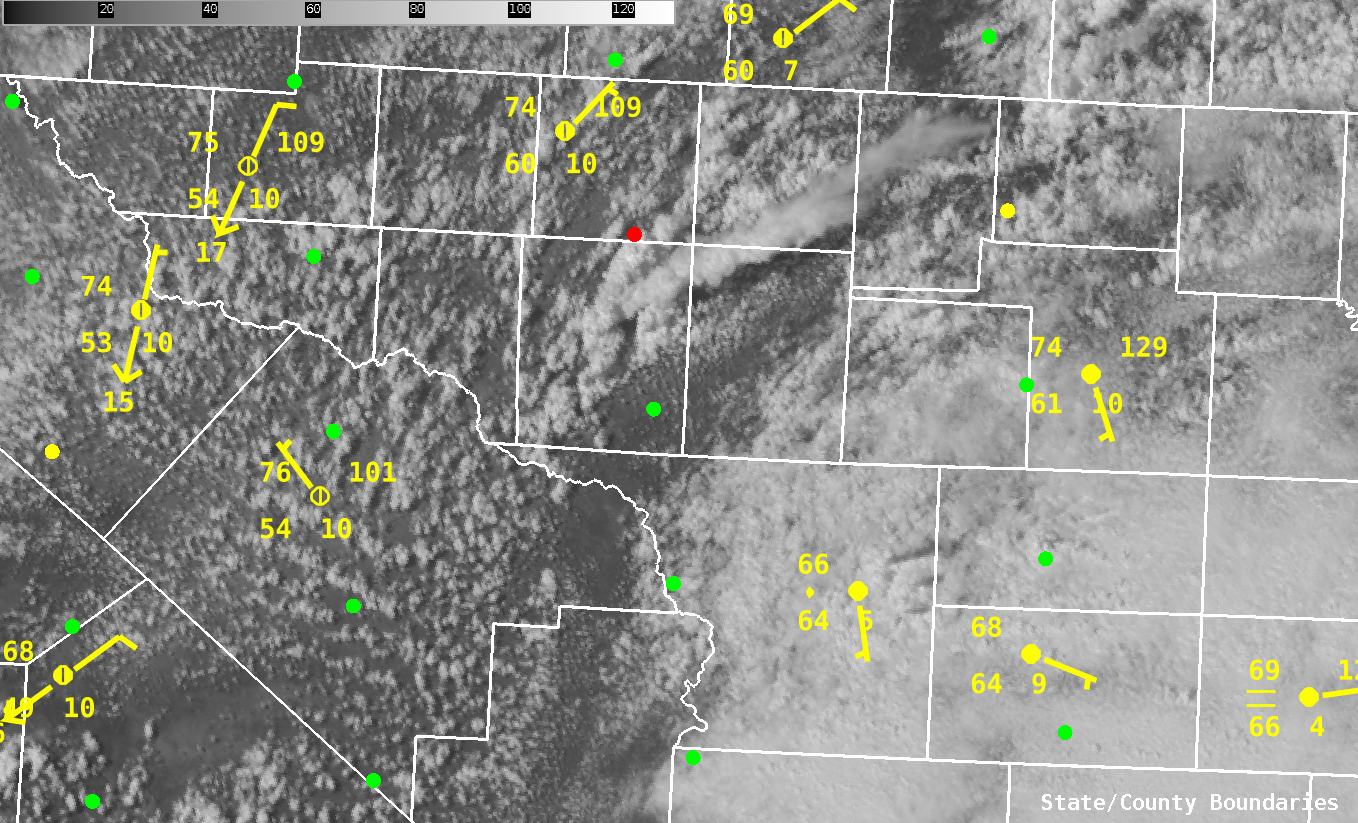
- Based on the location of the sounding and the surface observations (the location is the green dot just south of the red dot in the image below) the modified sounding DOES DO A GOOD JOB at the surface. The Modified Sounding has T=71 and Td=60. The non-modified sounding shows T=67 and Td=55. Looking at the surface observations below the modified sounding is more reasonable with Td around 60 and temps in the upper 60s and lower 70s.
- Just above the surface though there is some questionable signatures. First it appears the modified sounding assumes that there was a cloud deck around 1km (T and Td almost the same). This is questionable as the visible satellite below does show more clear skies around the point. As that point is right along the front there has been mostly clear skies near that point. How it handles these parts of the mixed layer are more questionable.
- These differences to make a BIG difference in the severe weather environment. Most notably CAPE. If you look at the surface CAPE it goes from 1492 in the non-modified to 2799 in the modified. That is significant, especially when these supercells are producing hail. There has been a 2.5 inch hail report to the east of this dot location, which does lend itself to pointing towards larger hail.
-Alexander T.
SJT SVR #1 update #1
Hail prob severe jumped to 99%, with MESH around 2.5″. This, coupled with classic large hail signatures in the base data, prompted a SVS with a larger hail size indicated.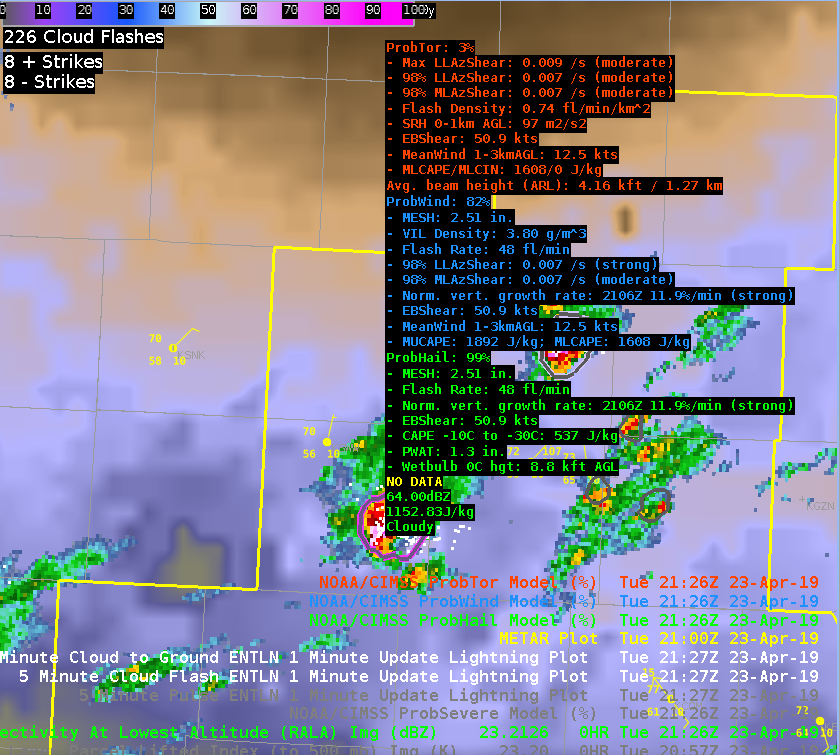 Sandor Clegane
SJT SVR #2
Both storms in the middle portion of the screen very quickly showed low min flash area (MFA), again bringing my attention to those storms. The northern most storm quickly developed classic hail signatures prompting a warning. The southern storm quickly fell apart. Sandor Clegane
SJT SVR #1
GLM minimum flash area (bottom left) rapidly fell from ~1600 km^2 to 72 km^2 over a period of 5 minutes in the storm in the NE portions of these images. Maximum Total Optical Energy (TOE) topped out at 228 fJ shortly after the second image below. 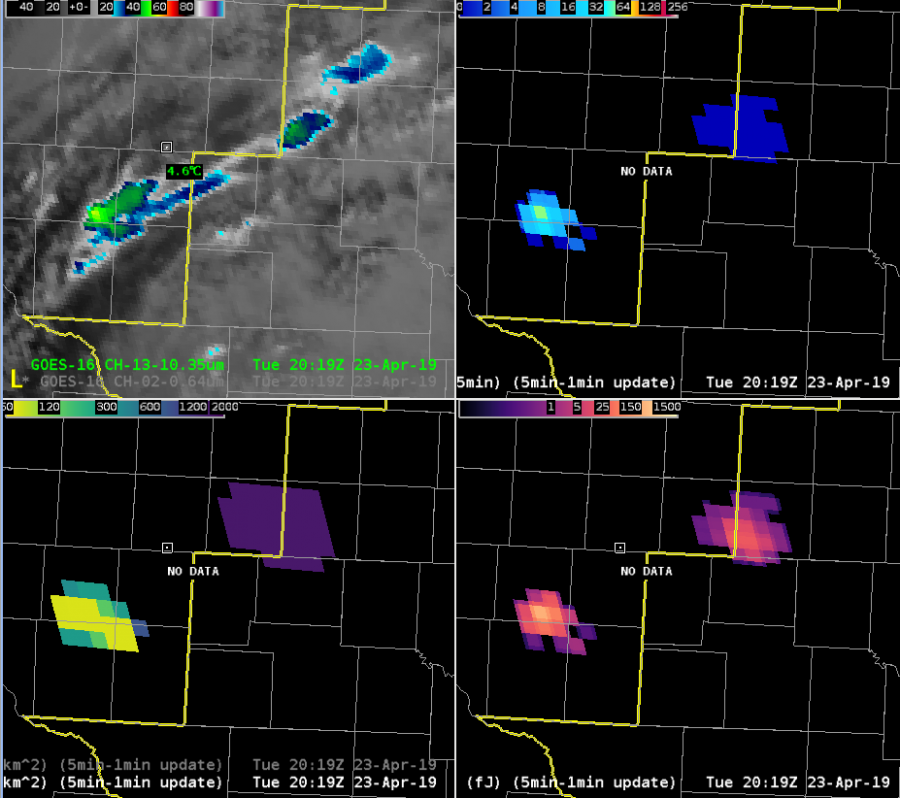
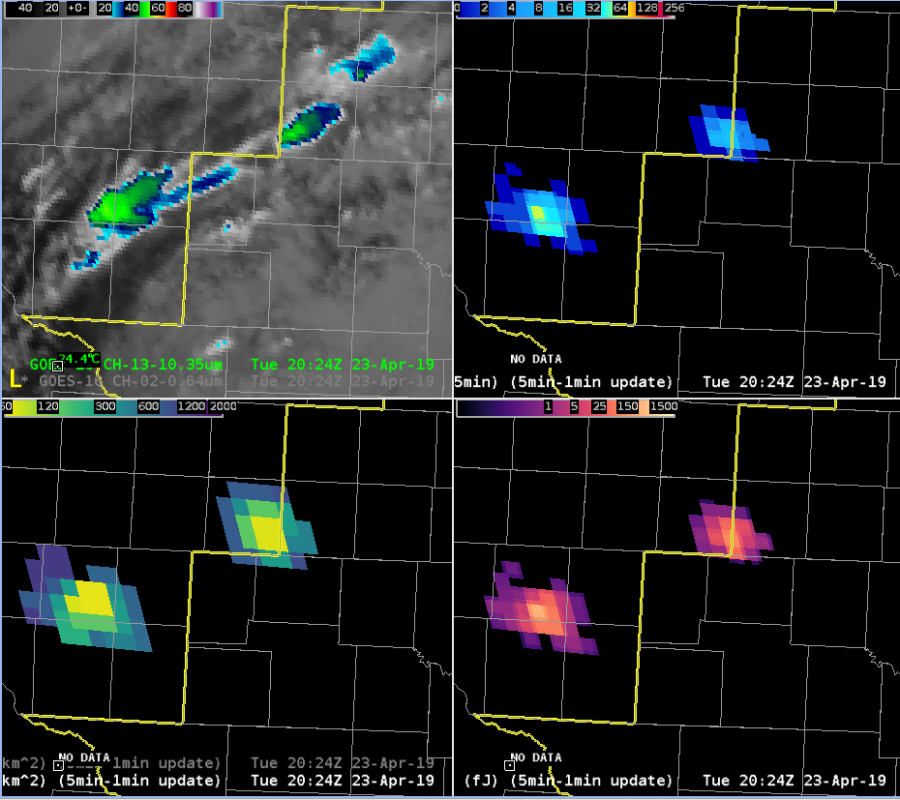 5 minutes later, this storm began displaying classic hail signatures in all-tilts base radar data, prompting a severe thunderstorm warning. I will note that several other storms displayed similar minimum flash area decreases without so quickly turning severe, but the rapid decrease was the first thing that brought attention to this storm.
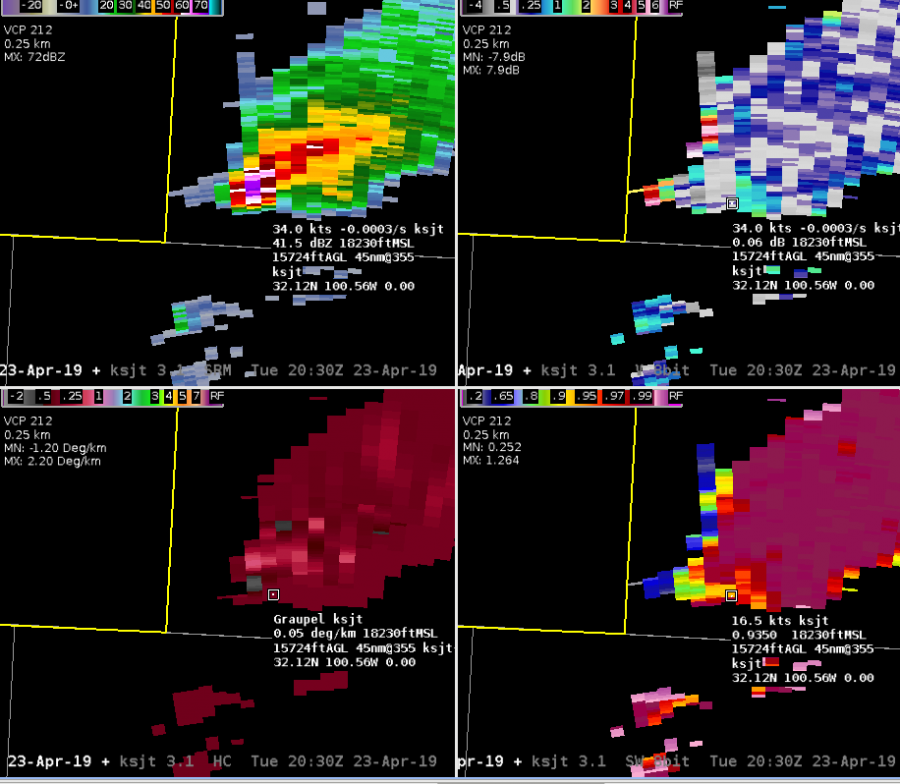
Severe hail very likely occurred shortly after the warning decision. Shortly thereafter, Max TOE fell off fairly dramatically, to around 50 fj by the end of this loop. However, the difference between the pre and post severe max TOE does not show up well with the default color curve.
Sandor Clegane
Minimum Flash Area: Capturing the “Pulse”
Taking a look at the Minimum Flash Area (MFA) product (part of the GLM suite) and comparing it to the Average Flash Area (AFA), my initial analysis leads me to think that there’s more value in the MFA as opposed to the AFA. The MFA, when watching the evolution of a storm in the far northeastern part of SJT’s CWA, shows the pulsiness rather well. The AFA, in comparison, had a washed-out look during the 19Z hour of analysis. I had a side-by-side of the meso-sector VIS satellite imagery with the MFA on top (1-min.) and the ProbSevere suite with radar products, including reflectivity (GIFs below). The MFA provided a few minute lead time over the ProbSevere and reflectivity products of the storm pulsing up. Thought: watching the trend of the MFA could provide some insight into the overall nature of the storm. In this particular case, the smaller flashes were consistent for several frames/minutes, and the ProbSevere/reflectivity core showed an uptick shortly thereafter. Because the smaller flashes remained confined to a smaller area/grid box (<72km^2), this indicated to me that this storm would remain pulsy and likely either sub-severe or low-end severe. Taking a look at what WFO SJT issued during this hour indicated to me that this thought process likely held true. From a mesoanalyst perspective, this could prove to be invaluable information to provide to a radar operator.
~Gritty