
In the below GIF from Top Left to Bottom Right you have:
- GLM Flash Extent Density from GOES-16 (East) and GOES-17 (West)
- GLM Average Flash Area from GOES-16 (East) and GOES-17 (West)
- GLM Total Optical Energy from GOES-16 (East) and GOES-17 (West)
- ENTLN Ground Based Lightning Detection and GOES-16 1 Minute Channel 2 Visible Satellite.
The animation shows the quick pulse life cycle of the storm – you can watch the updraft grow and then the anvil get sheared off of the storm in the visible satellite. The Flash Density and the Optical Energy show a quick uptick and GLM registers at the same moment the first ground indication shows up. The Optical Energy maxes out as the storm grows to its tallest before the top gets sheared off. The Flash Density seems to follow the progression of the updraft eastward as well. The smallest Average Flash Area also follow the ‘newest’ and/or ‘growing’ parts of the storm. While convection continues from the cell (it is sitting along a boundary across the SE Part of MAF’s CWA), it does weaken (looks like lower tops in visible – could certainly check this in other ways) and you use lightning from all networks.
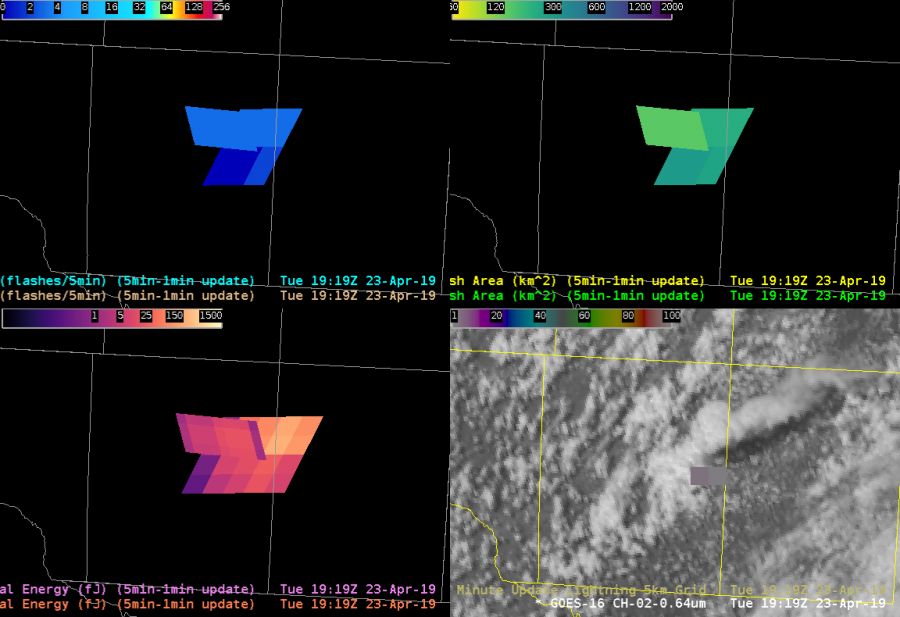
While there is nothing ground breaking here it does show how GLM handles pulse convection and the trends in the GLM data. The one downside that I would note here is the lack of some sort of downtrend before the storm weakens. It seems the data generally peaks then goes away rather than drops before the storm dies. It is important to note that the coverage of the various products did gradually decrease (went from several pixels, to two, then none) as the storm weakened.
-Alexander T.