AzShear showing signs of rotation just before TVS appears

No dissipating today! Probably because this case already happened…

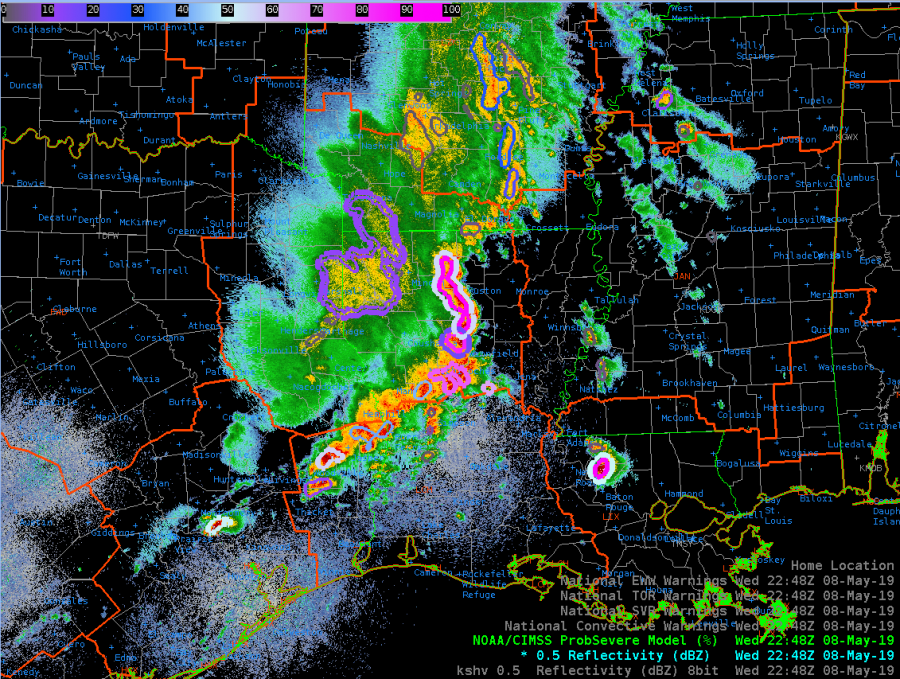
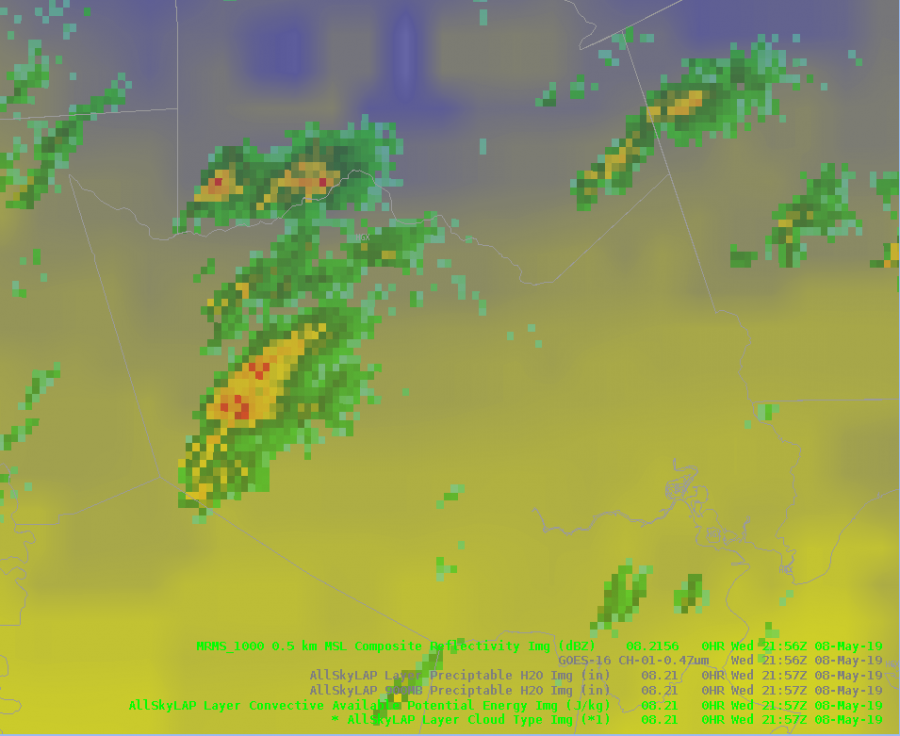
Starting out with the AzShear case study, I can already see some of the lead time AzShear can help bring to some of these warnings. On this day, given environmental parameters, it wouldn’t take much to issue a warning with these storms. Even then AzShear help highlight potential areas of rotation where the radar velocity field looked primarily convergent.

2200Z:

2201Z:

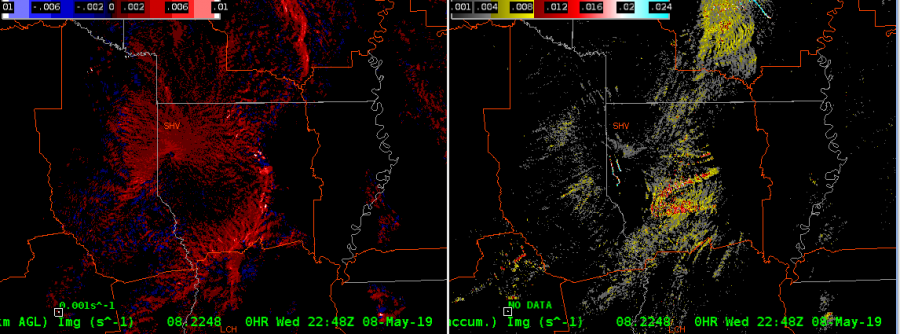
2203Z: Now the radar velocity field is showing more signs of a potential TS.

2204Z: Thank goodness for SAILS3! Boom,  AzShear lights up like a Christmas tree with a partial TVS (inbound velocities are a bit wonky)

With the AzShear, lead time may have been increased by about 3-4 minutes if you were waiting for a rotational signature before issuance

#ProtectAndDissipate

Increasing trend in Prob Severe products

Between 1840Z and 1844Z, the ProbWind increased from an already high level of 85% to 84% as a bowing segment developed and moved into northern Brazos and Madison Counties.  Also of small note, ProbHail increased from 15% to 29%, and ProbTor increased from 17% to 20%.


ZDR_Arcophile


Minimum Flash Area Shows all the Features

As we move towards sunset, the MCS continues to munch across the southeast Tejas, Louisiana, and portions of Arkansas.  There is alos a strong storm developing ahead of the MCS in SE Louisiana.  Add in some storms across Northwest OK and there is whole spectrum of flash sizes is showing up now:

What is neat about this image is that the small flashes (purple) are concentrated near the overshooting tops of the storms.  The  large area flashes (red to white) are in the trailing stratiform area.

One other cool tidbit I just saw in this loop; watch the southwestern part of the line where a storm weakens and dissipates; flash area basically shows that all electrical activity ceases along with the storm.  Looking closer:

-Dusty

Using ProbSevere Time Series for Situational Awareness

A particular storm in the CWA, which had previously been quite strong, had weakened and I diverted my attention elsewhere. However, I kept the ProbSevere Time Series displayed on another monitor. Later, I noticed that the Time Series indicated that the storm was potentially re-intensifying  (top left image) and it caused me to direct my attention back to the thunderstorm.

The Life and Death of a Gulf Storm Through the Eyes of Experimental Products

In this case of a rapidly developing storm, GLM data was leaned on to issue a SVR Warning on what otherwise may have been a marginal storm. AllSkyLAP showed the storm was developing in an area of MLCAPE values over 2000 J/kg, and ProbWind model had rapidly increased to ~50%. GOES-16 1-minute imagery showed rapidly cooling cloud tops, with a sharp increase in lightning activity. Given GLM values comparable to other severe storms on the day a SVR warning was placed on the storm. The warning was sent out relatively early to try to capitalize on lead time.


Radar w/ ProbSevere:

IR-Sandwich:

Flash Event Density:

Minimum Flash Area:

Event Density:

Total Optical Energy (too fast, whoops!):

AllSkyLAP CAPE:

ProbWind Model Increase:


UPDATE: Shortly after warning on the storm, it completely fell apart after failing to become rooted in the boundary layer and all indicators (i.e., ProbSevere, GLM imagry) dropped to null. Initial warning was shamefully cancelled.

Really living up up to my name!


Radar w/ProbSevere:

Flash Event Density:

ProbWind Model Increase:


#ProtectAndDissipate


Rotation Tracks in a QLCS

In today’s case, MRMS rotation tracks did a better job at showing where the most likely tornadic storms were in a QLCS compared to the 0-2 km merged AzShear, at least over the entire period which makes sense. I would never warn just based on rotation tracks, but I couldn’t find a better SA tool today. It was easy to step back in after working way too long on a previous blog post and get an idea of what happened while I was away. I still feel like the single-radar AzShear would have been extremely useful with today’s QLCS.

Six Hours Later – Same Surging in All-Sky LAP TPW

At 2127 and 2157 UTC on 8 May (exactly six hours after it was previously noted), a surge in TPW in a cloudy region (Northeast TX region).  This might be a predictable behavior in All-Sky LAP and points to improvement needed in how it handles new model cycles.  Similar jump behavior was noted in All-Sky LAP CAPE.

2127 UTC                                                                                                                     2157 UTC


JohnF.