Lead Time Galore w/ AzShear

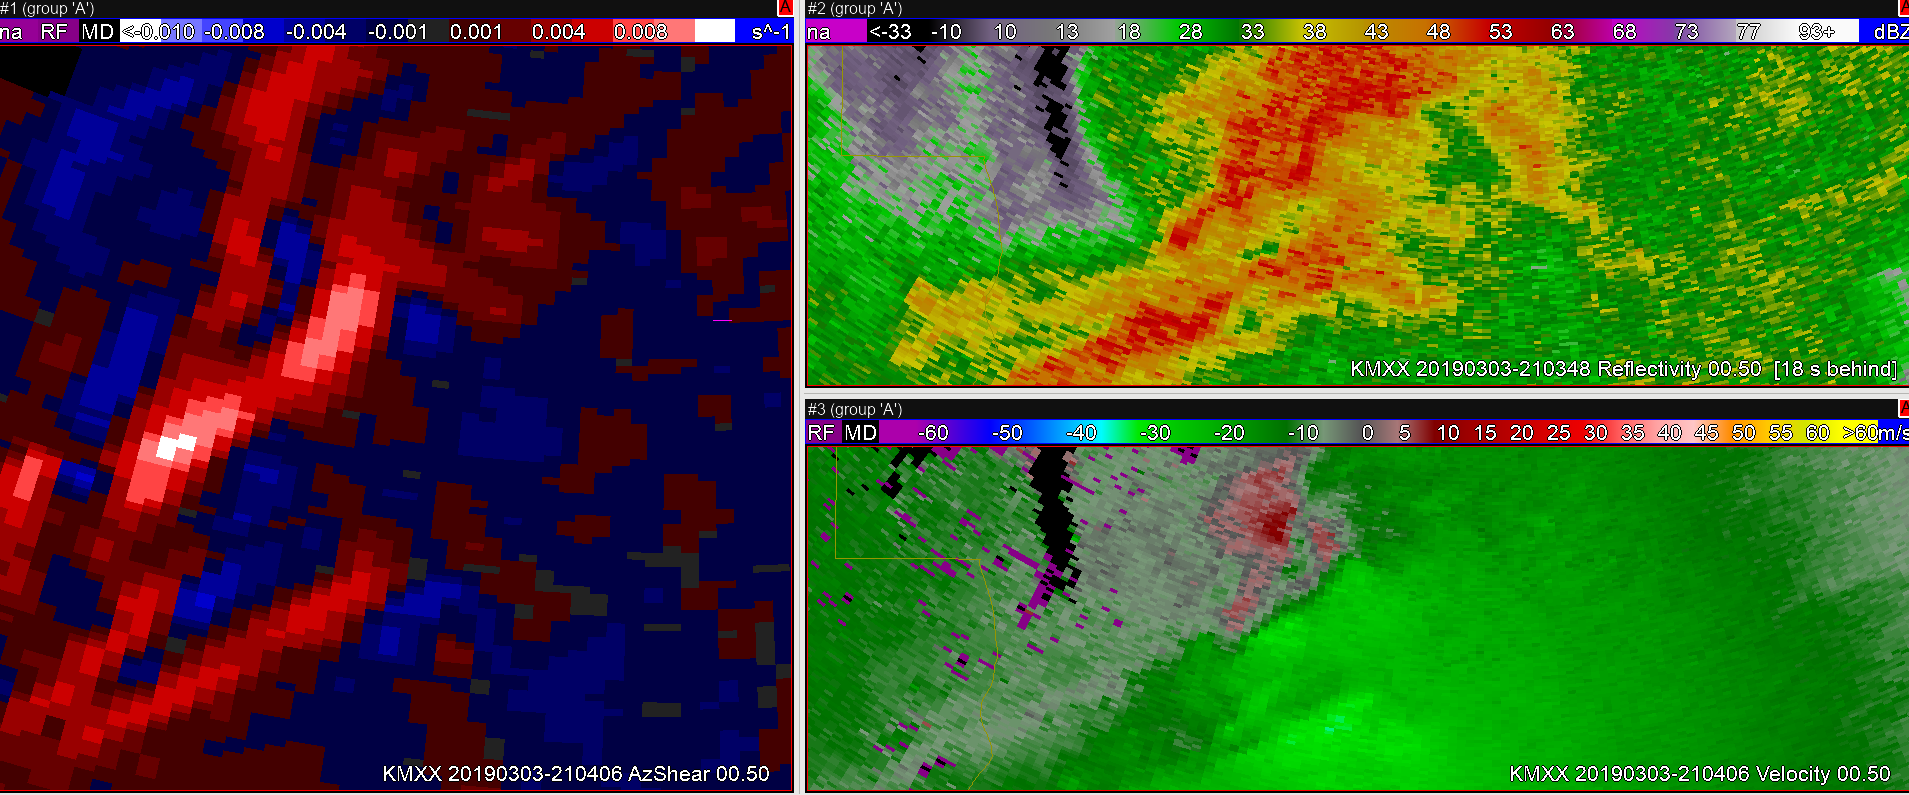
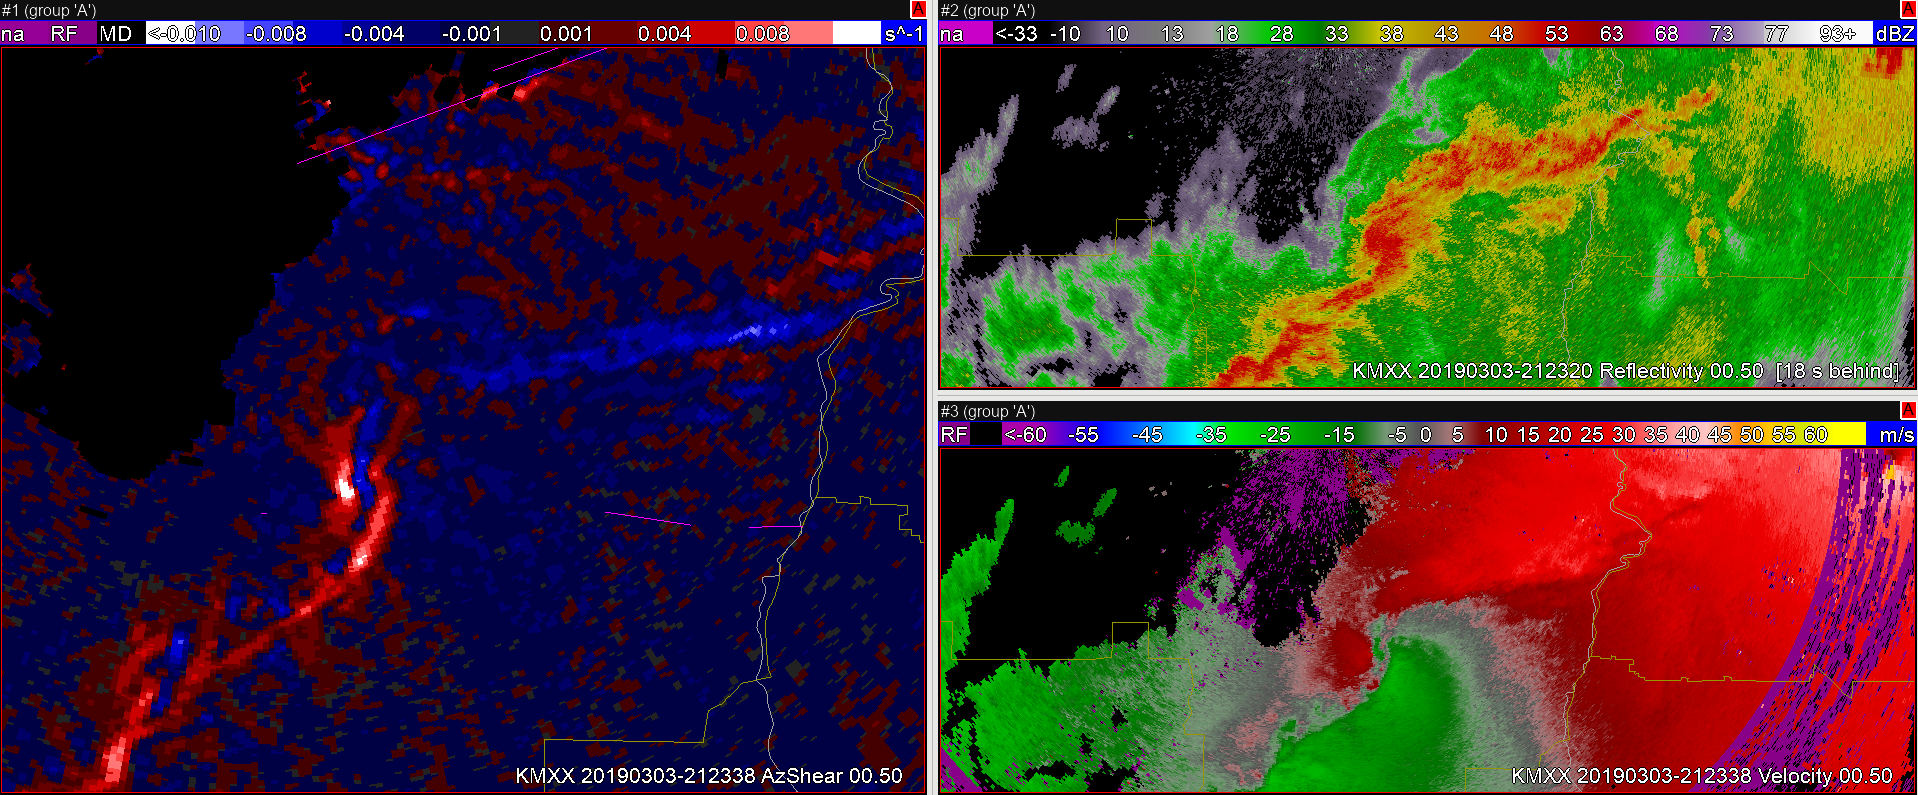
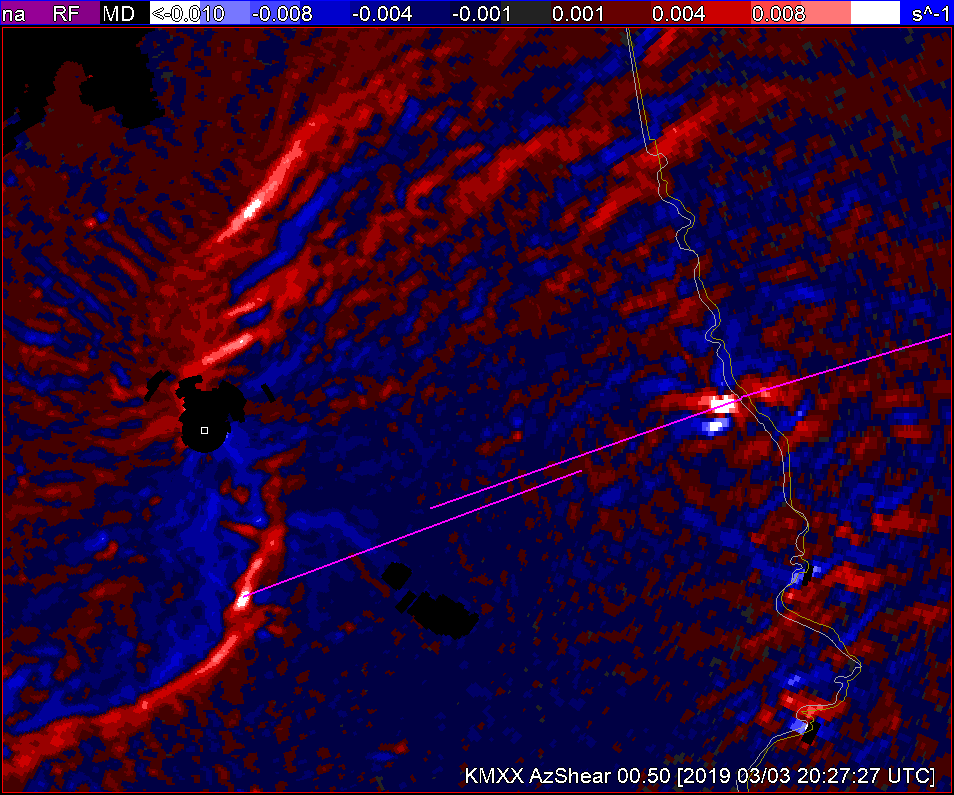
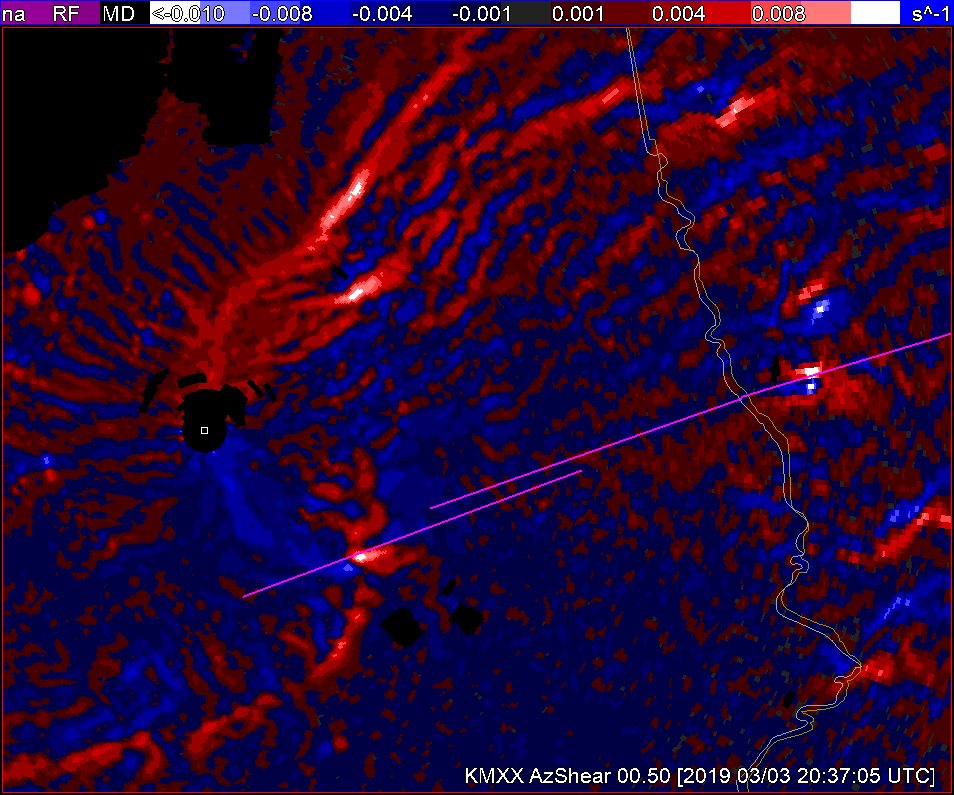
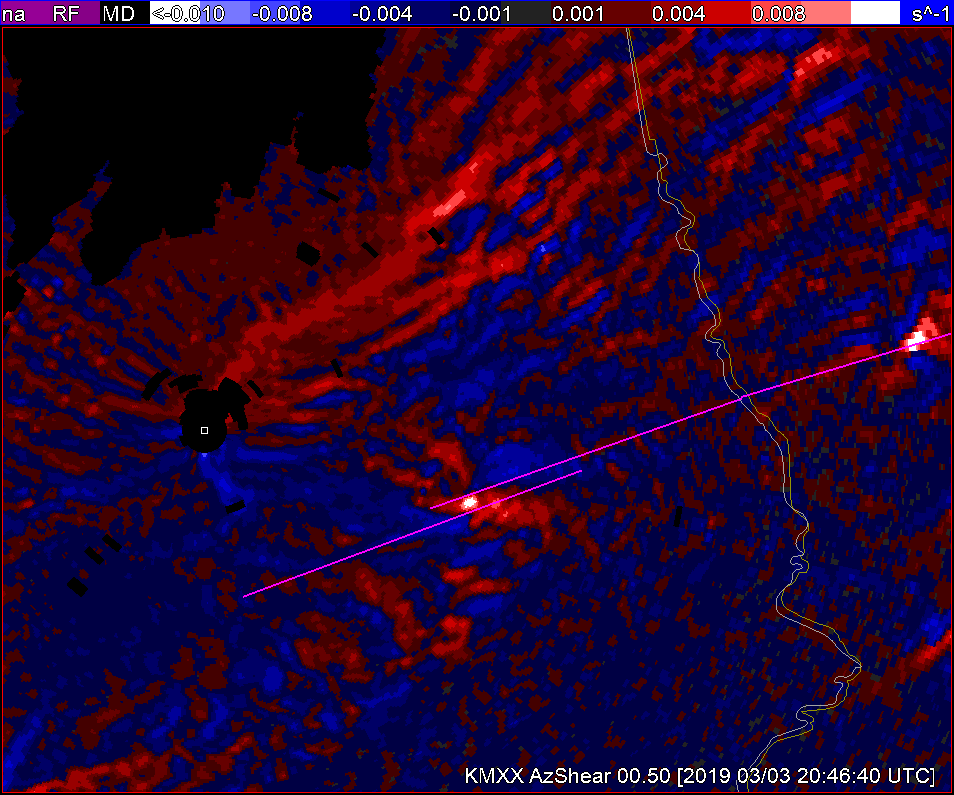
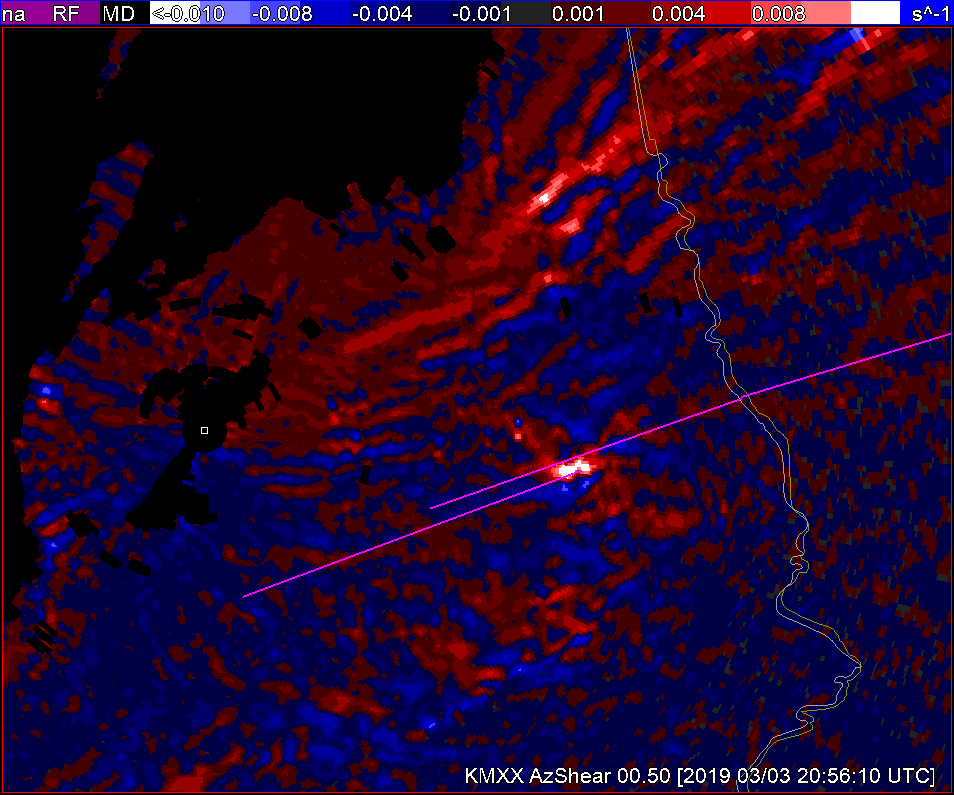
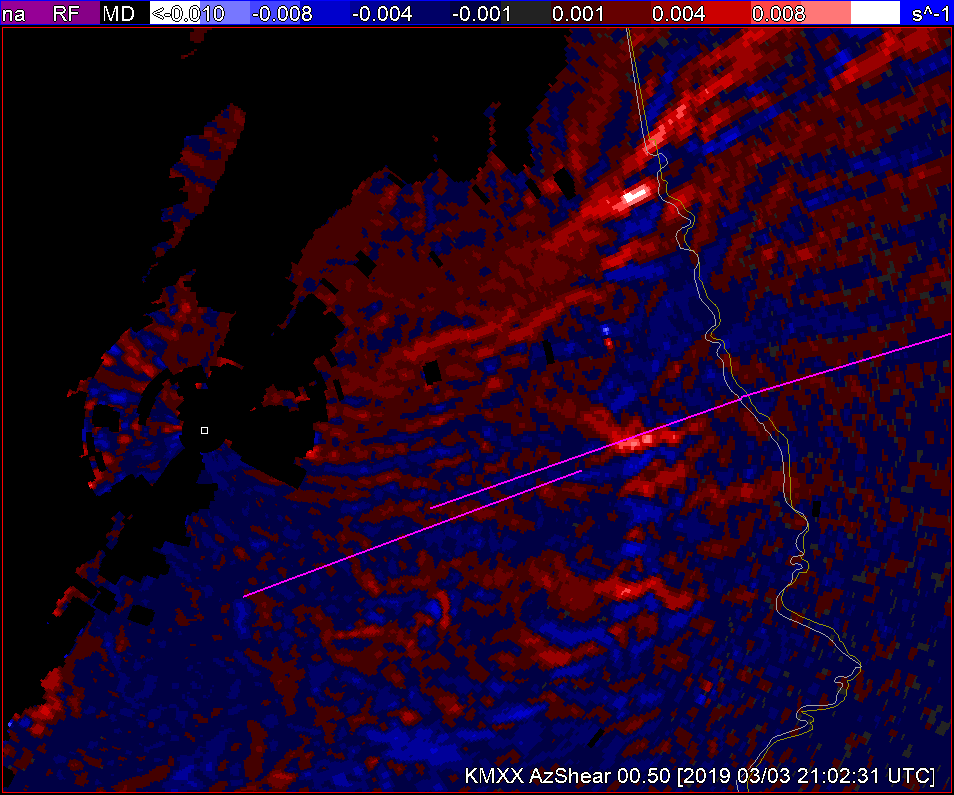
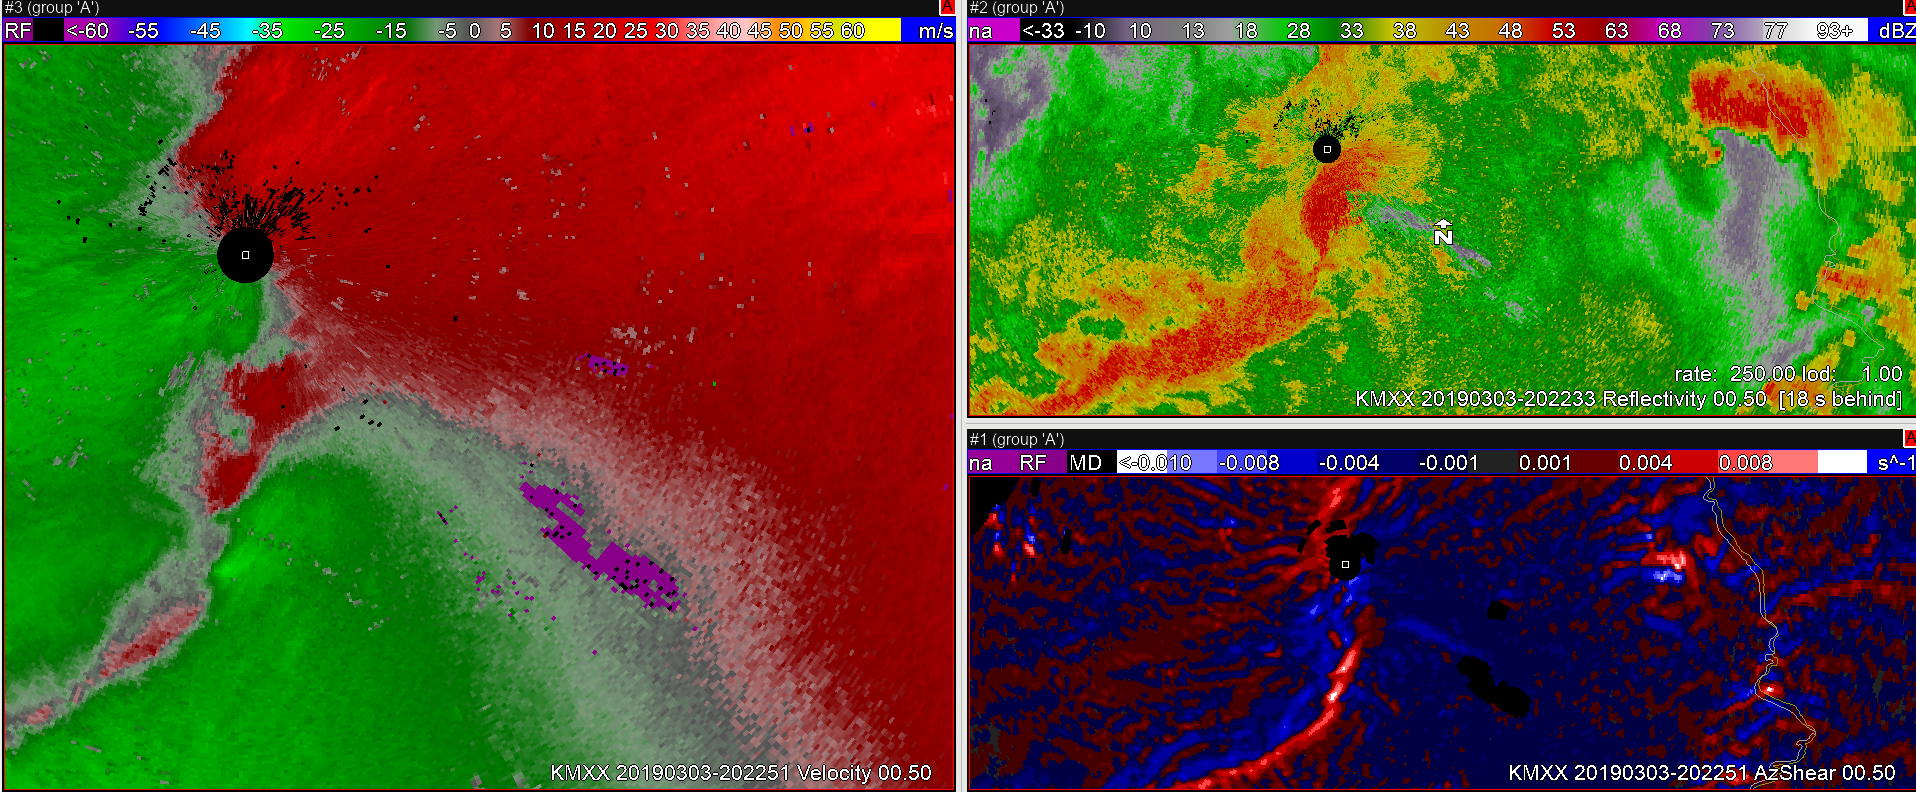
I continue to be impressed with the POD with AzShear. It’s FAR may be a bitter higher but is probably better than many offices, from what I’ve seen. I think it has a good application for lead time improvement. Take this example of tornadogenesis shown below…

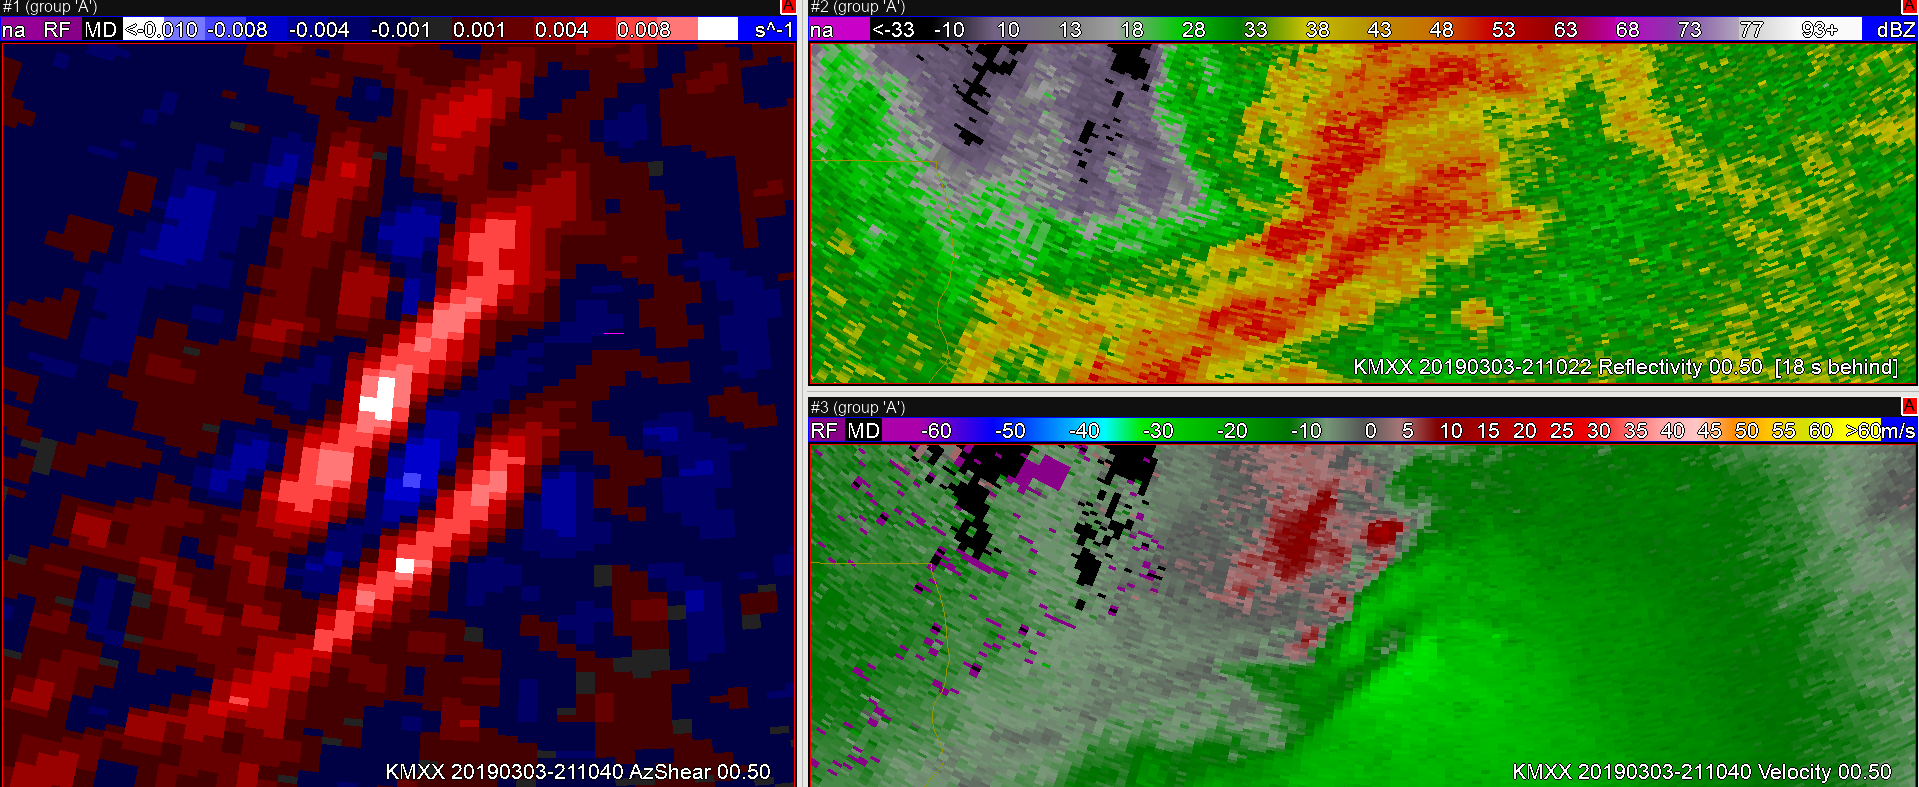
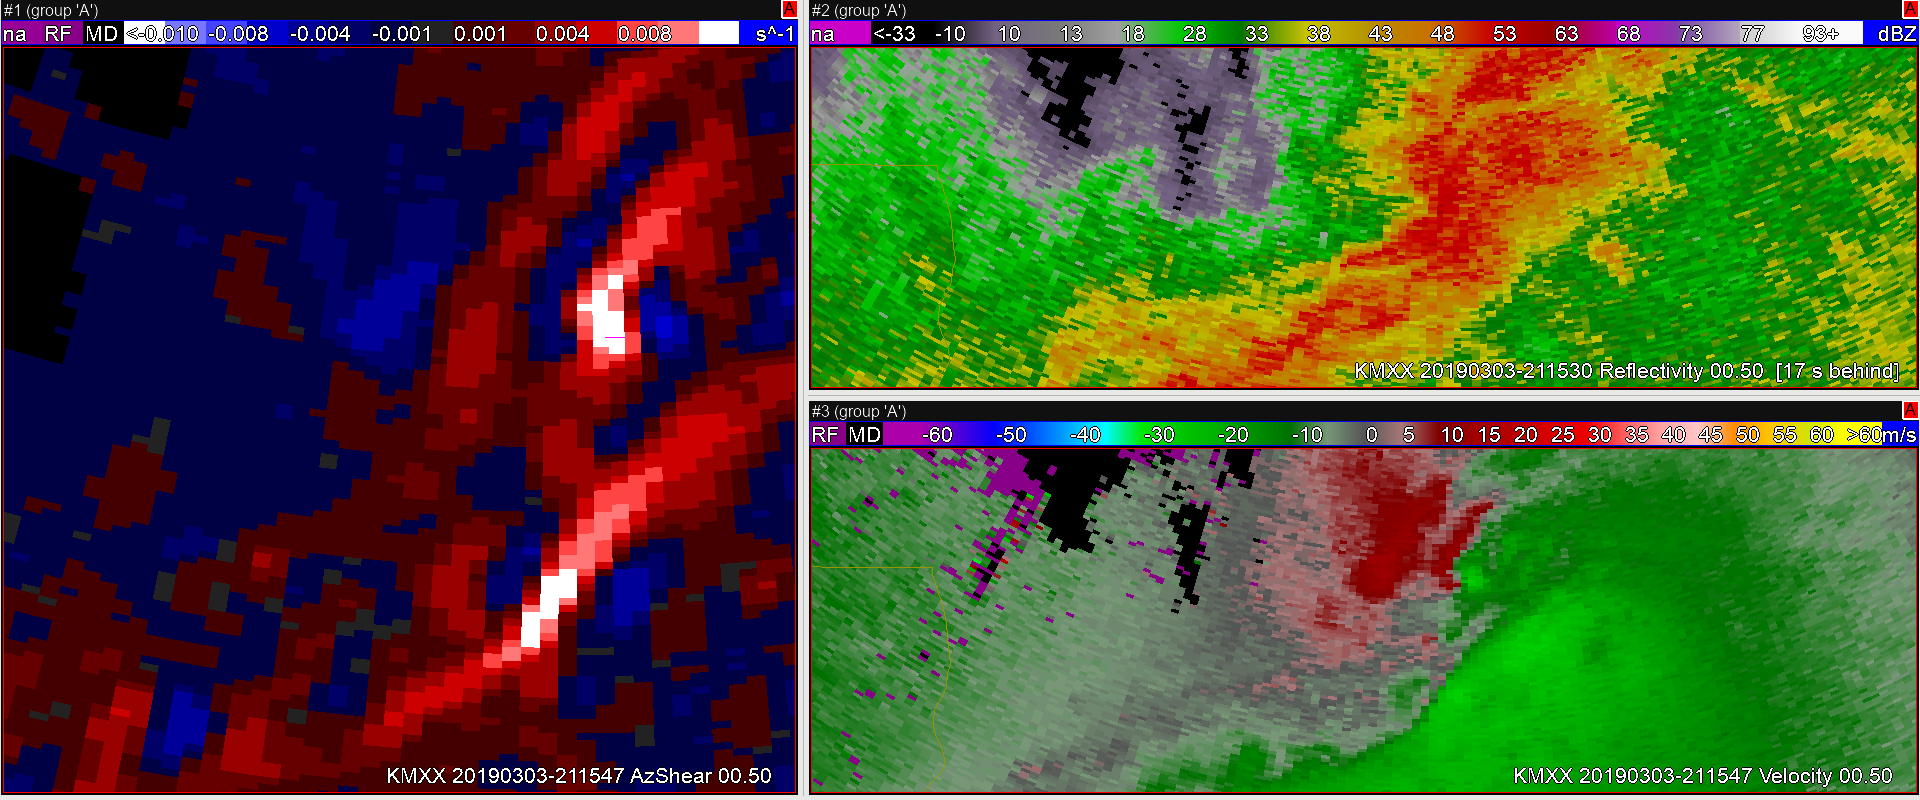
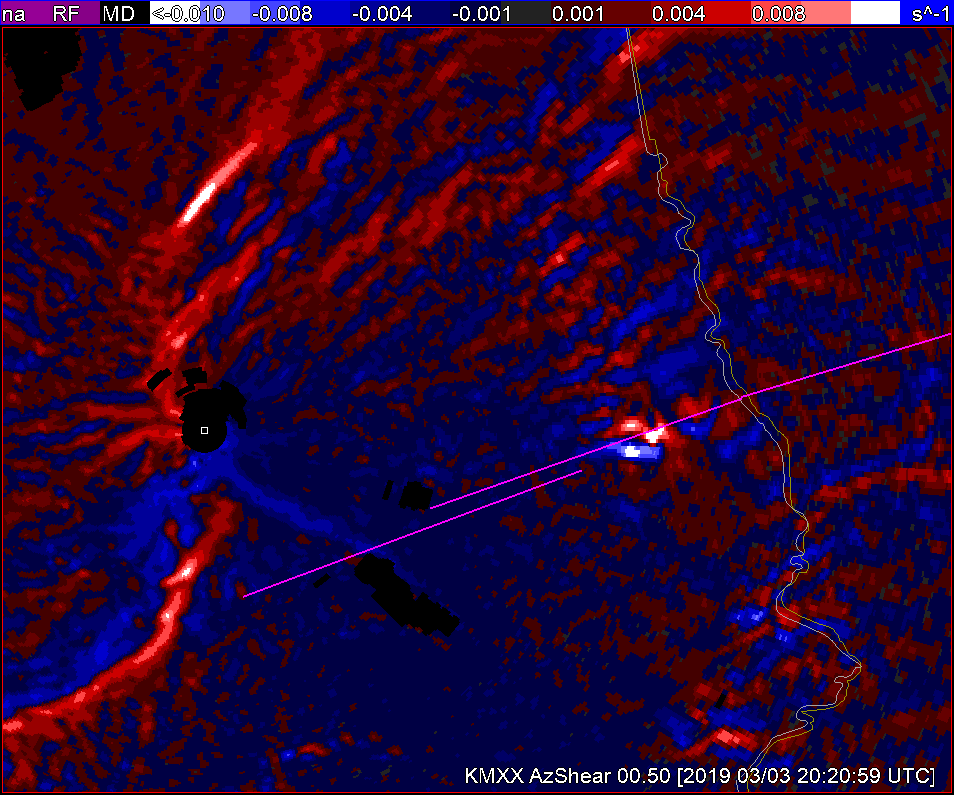
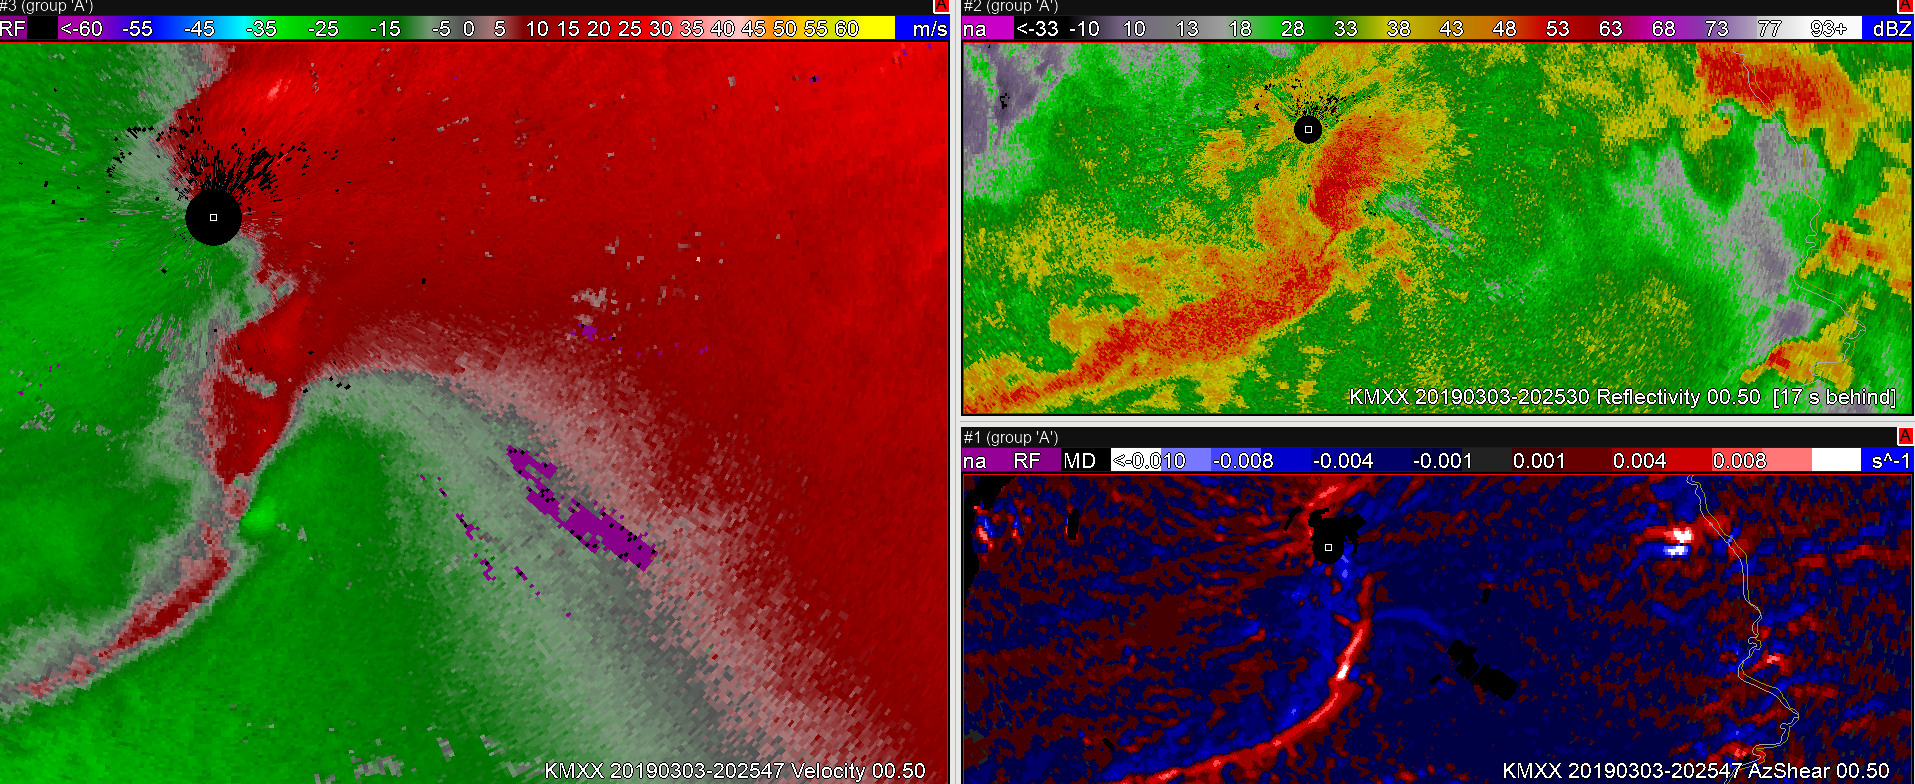
You can track the ‘object’ of the maximum localized AzShear signature from genesis (at 2145 UTC) back around 20-25 minutes! (at 2122 UTC, depending on a subjective start time)…

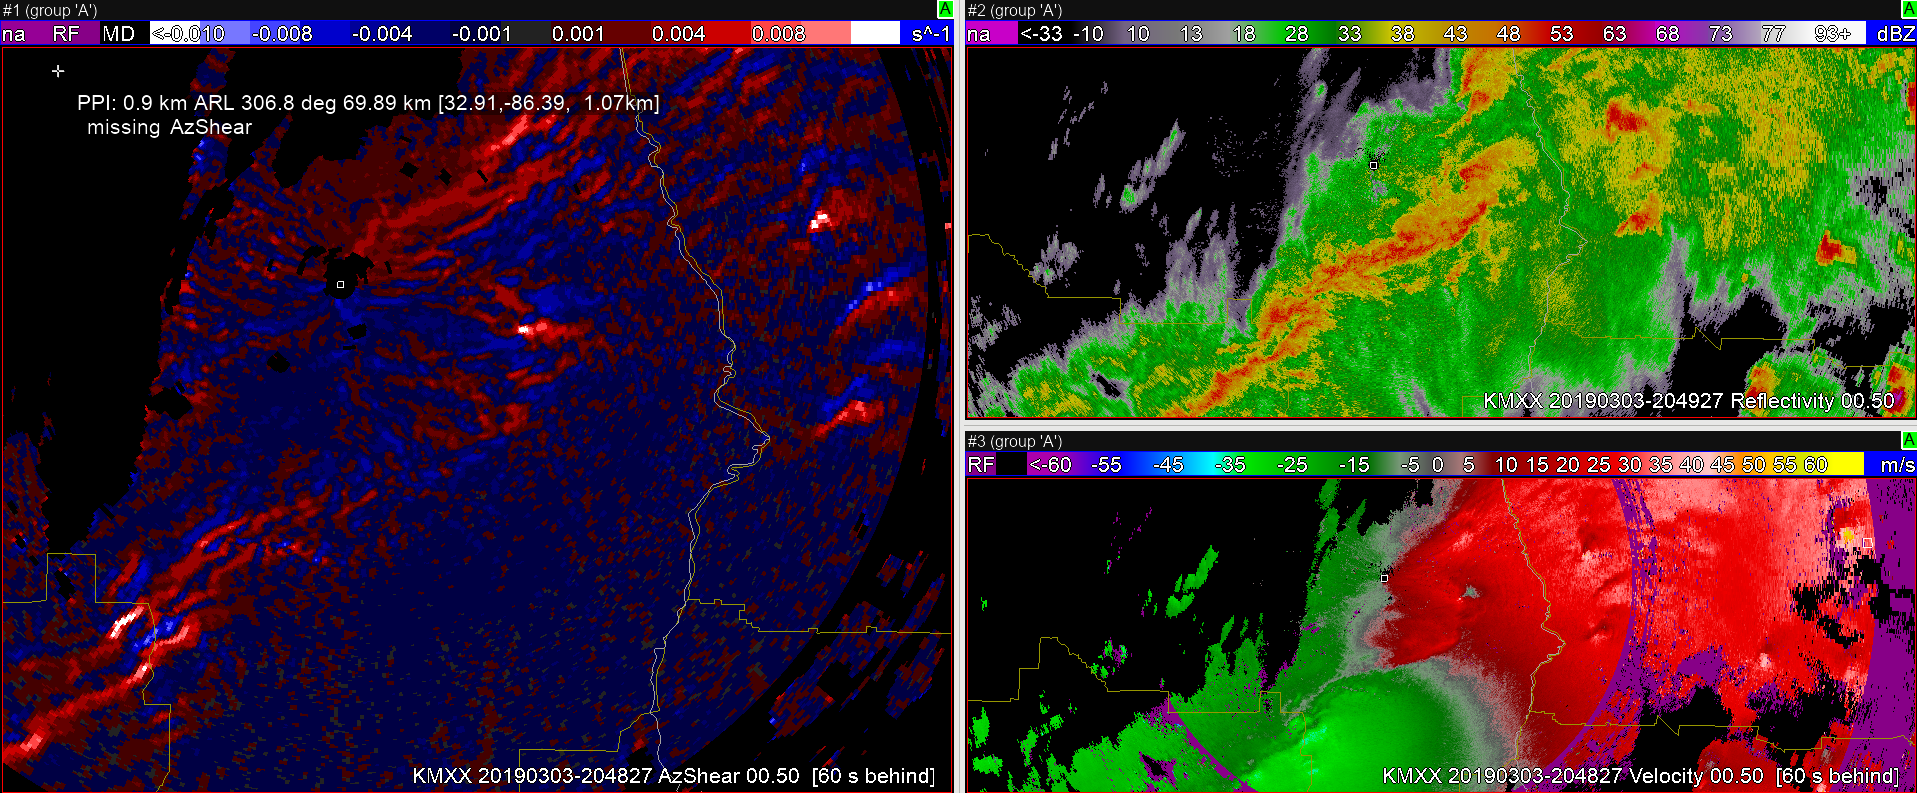
While I would expect these AzShear Hot Spots (trademarked, but I’ll let you use it) to be perfect, so far in these marginal cases, it seems to perform fairly well.

#ProtectAndDissipate


All Sky CAPE dropout between time steps

I would like to be able to load ALL-Sky LAP Data Type and CAPE on top of radar data. An unfortunate annoyance is that if the time stamp is too far from the radar product time stamp, the All-Sky products completely disappear,  and in fact, if too far away, it won’t load at all. I would like the ability for the latest All-Sky products to display, despite the time lags between the the two. In other words, I would rather have the latest “old” data from All-Sky rather than display nothing.

ZDR_Arcophile


AzShear shows increasing vorticity along a gust front resulting in a weak, brief tornado

In this case, a weak brief tornado was formed along a QLCS. These are typically the hardest tornadoes to warn upon given their limited impacts, but there are usually storm structures that can be identified within the radial Velocity fields than can give some indication to formation. In this case a convergent vorticity signature can be spotted in the KMXX velocity field, at this time AzShear begins to increase as well.

Later AzShear, continues to show a signature of increased vorticity along the gust front.

Finally, genesis. TaaDaa!

The AzShear threshold, continues to be met well after the tornado dissipates. So it’s not the perfect tornado indicator. However, the velocity field looks as if tornado potential could still be possible, and as a forecaster I would probably hold onto the warning regardless (especially given previous long track tors and guidance).

#ProtectAndDissipate


Downward Trend in ProbSevere Time Series & GLM Results in Warning Cancellation

A noted downward trend in the ProbSevere Time series along with a downward trend in the GLM products (not pictured) resulted in this warning forecaster to cancel a SVR for Kerr County early. This early cancellation may not have occurred had these products not been available, potentially leading to areas being unnecessarily warned for a longer amount of time.


Comparison of ATPW and Blended TPW

I was finally able to take a look the ATPW (top left) and compare it with the operational blended TPW (top right). My first impression was that both products show similar large scale patterns with a large plume of moisture extending from the Gulf of Mexico into the Ohio River Valley. The ATPW also tends to show a little more detail in the moisture field compared to the blended TPW.

At 15Z ATPW shows an area of lower moisture over the Texas Gulf coast which is sort of fills in by 17Z, likely due to upstream moisture being advected into the area. In contrast, this moisture is continuously present in the blended TPW. ATPW generally had PWATs around 1.5 in, while the blended TPW had PWATs around 1.7-1.8 in. In contrast, 12Z RAOBs along the coast had PWATs that ranged from 1.6 inches at KBRO to around 1.8 at KLCH. These values seems to match better with the blended TPW product. I suspect that the upstream convection over Louisiana and lingering clouds over the coast impacted the ATPW that was corrected in the blended TPW.

Update…Below is a loop of the LAP All Sky T PW. This loop shows a similar pattern to the ATPW and Blended TPW with a large are of gulf moisture moving into the Ohio River Valley. It is interesting/good to see that the LAP All Sky TPW is picked up on the sea breeze kicking in along the Gulf Coast. Despite the subtle differences among the three products the fact that they show similar patterns gives increase confidences that we will likely see a large area of flash flooding across portions of the south if storms are able to develop.

HWT Issues SVR 3-Min Before Field Office Does Due to GLM & ProbSevere Data

A strengthening thunderstorm in Val Verde County was noted by Prob Severe and GLM data. The Average Flash Area and Minimum Flash Area values quickly increased in the area of a strengthening updraft across Val Verde County. The combination of these factors, along with a noted uptick in ProbSevere  data, prompted the HWT warning forecaster to issue a SVR for Val Verde County at 1:25pm CDT with WFO EWX issuing a SVR for Val Verde at 1:28pm CDT.

A Tail of Three AzShear Hot Spots

At 2049Z, AzShear is showing 3 “hot spots”. It still continues to pick out the two tornadoes to the east fairly well, but is also showing an increased signature to the WSW which doesn’t appear to be materializing.

#ProtectAndDissipate