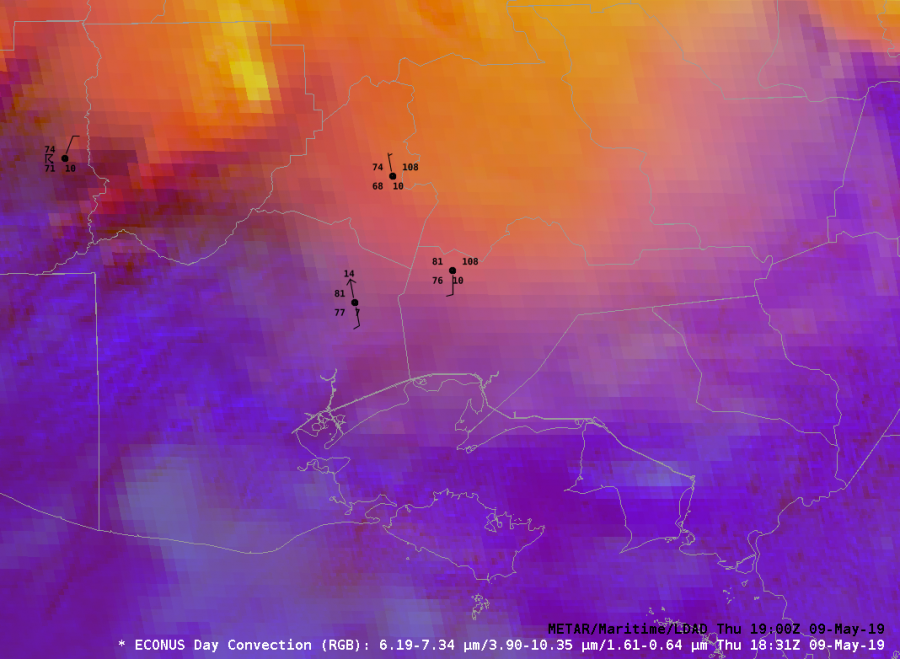
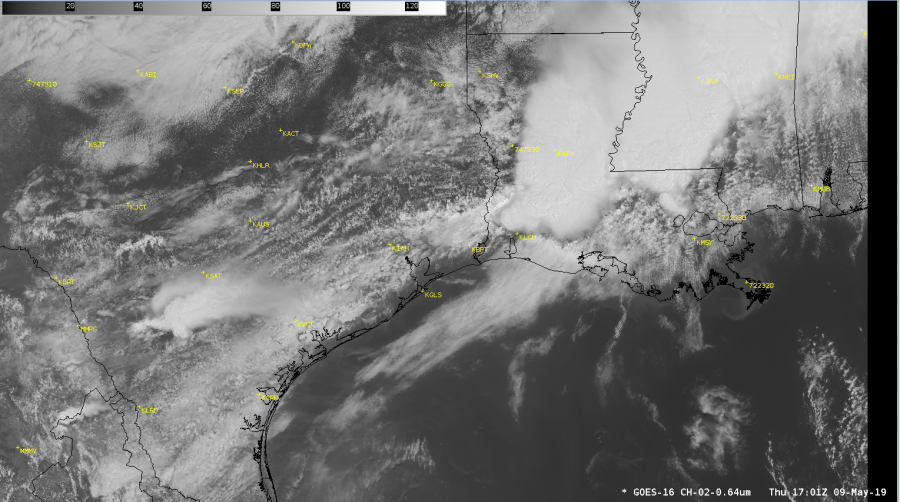
Two hours in and we are STILLLLLL waiting for convection to fire in the KHGX CWA. Front is stalled across the northern quarter of the CWA and the sea breeze has pushed inland from the southeast. Come on storms…really?
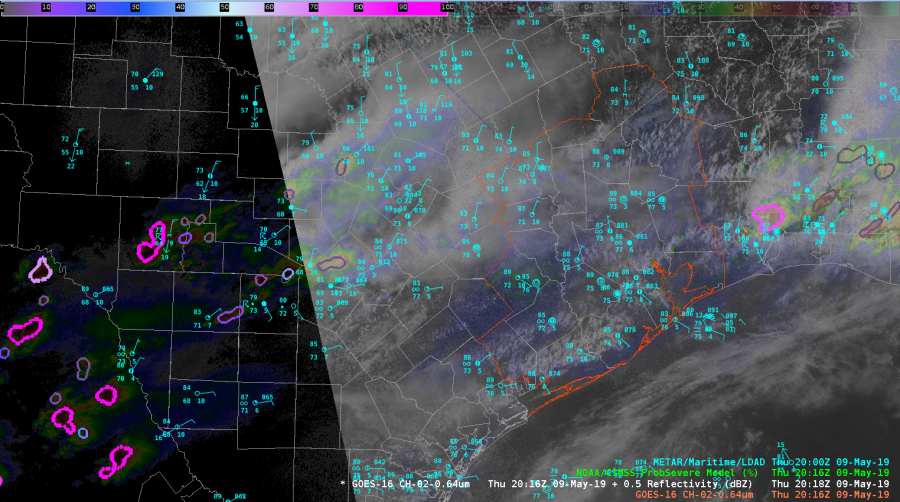
O.K., why no convection? KLCH launched a sounding at 17Z which looked like this from GOES-E (why this is important in a bit):
Congrats to Lake Charles getting a special sounding off before those storms arrived! This is what the lowest half of the sounding looked like with boundary layer conditions guessed from the near the center of Houston’s CWA at KTME (Houston Executive Airport):
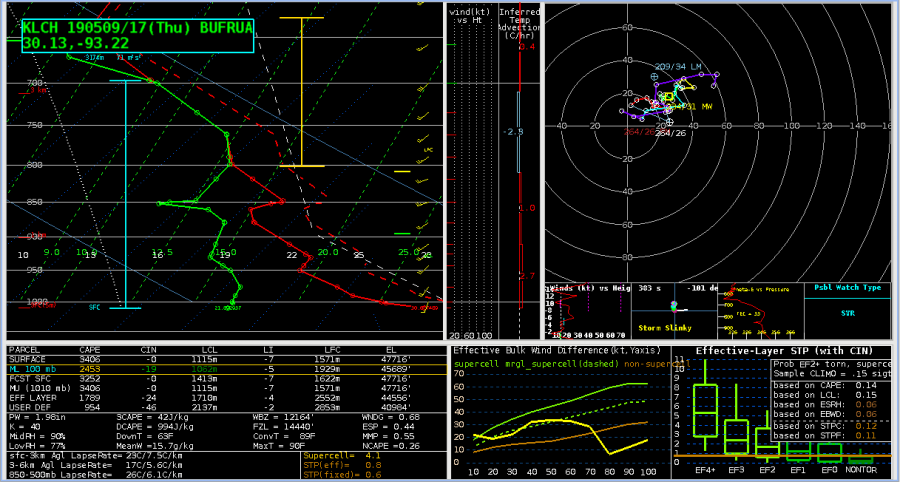
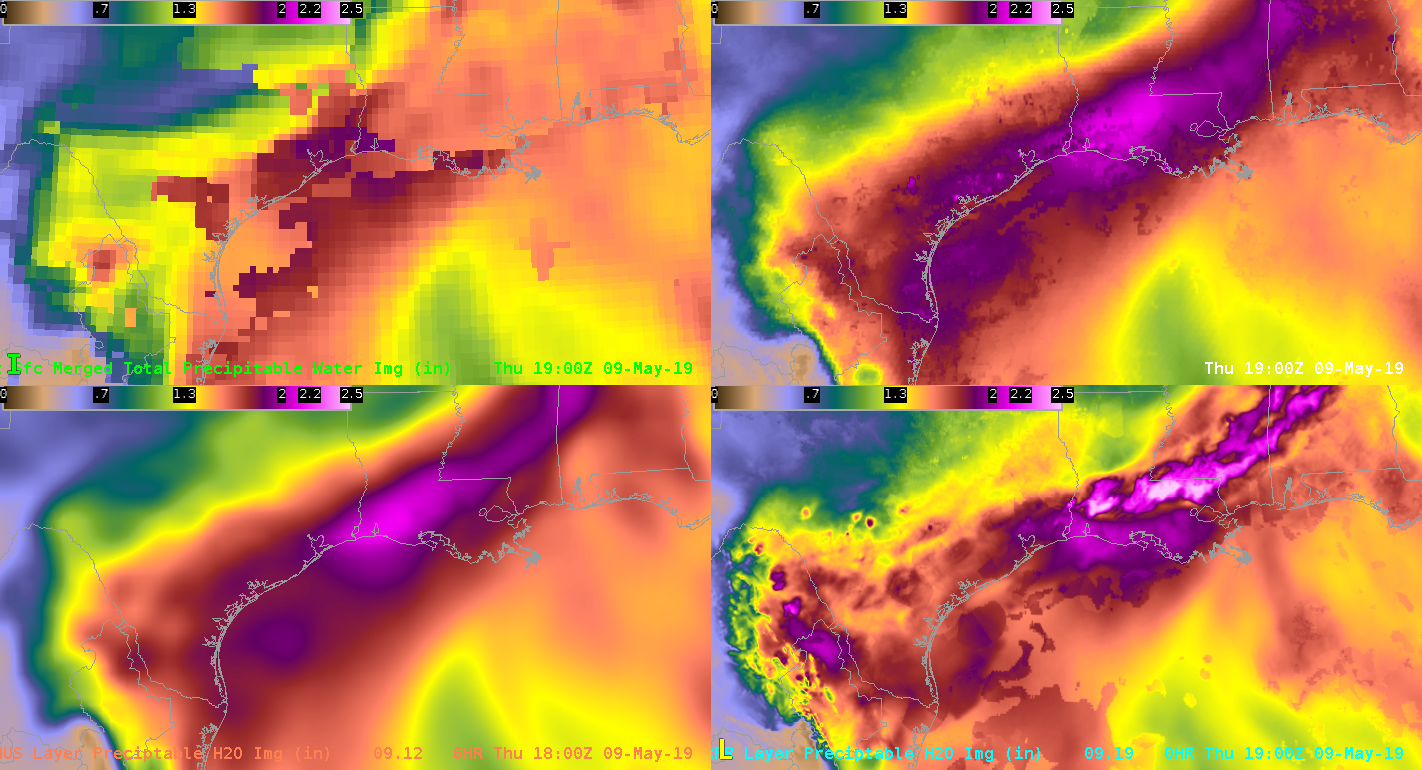
No Cap, ~2500 J/KG MLCAPE, surface moisture isn’t mixing out too much….so, where are the storms?
Let’s take a look at a NUCAPS sounding taken from this point almost an hour after the KLCH sounding:
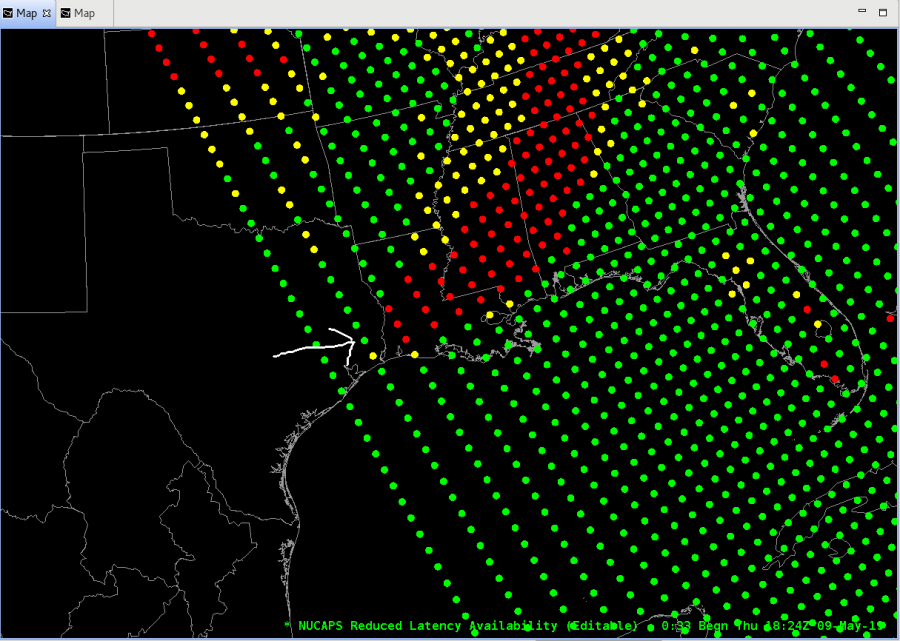
I know you are going to ask…why not the next closest dot further west? Well, it is on the edge of the instrument swath and that has a whole host of problems. Second thing is that the soundings along the edge looked…wonky…compared to the next row further east. The sounding at that point, again modifying the surface conditions for KTME (88/75 T/Td):
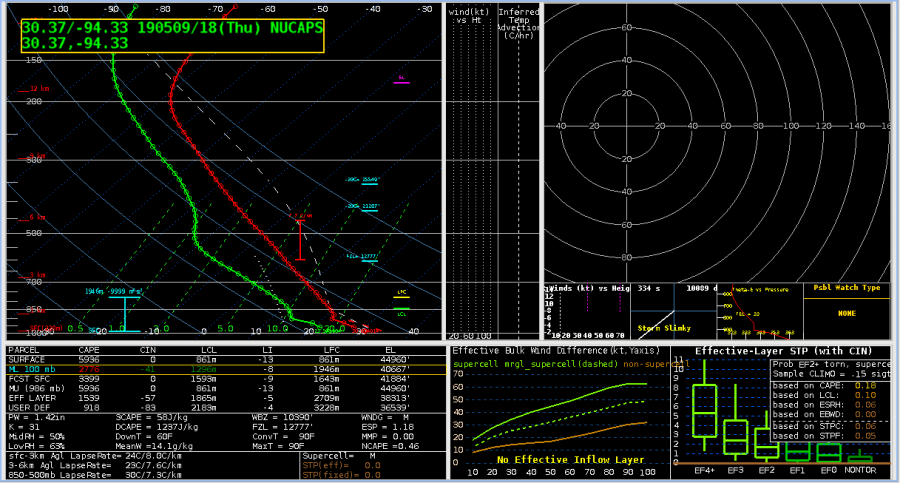
Things that make you go; hmmmm. Using the MLCAPE profile, the NUCAPS sounding shows that there probably is a residual EML behind the departing storms that the KLCH didn’t capture ahead of the storms. That may be just enough to keep the atmosphere capped and storms at bay. There isn’t much of a cap, so hope continues we will get convection over the KHGX CWA.
NUCAPS sounding profiles – thumbs up for helping figure out what is going on. And get more polar orbiters up and going so we can have more than two soundings per day…preferably on different orbital inclinations for better spatial coverage. Please?
-Dusty


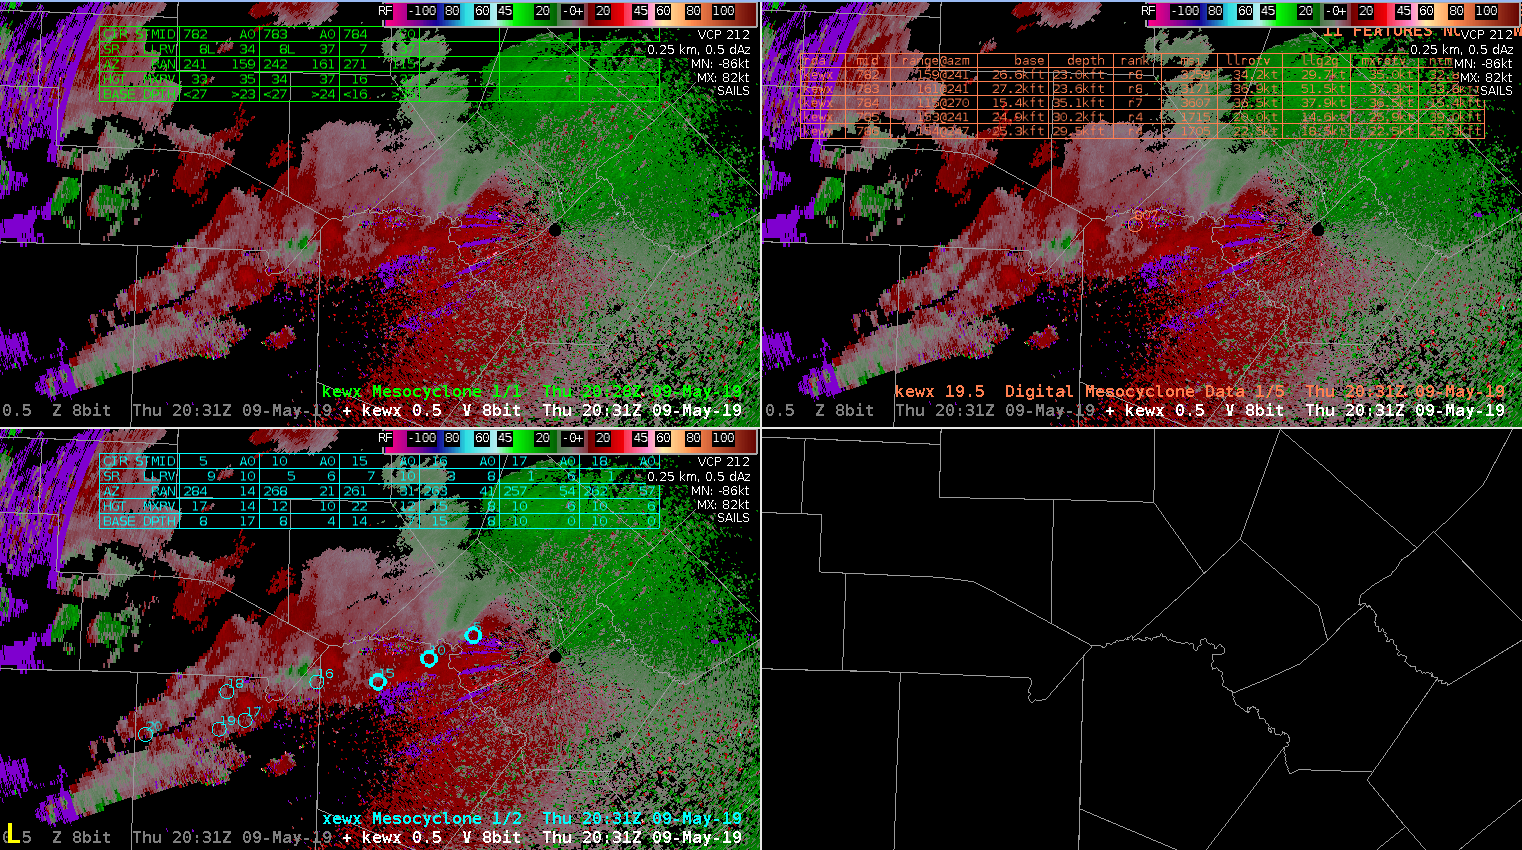
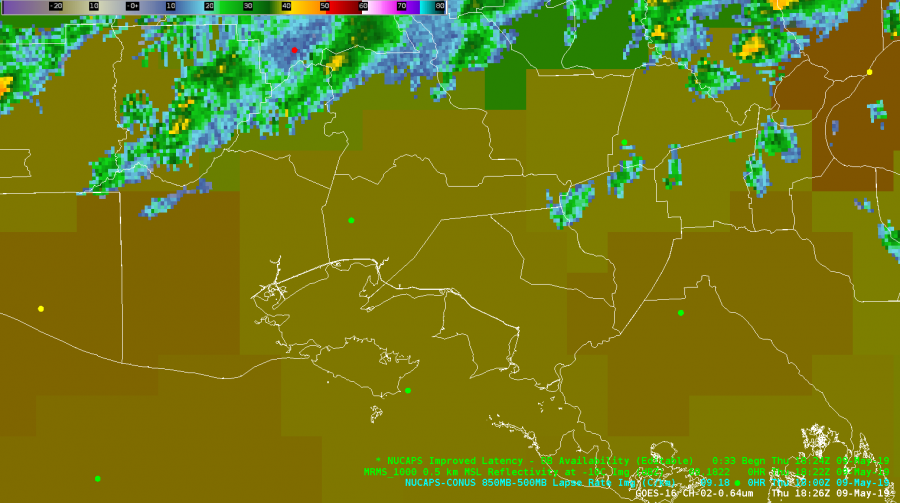 NUCAPS data in advance of convective line today. Iberia County METAR station coincides with NUCAPS operational sounding (modified soundings not available today).