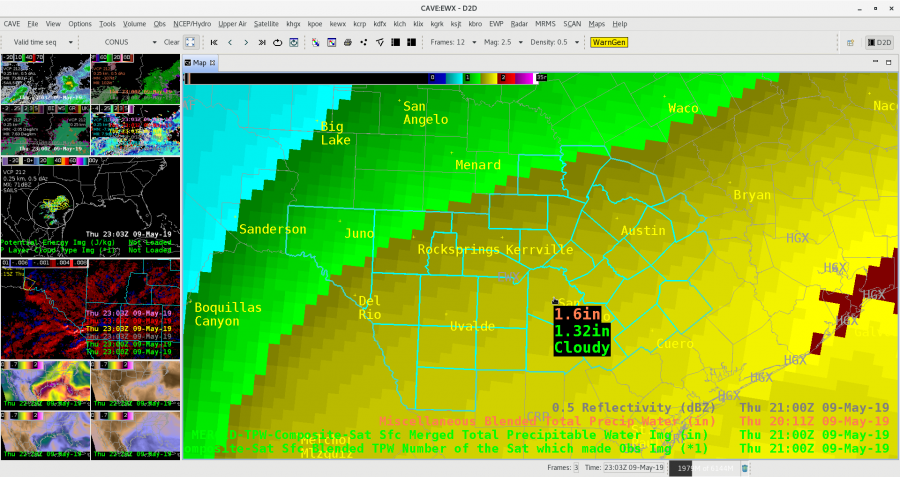
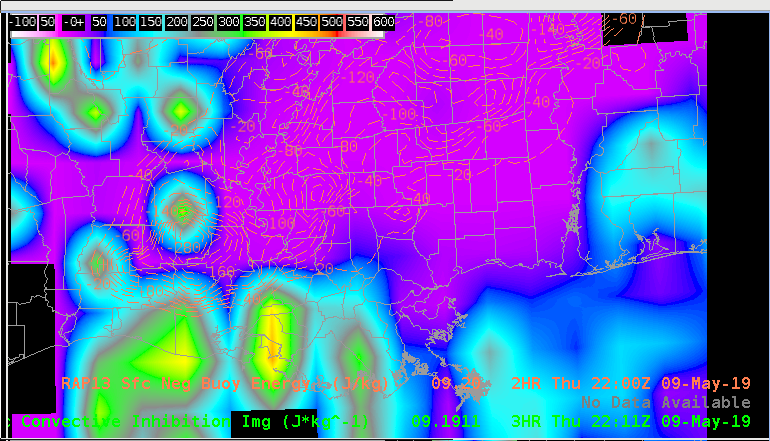
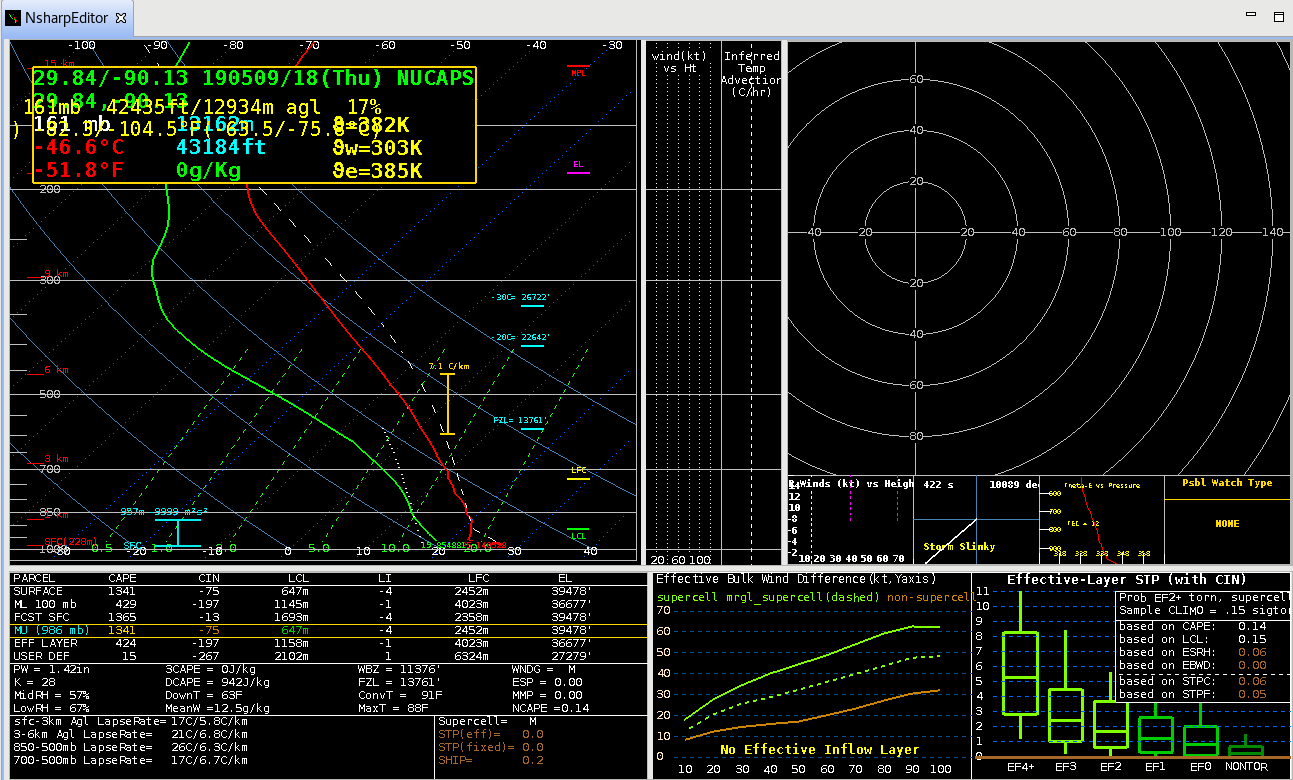
Today we were tasked with the LIX CWA (New Orleans/Slidell, LA), and the NUCAPS sounding went overhead at 1824Z. Luckily there was a special sounding out of the LCH (Lake Charles, LA) office at 1700Z so there was at least a loose chance to compare the data. So, let’s do just that! First the LCH sounding…
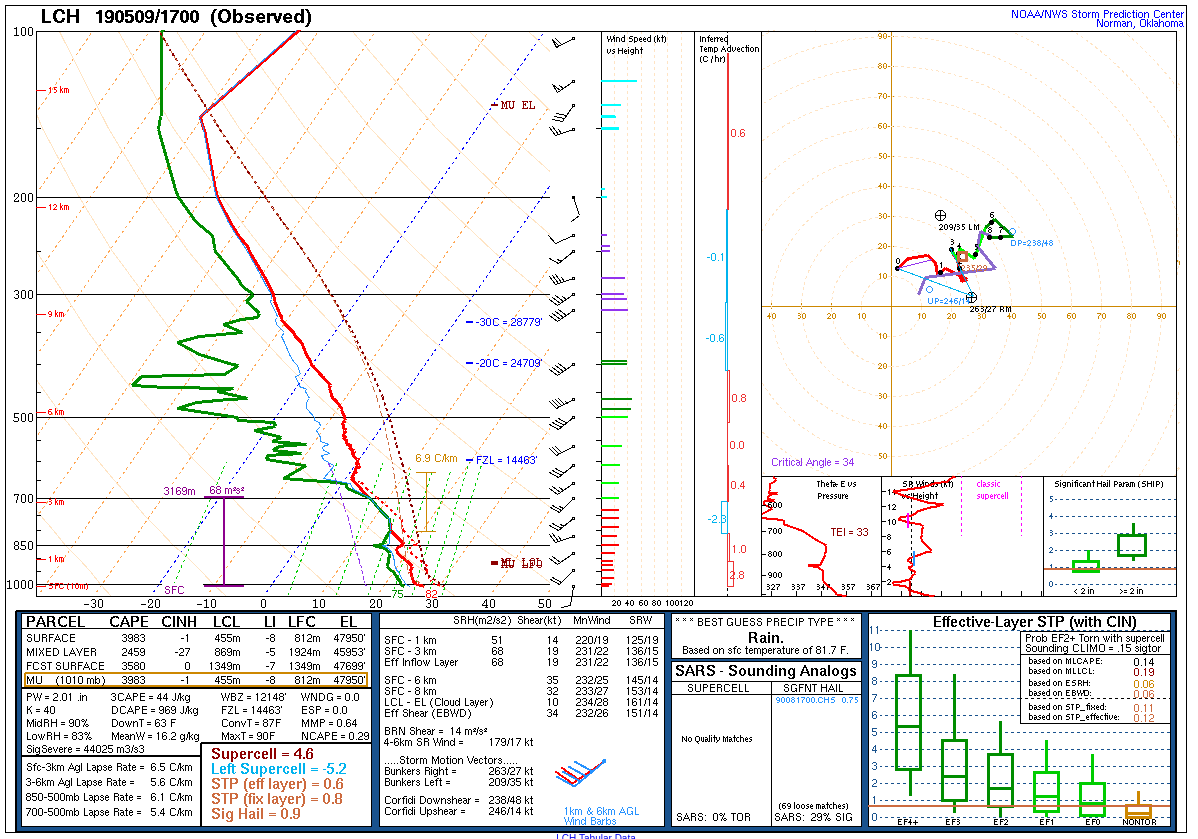
Shows a relatively unstable atmosphere with decent lapse rates in the mid-levels. And now the nearest good-value NUCAPS sounding (taken just north of Vermilion Bay)…
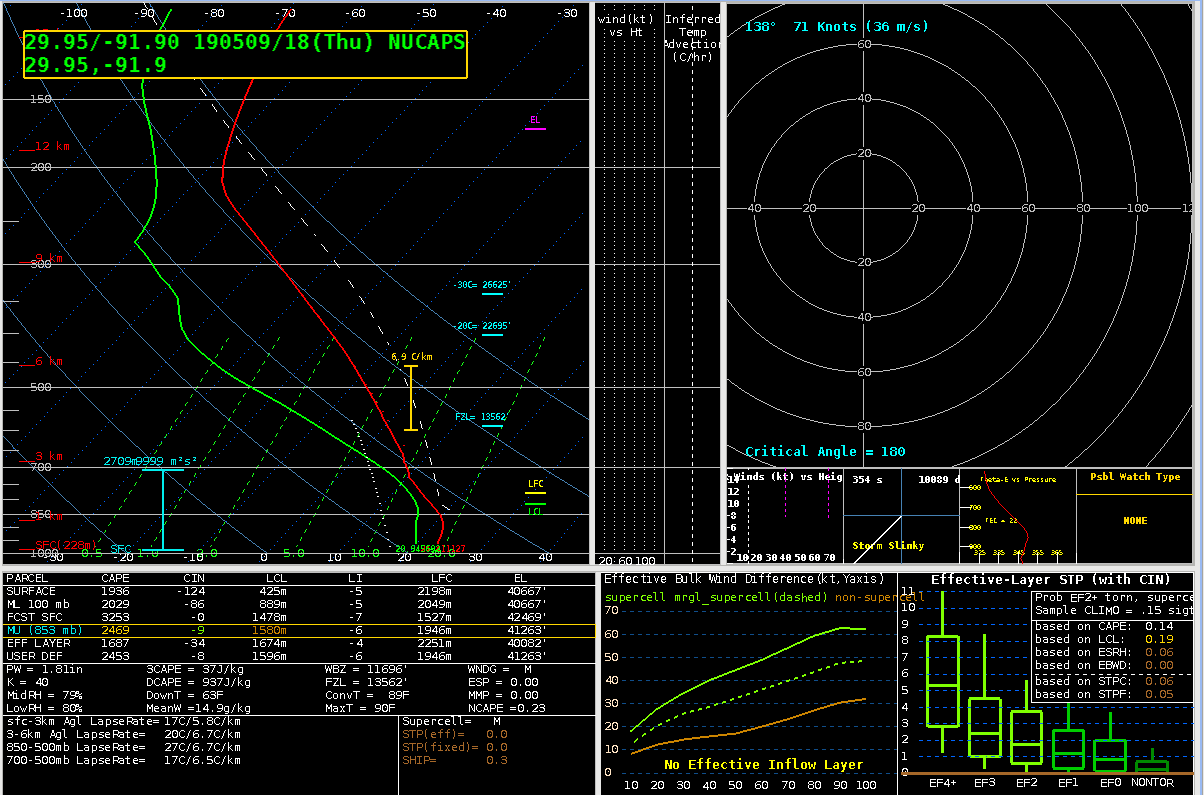
The two soundings aren’t an exact comparison, they aren’t in the same location or taken at the same time, but synoptically it should be a pretty similar environment ahead of the broken line of storms moving into the area. The biggest problem comes in the boundary layer with values that are way off. The profiles were showing a 2m value of 76/70 when in the observed sounding it was 82/75. Given that the sounding was taken earlier in the day, it’s troublesome that the temps were much higher than the NUCAPS sounding. Unfortunately, modified soundings were not available on this day and given the unmodified soundings inability to correctly analyze the boundary layer, it makes trusting any surface derived data near-impossible. The only application I can see for these soundings are to analyze the upper-level synoptic environment (i.e., upper-level lapse rates, relative humidities, etc.) For this, you can compare some values… 850-500 Lapse Rate was 6.1 C/km in the NUCAPS sounding it was 6.7 C/km, some variability is expected and it’s not too bad but the difference is worthy of caution. In the gridded product somehow the Lapse Rate was 6.48 C/km, much better given the expected variability but I’m not sure these values are different. Are the gridded data not derived from the soundings or vice versa? Mid-level RH in our LCH sounding is 90%, yet in our NUCAPS sounding it’s 79%. I’d expect these values to be a bit closer given the strengths of NUCAPS, but it’s close enough to perhaps chalk up to differences in space and time.
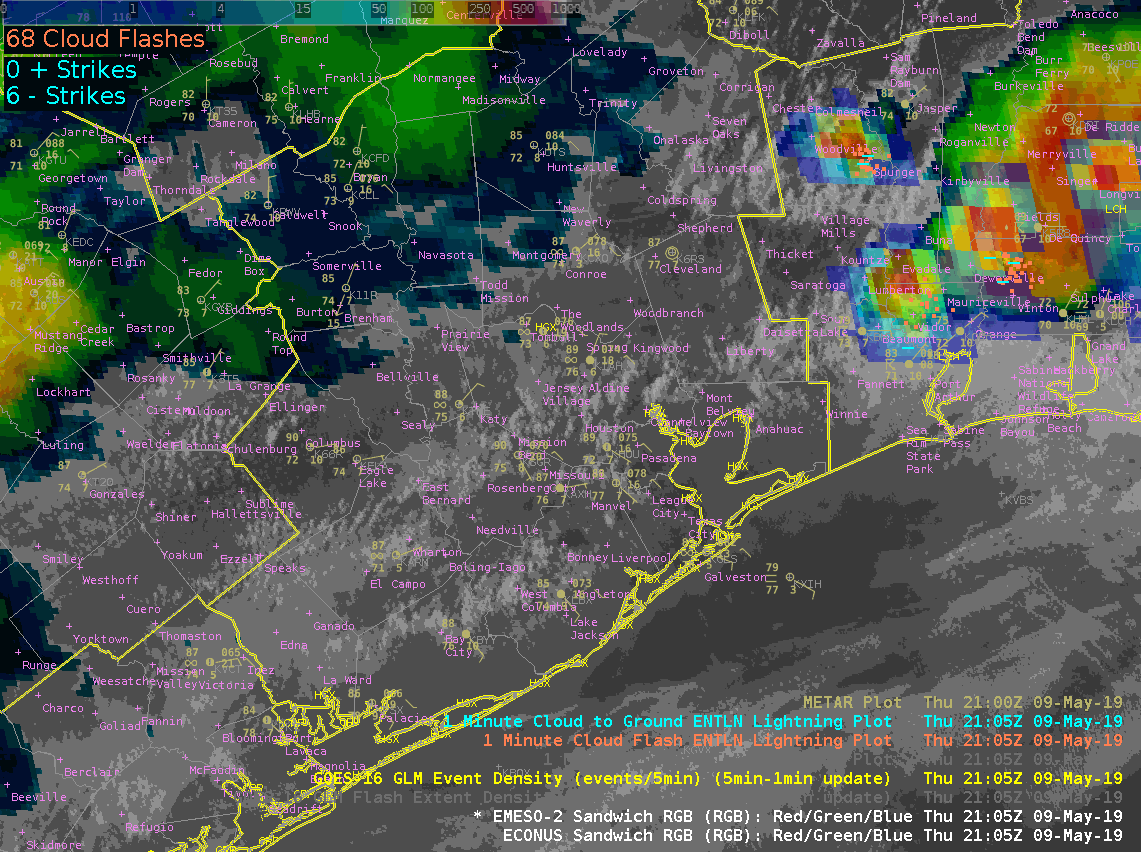
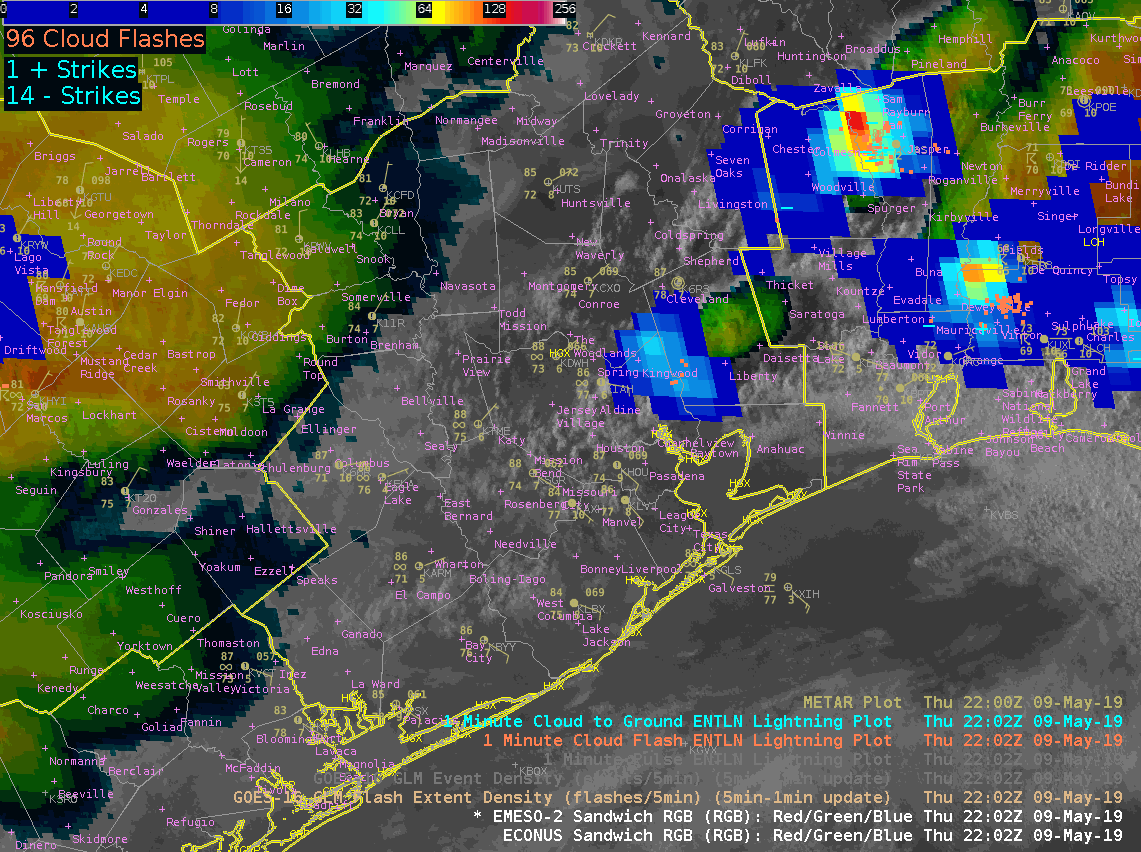
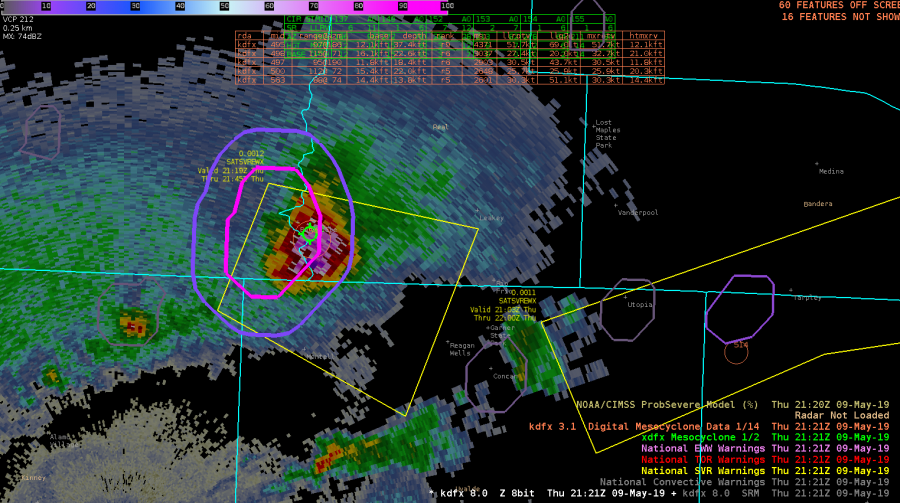
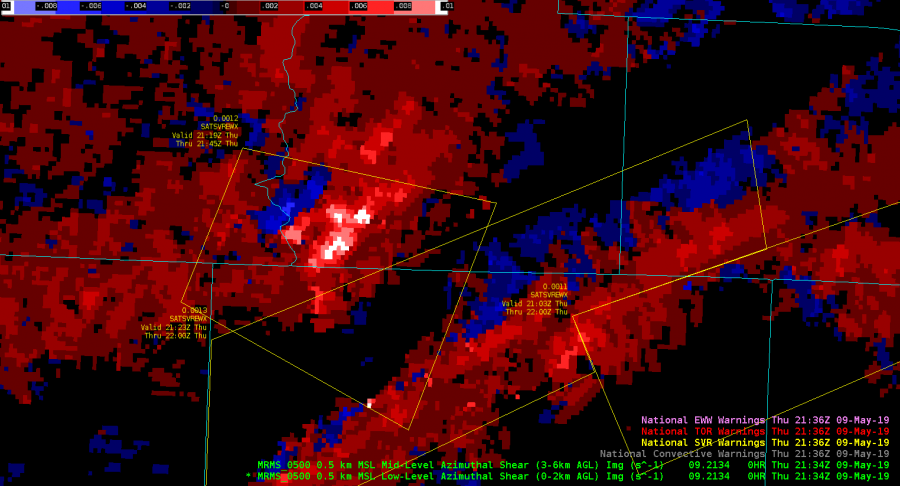
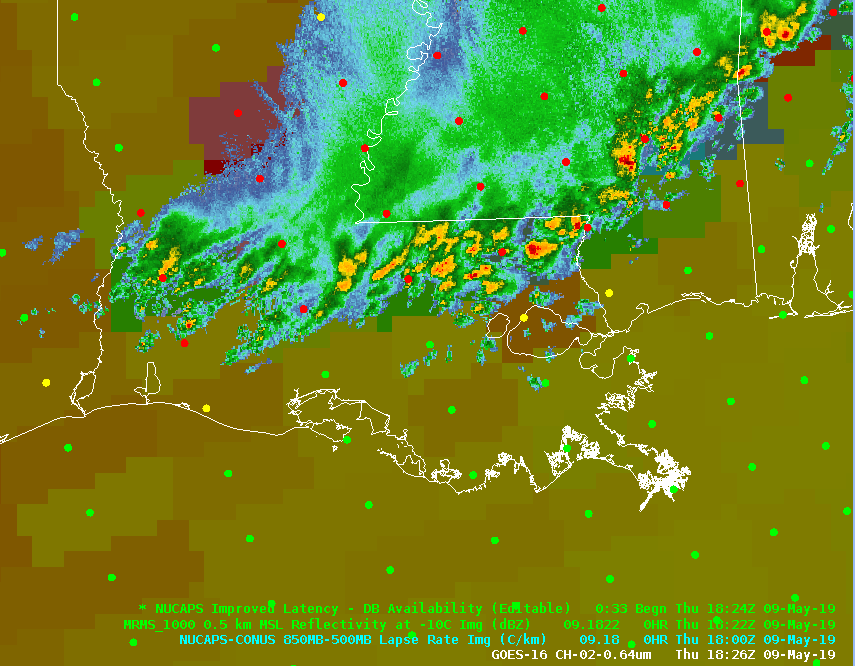
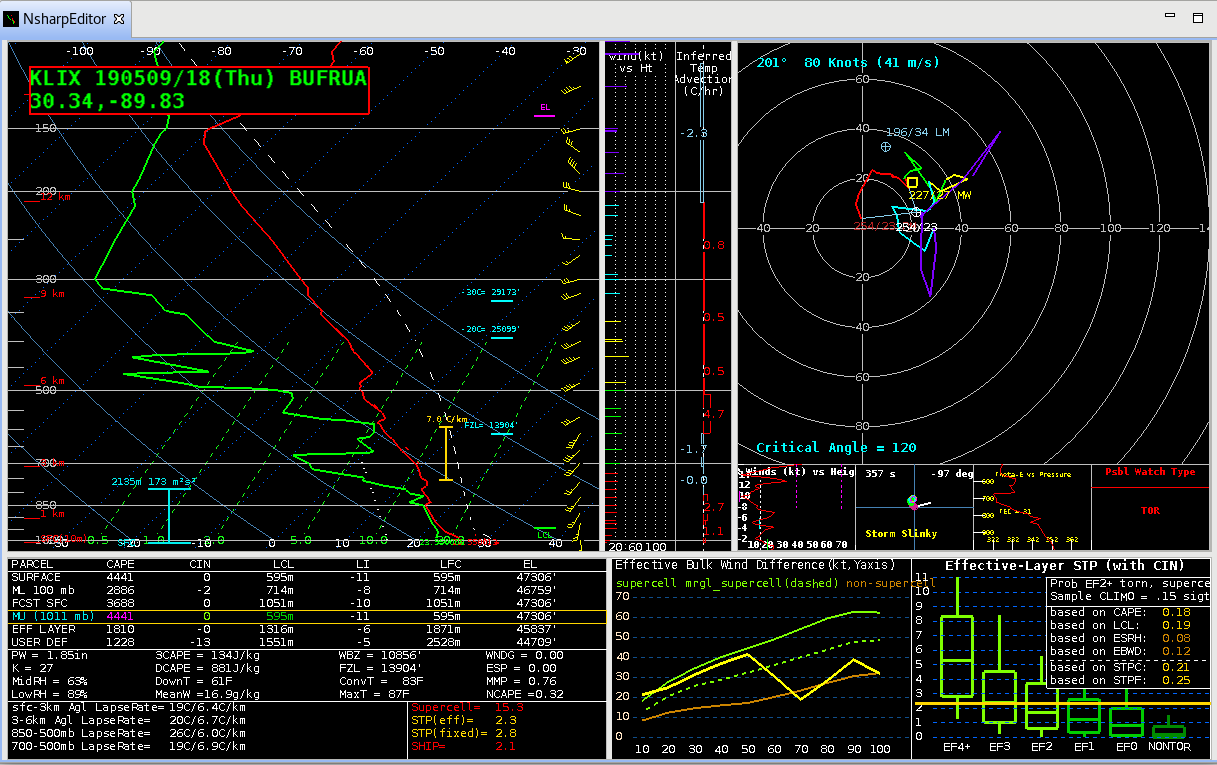
Afterwards, I saw that LIX also had a Special Sounding that could be comparable, I’ll leave the comparisons below…
#ProtectAndDissipate


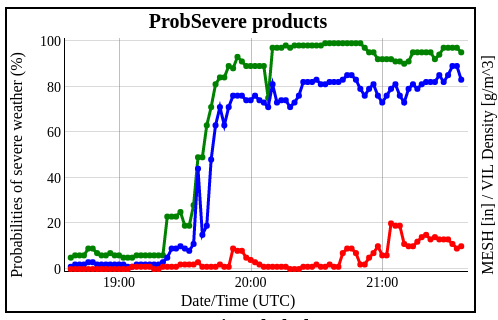
 This was my first exposure to NUCAPS FCAST this week as it wasn’t available….it’s worth a second look. It’s also an indication that you need to work hard and diligently through the end of the shift!
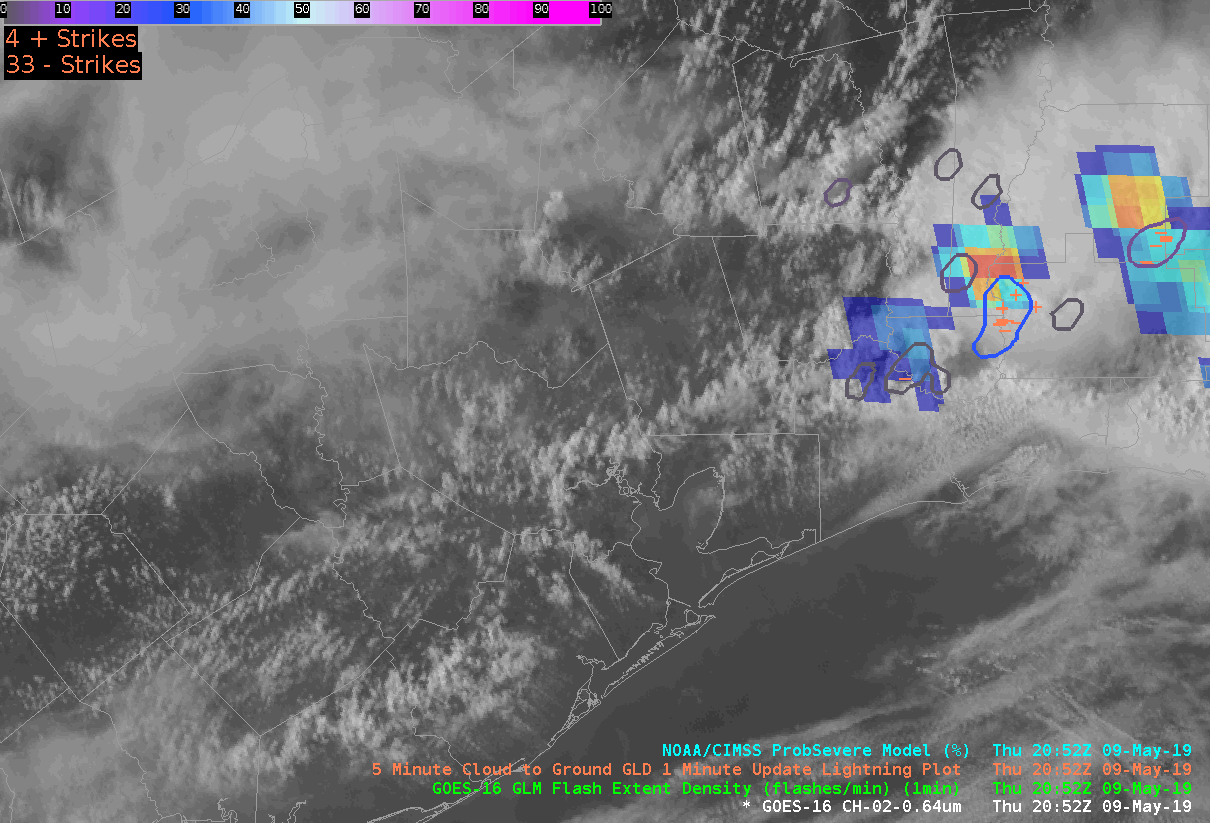
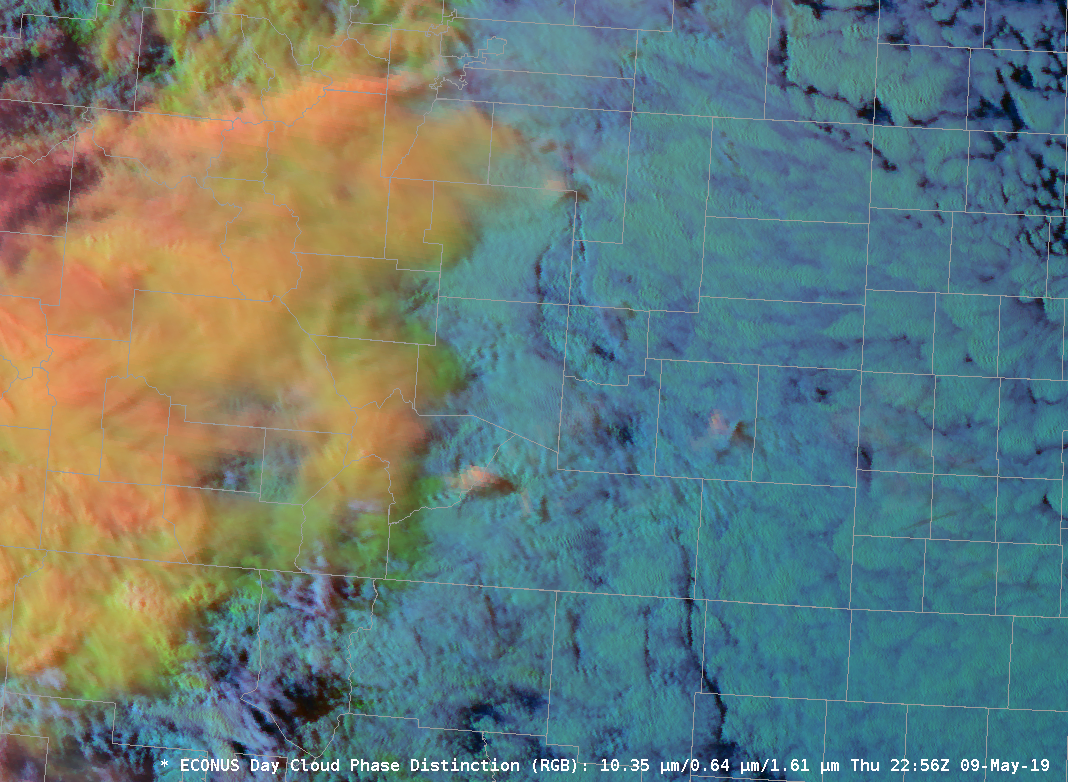 However, I wasn’t aware of some of the RGB combinations that I’ve been exposed to here at the HWT. The features that can be picked out by applying coordinating colortables to multiple channel views is simply astounding. I’ve used the simple water vapor, day cloud phase distinction, day convection, differential water vapor RGBs this week….I’ll be making a phone call to my broadcast weather vendor. I know I’ll need to get some other broadcasters on board with me to lead a charge, but count me in. Until then, I’ll be livin on the CIRA RMMB Slider site!