QLCS and Supercell Recognition with AzShear

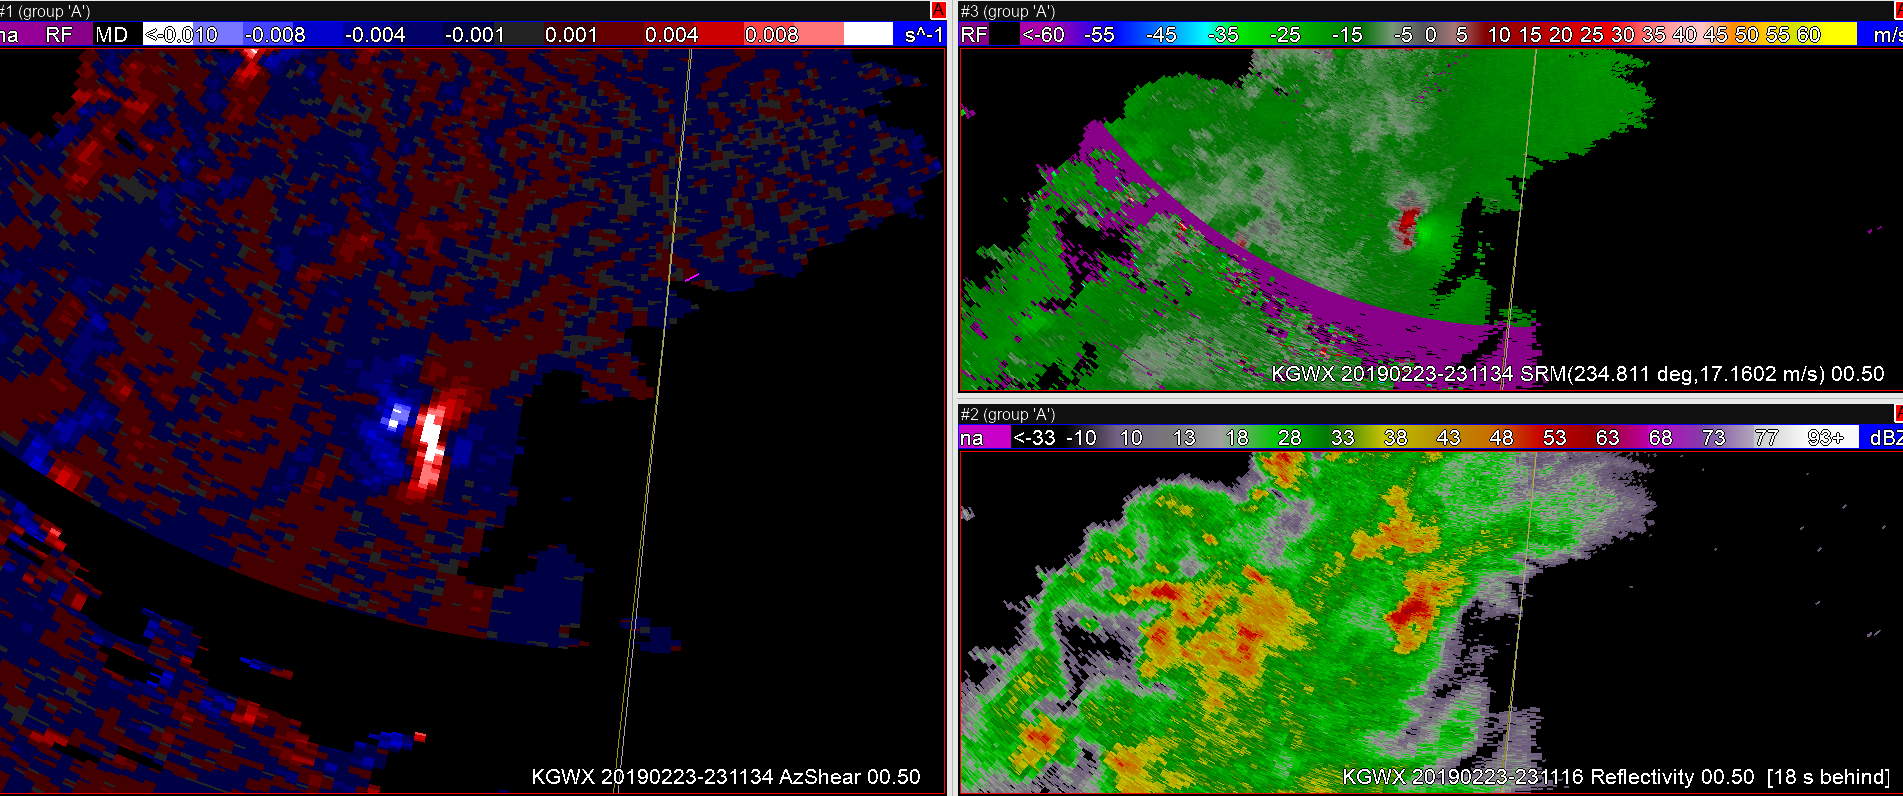
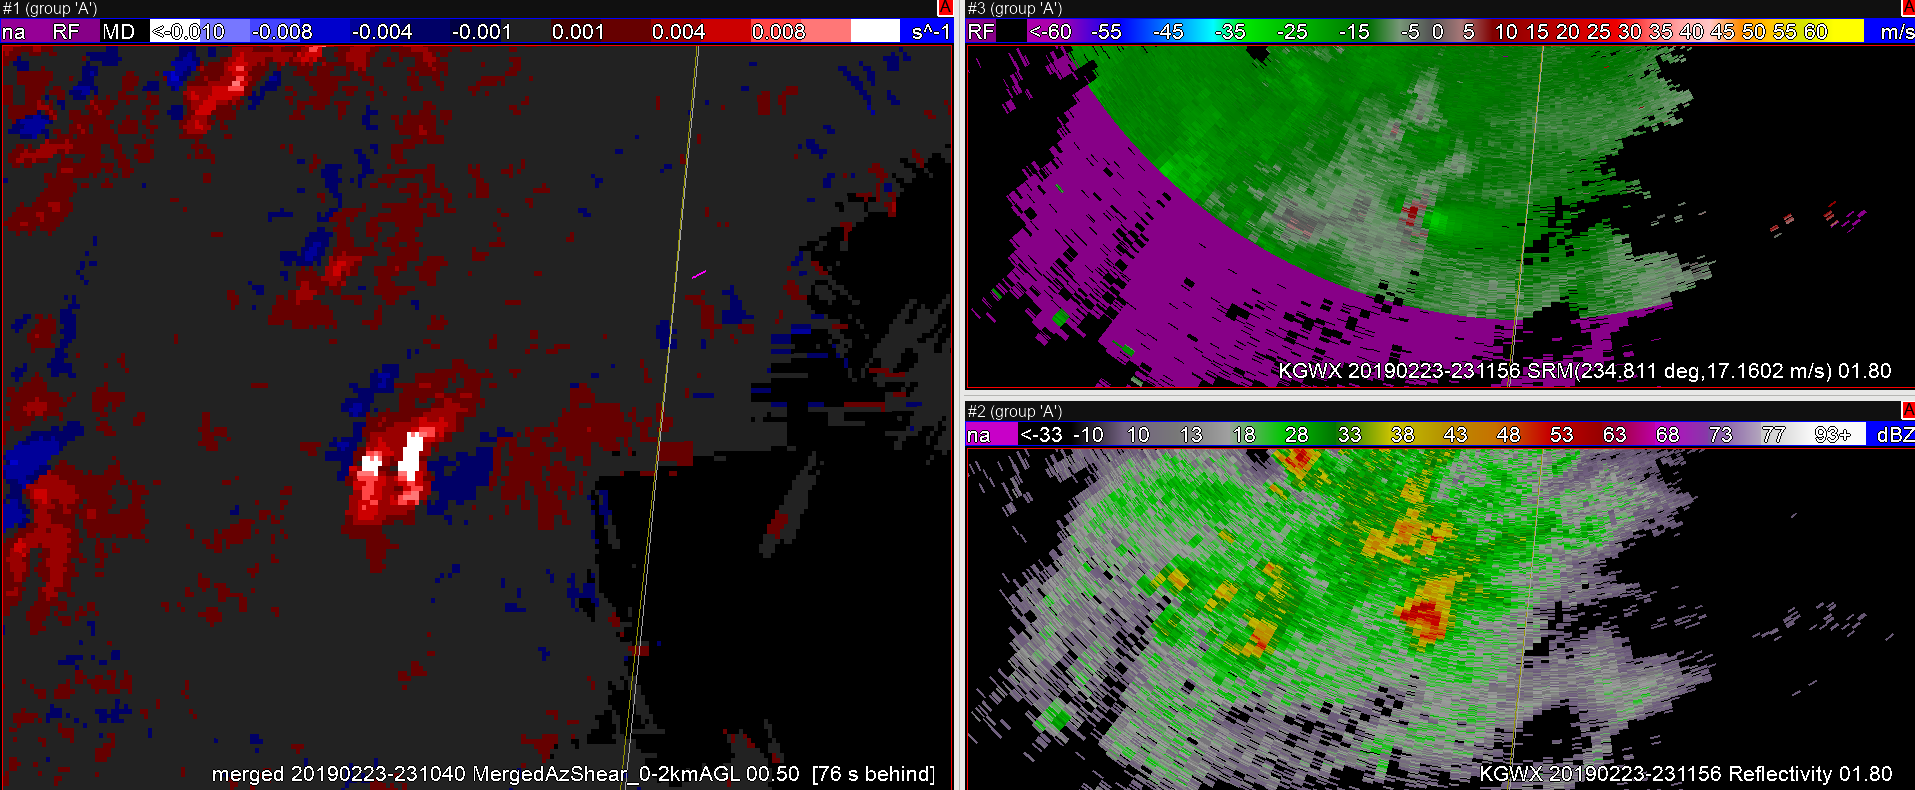
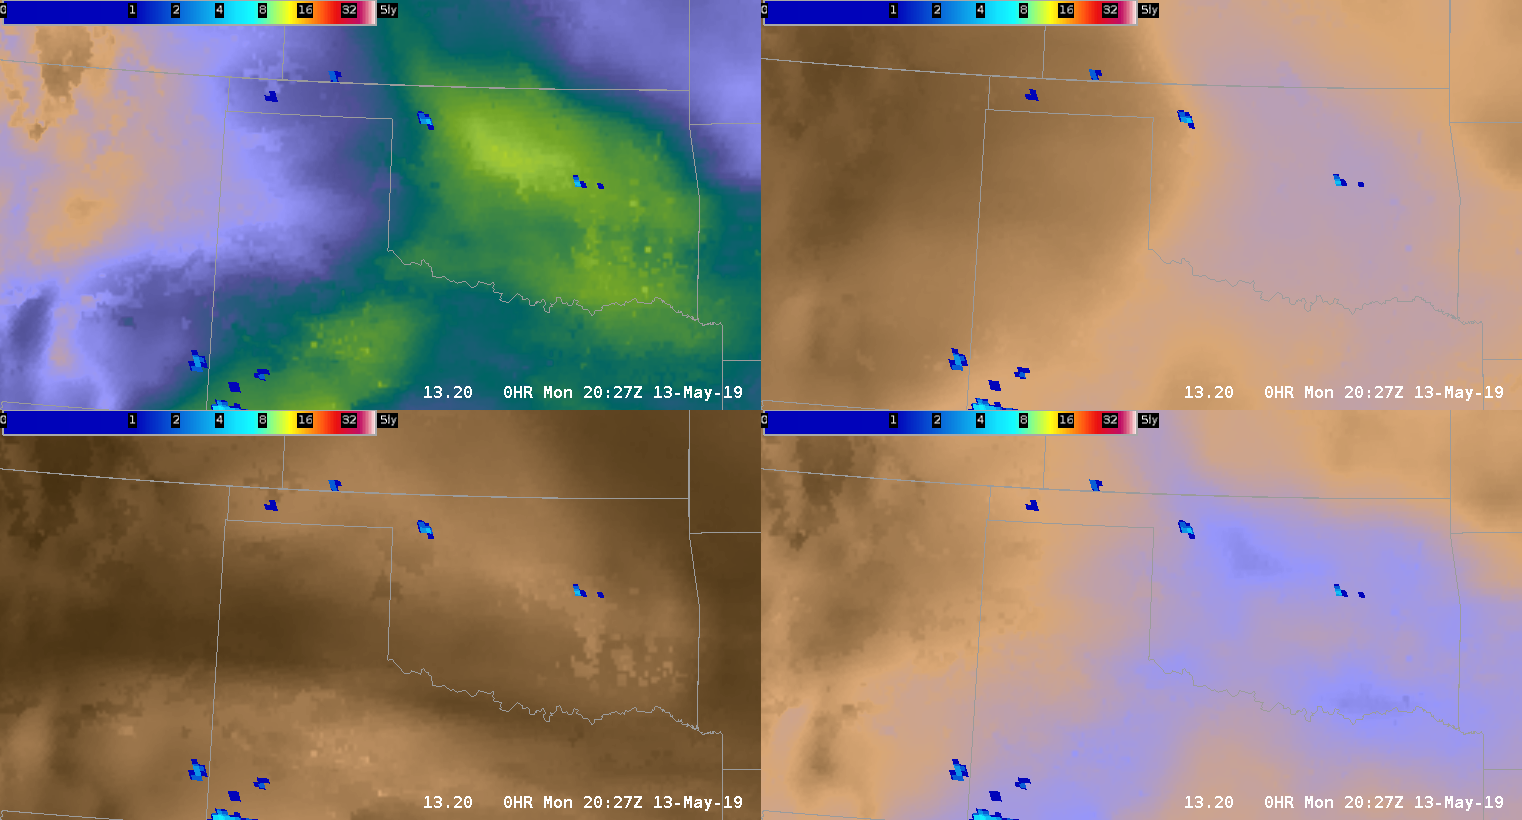
Attached below is one example where the AzShear from a single radar/single tilt (KEOX 0.5deg) is indicating a comparable magnitude couplet with one storm as it is for the known tornadic supercell just north of it. The important item to note here is that both of these couplets are fairly far from the radar at this point, which means the AzShear is being impacted by elevation. This would be a good case in which having a different color scale may be of use to determine the differences in strength of the couplets. This is also a case to make sure to utilize the closer radar and not rely solely on one radar that may be primarily farther (if possible). In addition, this similar intensity in couplets is significant in recognizing that a tornado may not be observed even though the couplet is identified from one specific radar in case there is not a closer radar at the time.

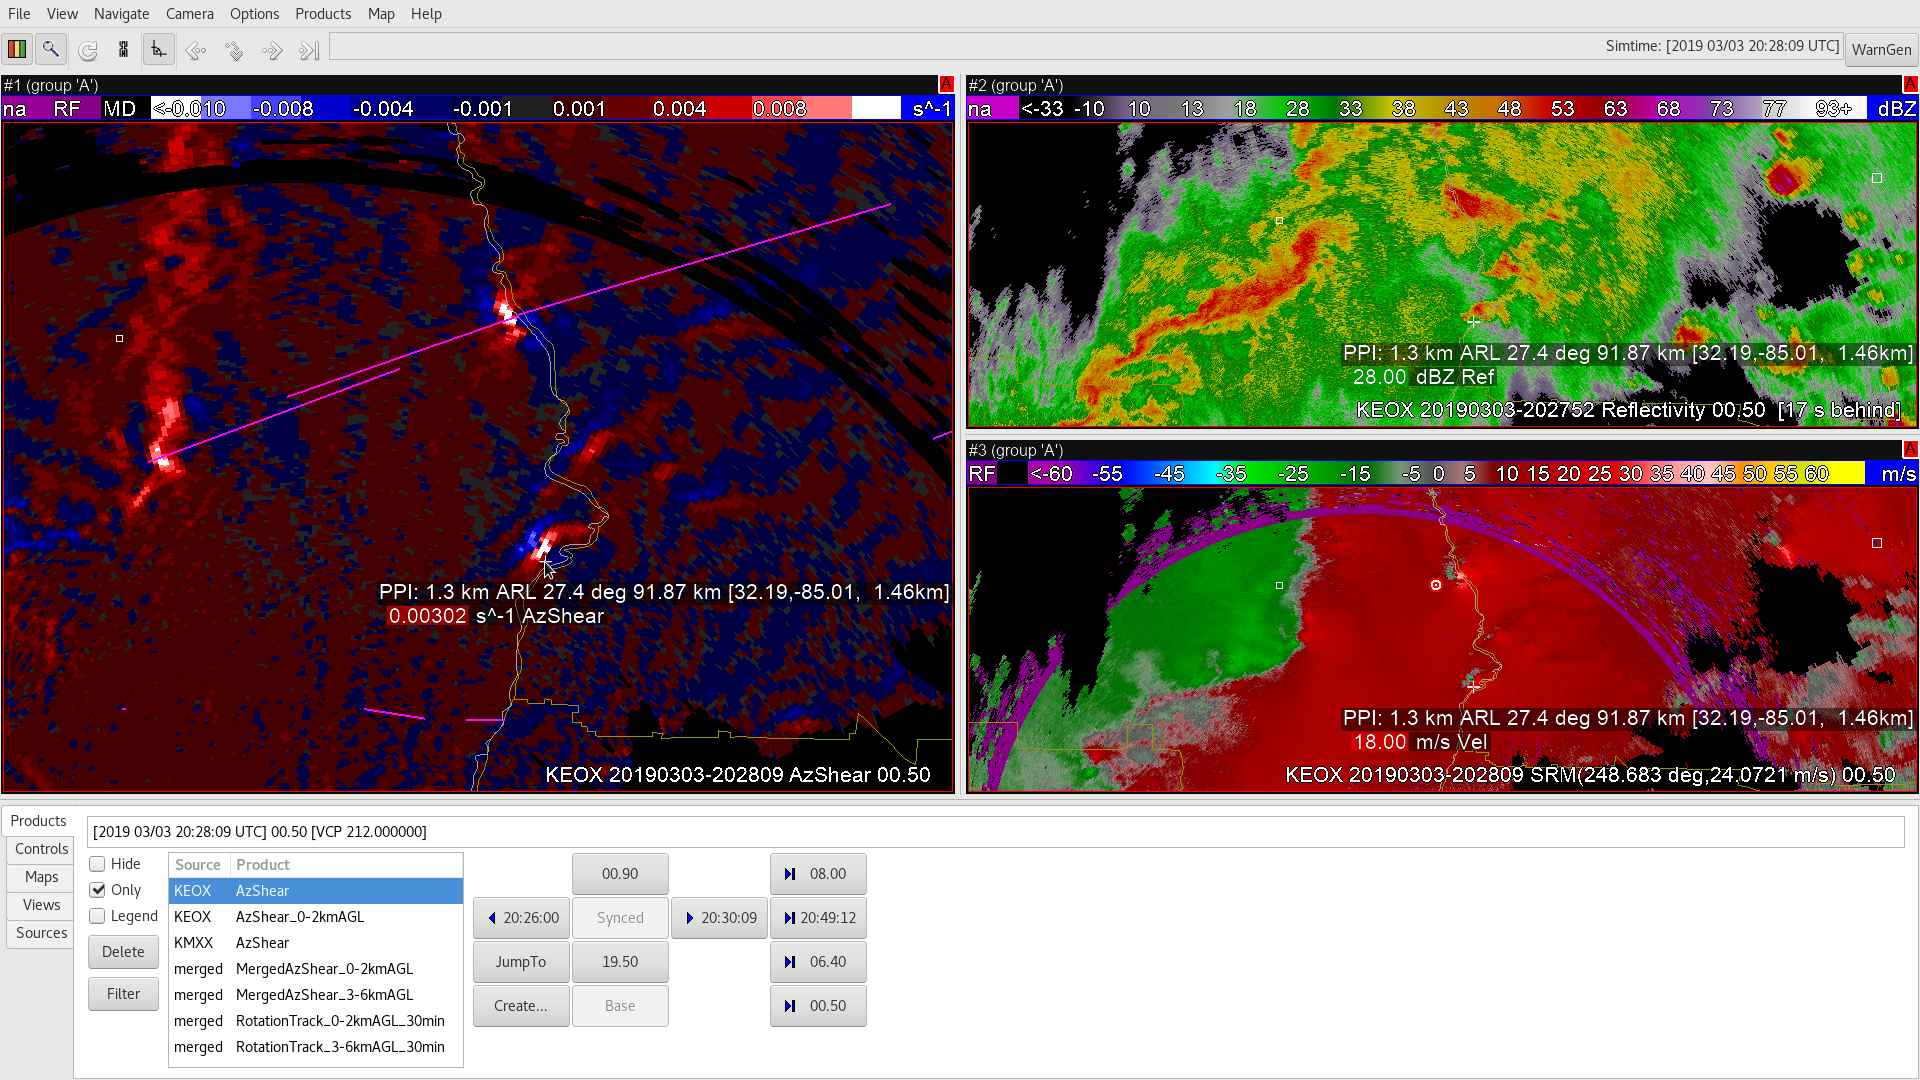
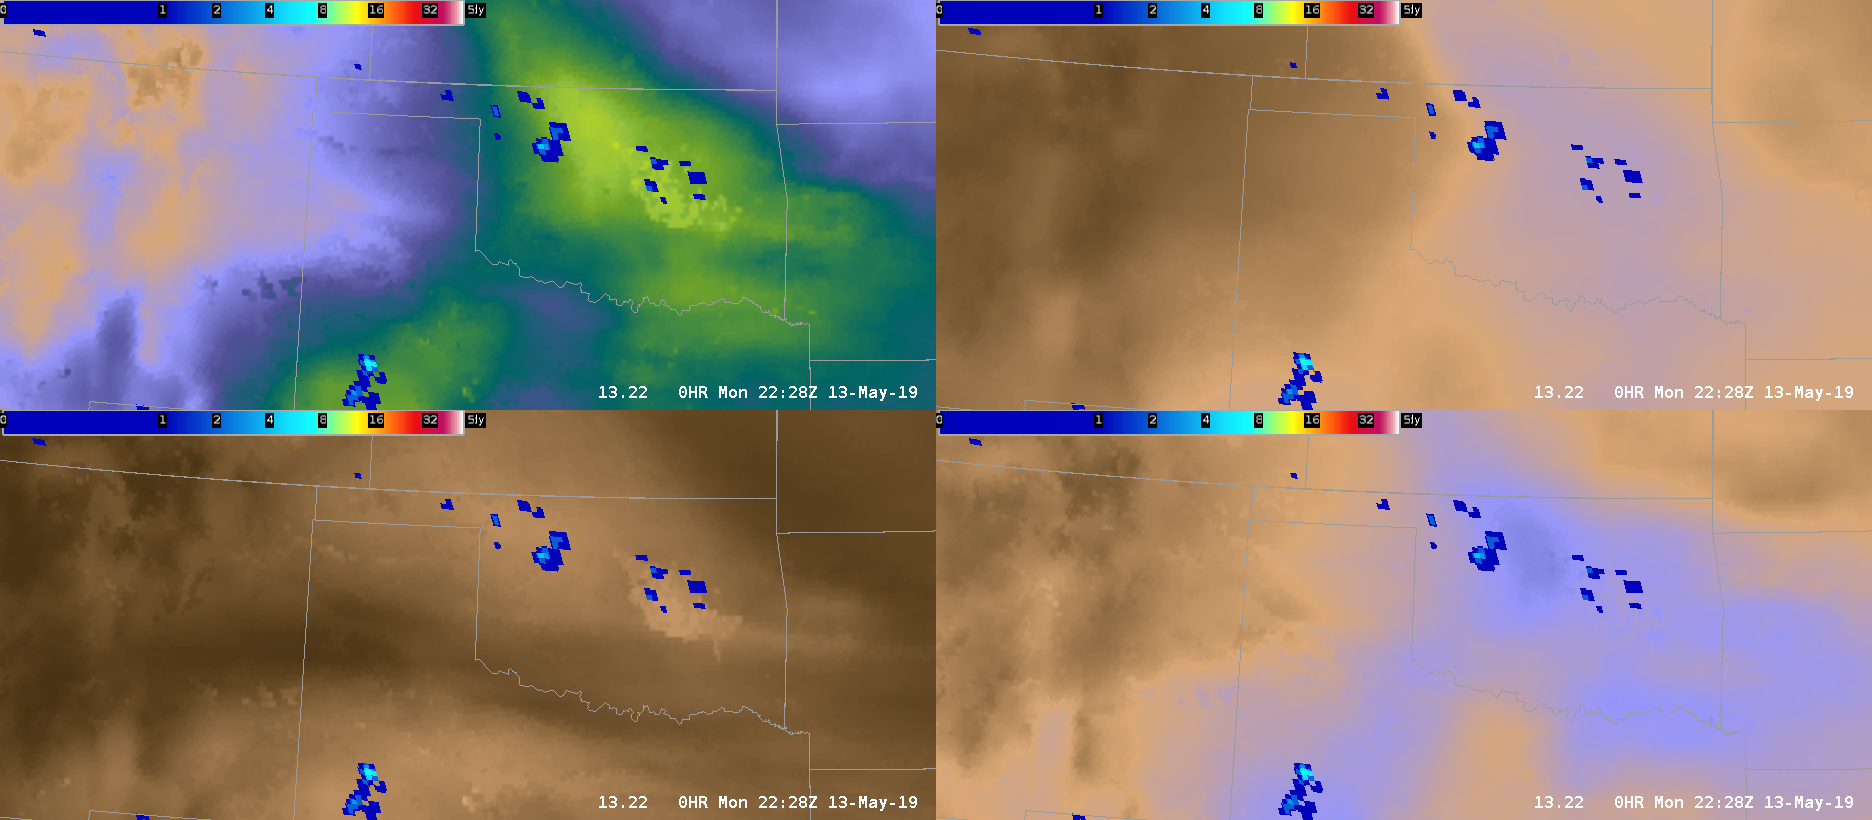
Below is the same circulation at  the same time, but now identified by a closer radar (KMXX 0.5deg). The difference in magnitude of the same couplets are quite apparent.

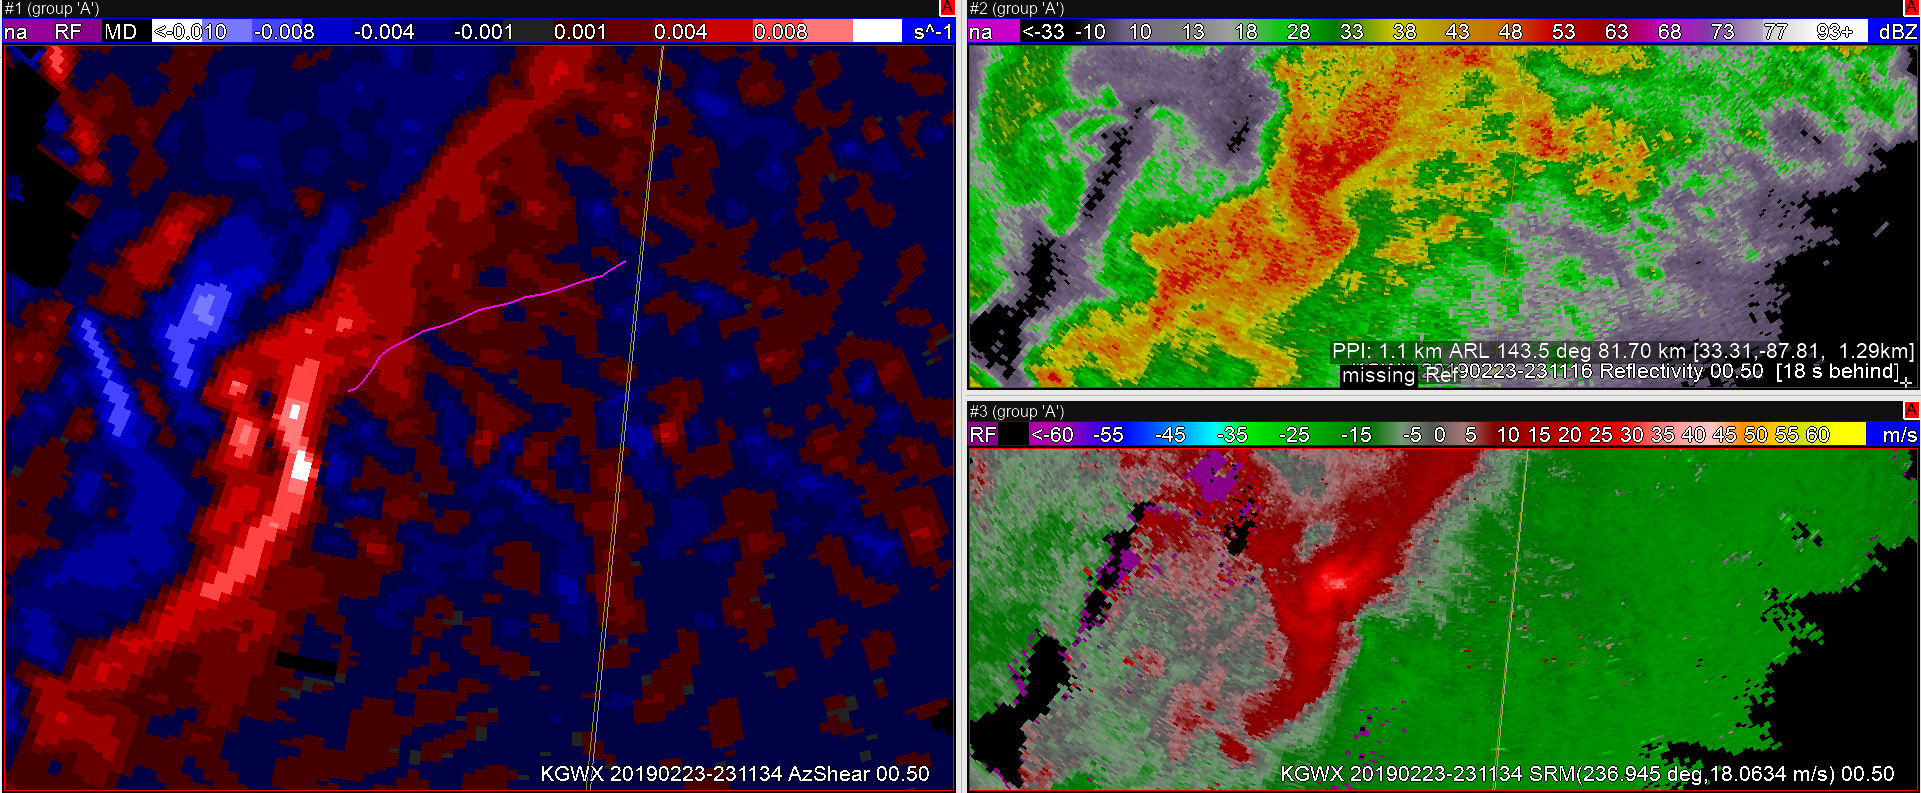
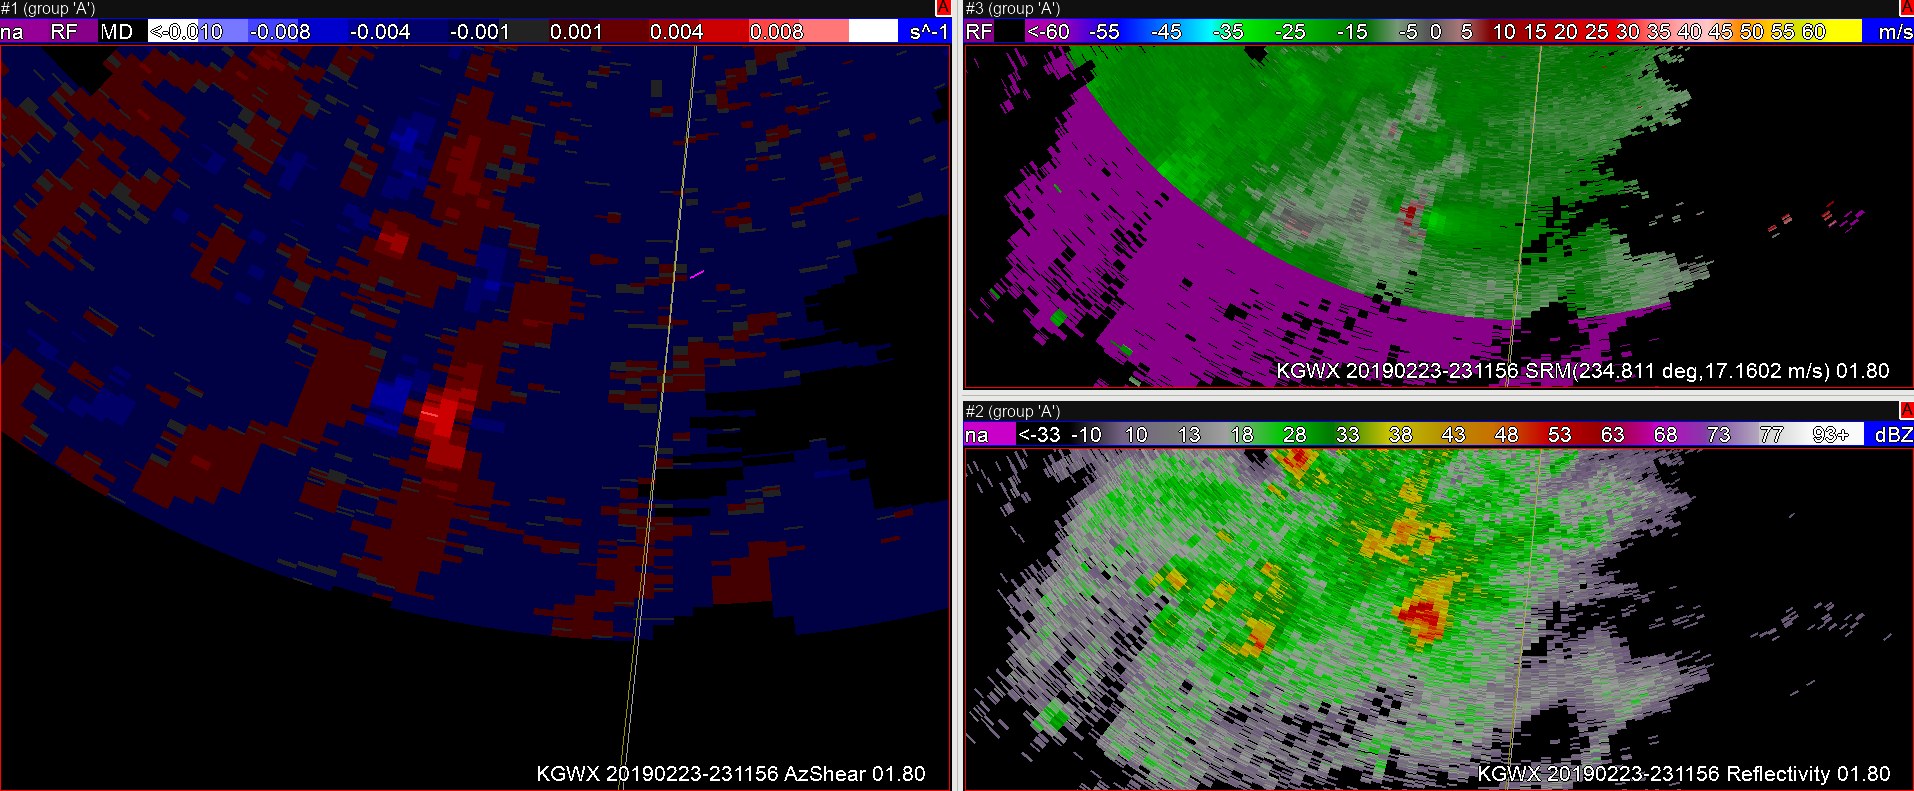
Another area to note between KEOX and KMXX is the QLCS feature, where the closer radar is able to detect better resolution of the low-level AzShear features of the line compared to the farther radar. The farther radar is clearly sampling a higher elevation/swath of time creating a broader region of maximum AzShear. Both the merged 0-2km product and the single radar AzShear product can be helpful in seeing the vertical structure  of the AzShear for this line. What’s also important at this time is the tornadic track (pink) begins around this time of the circulation.

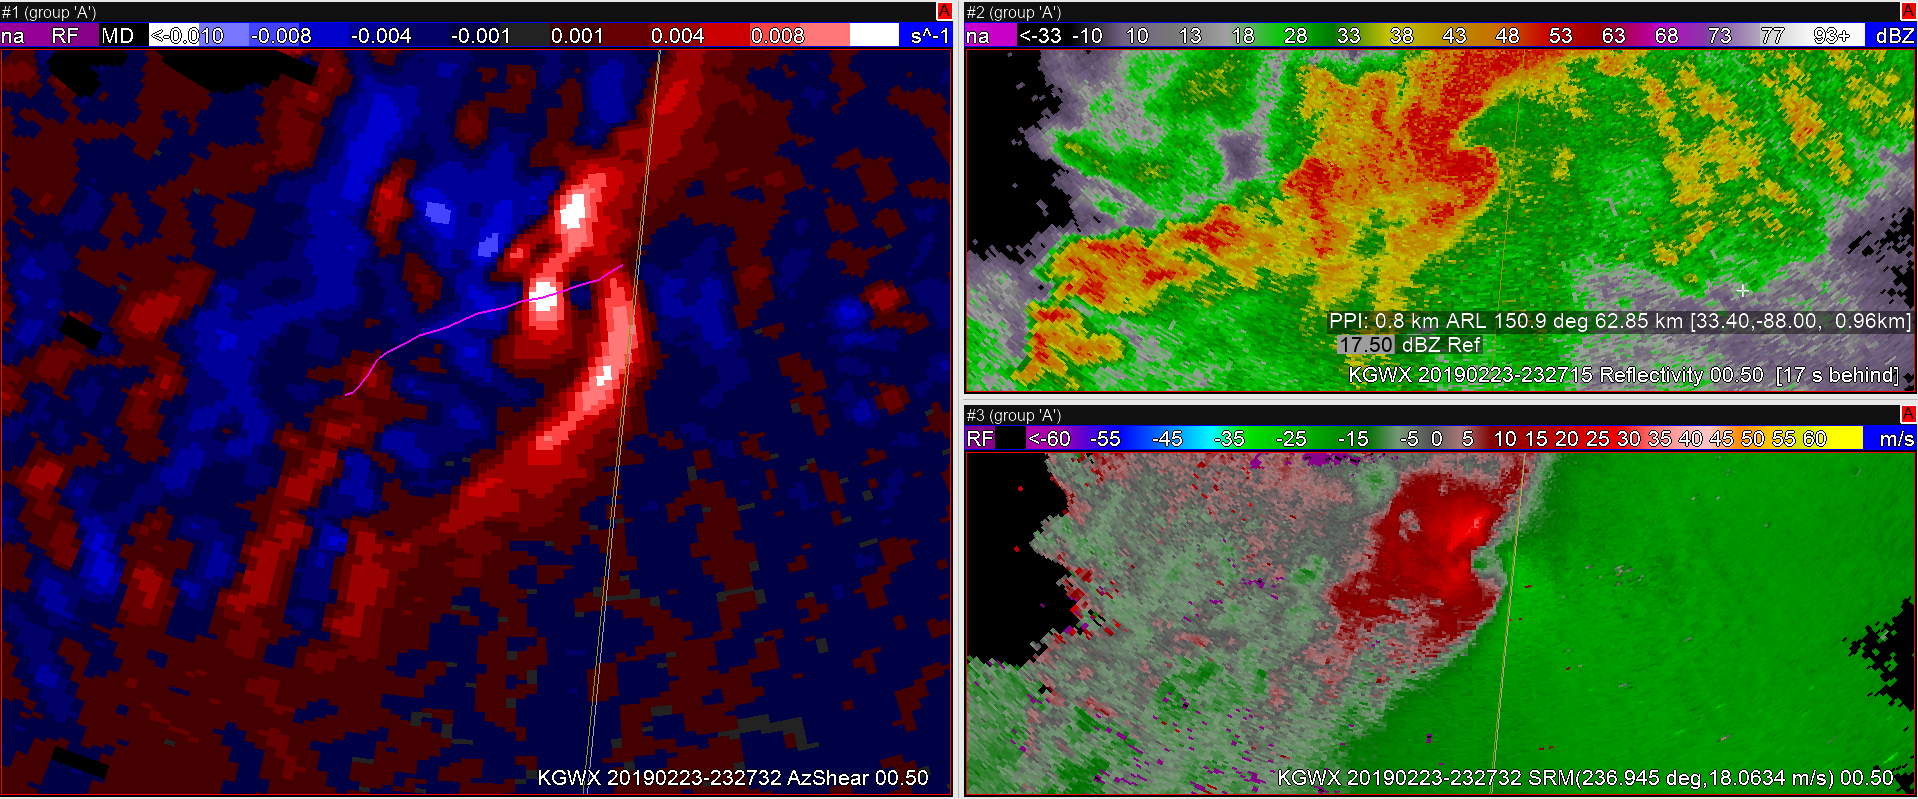
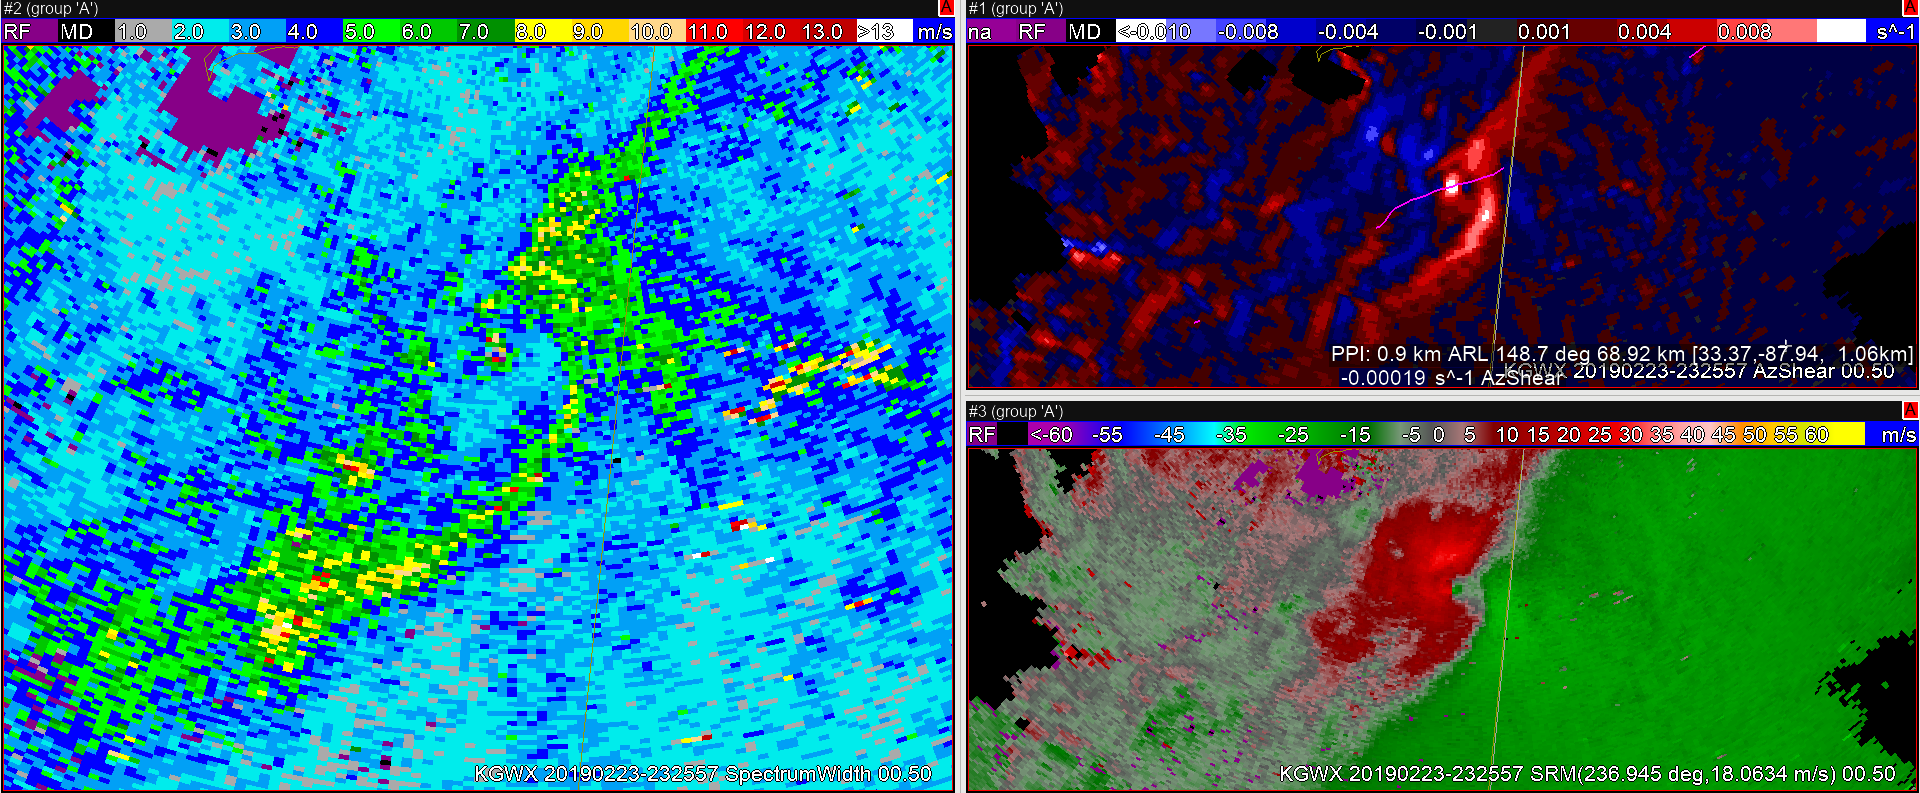
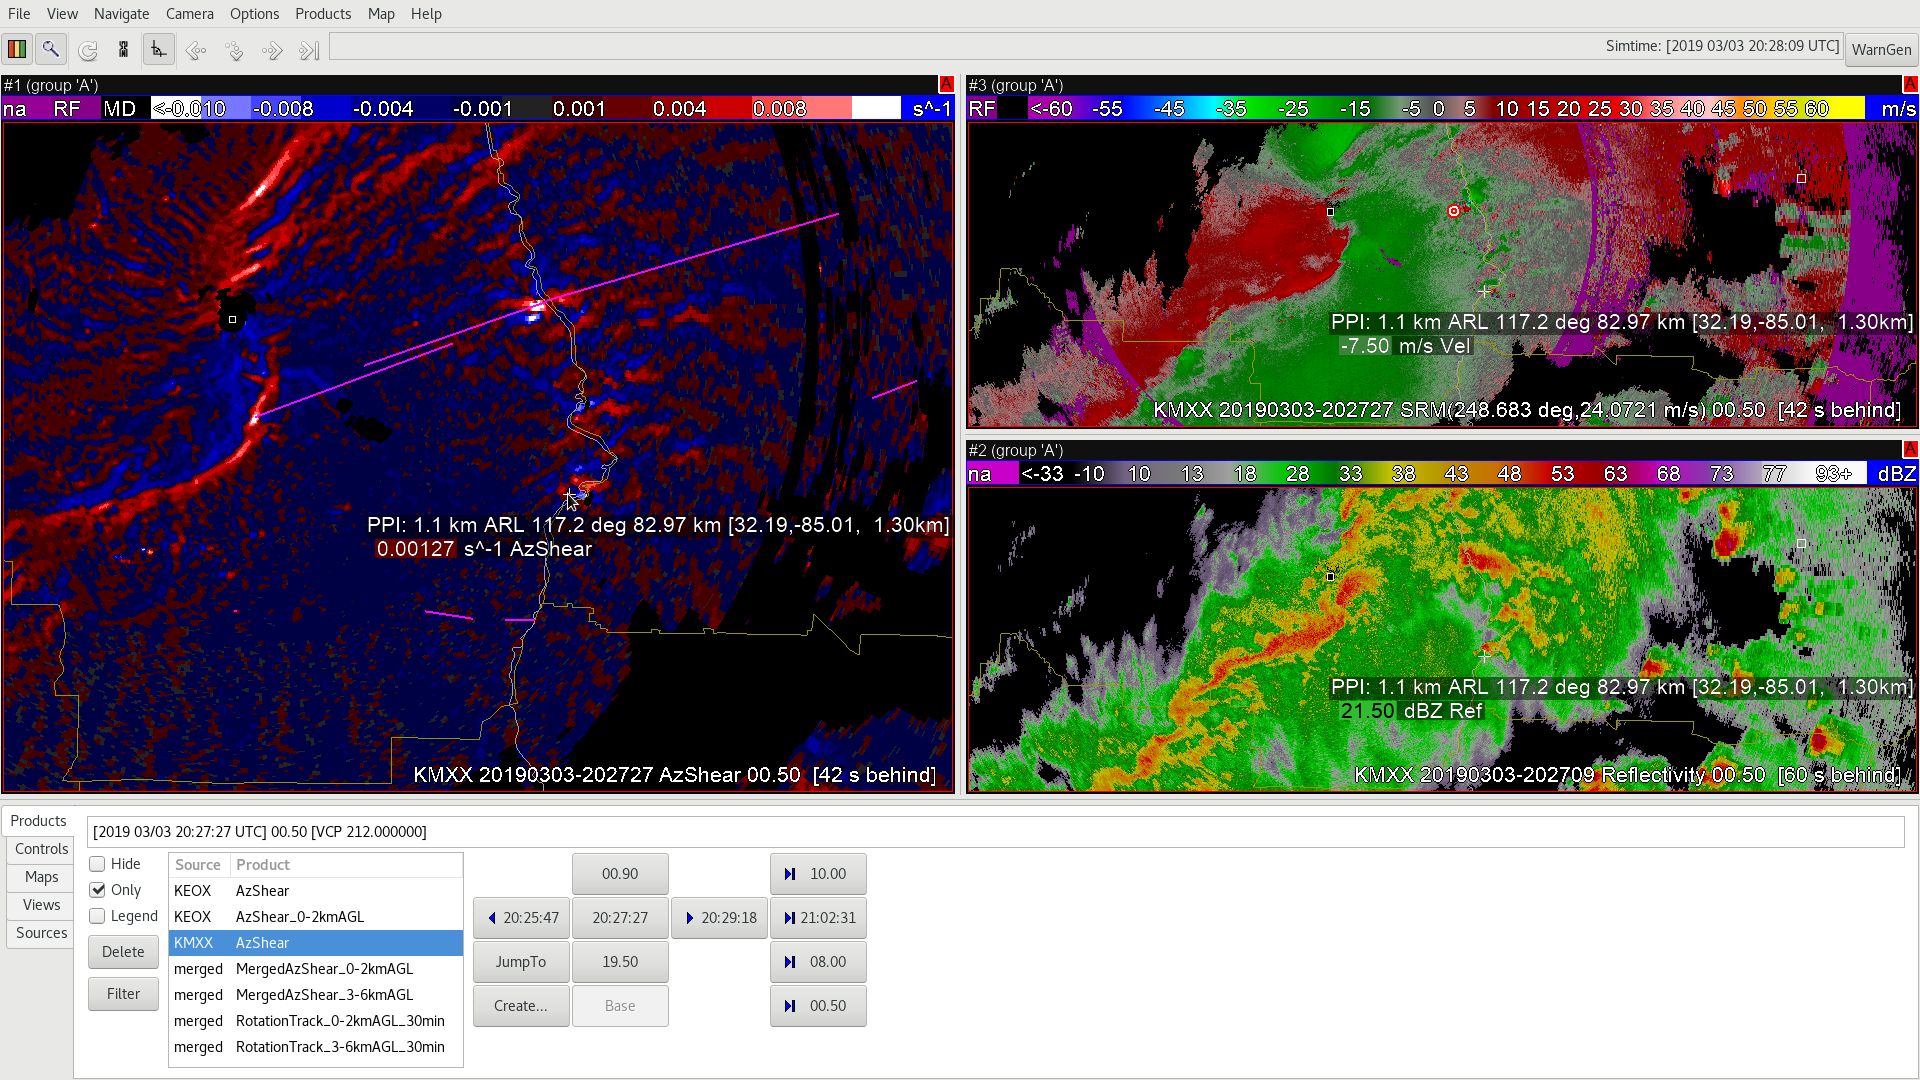
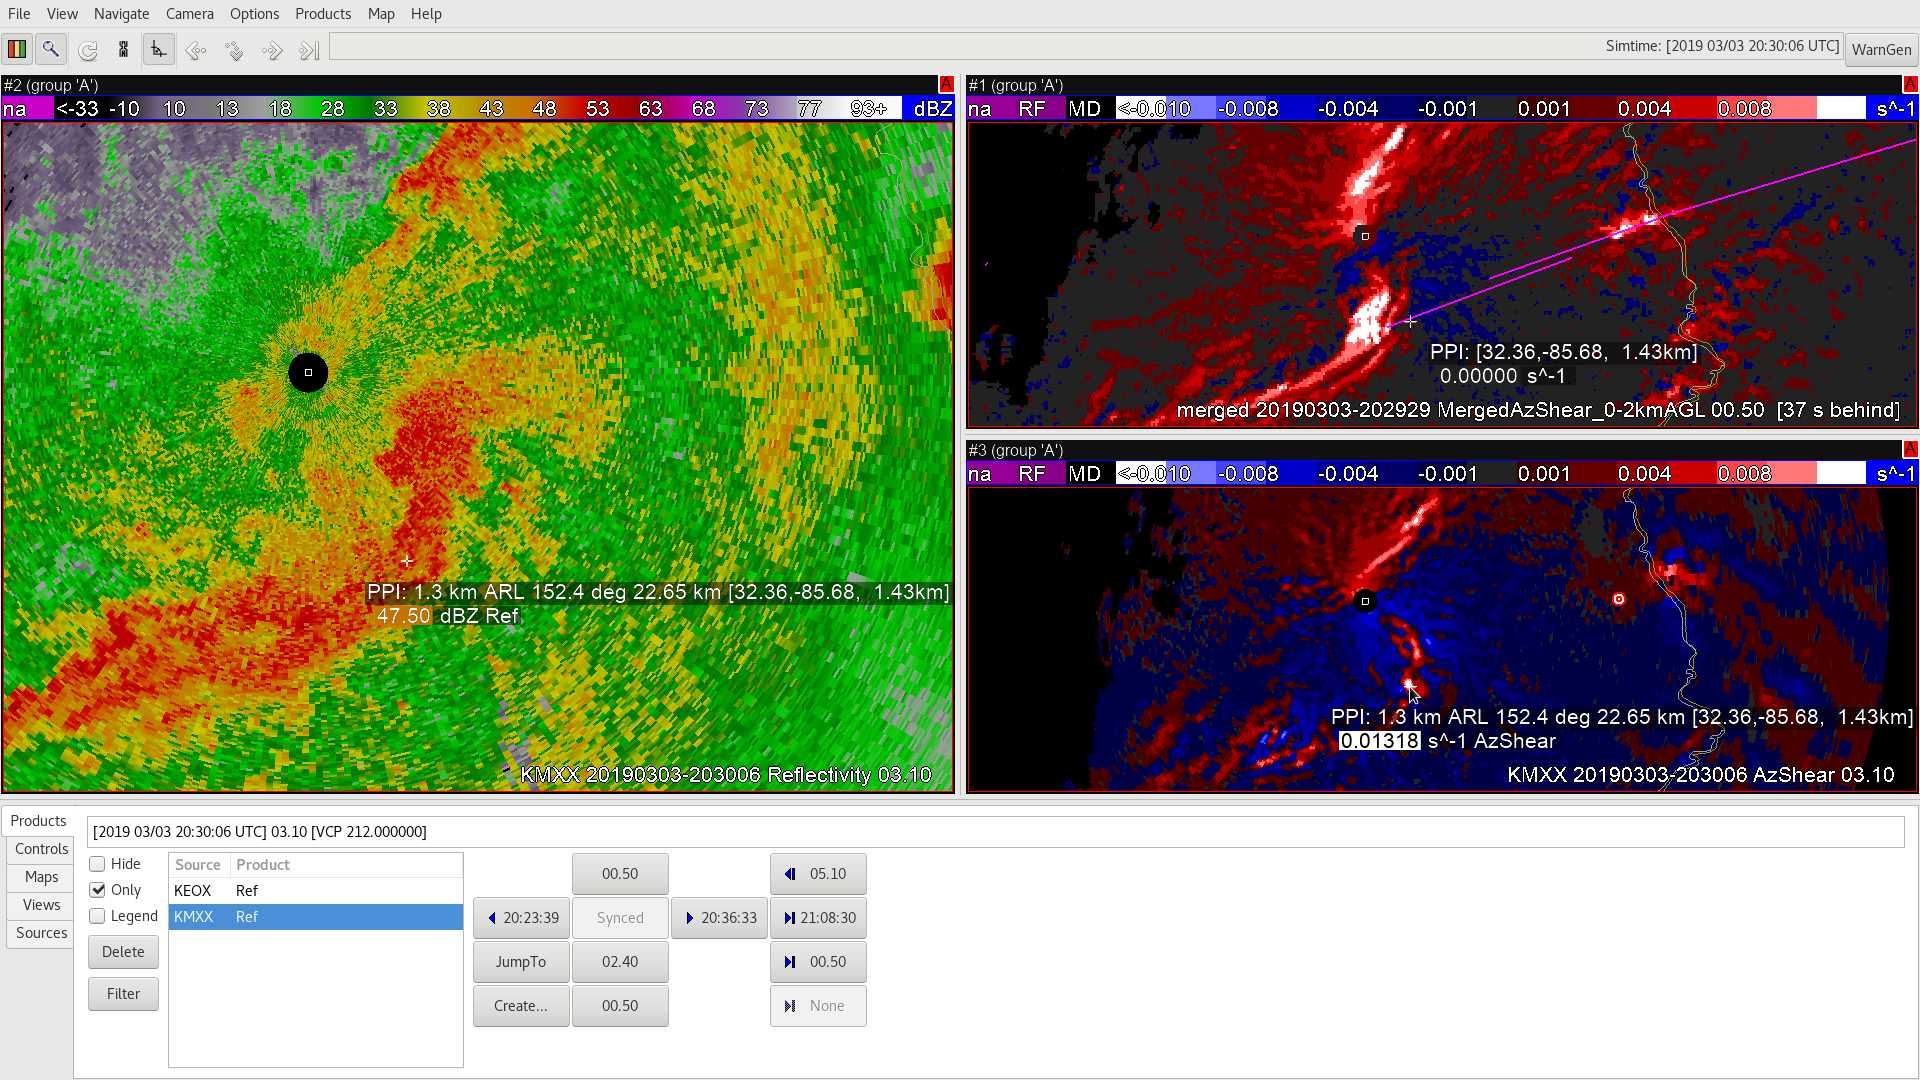
The QLCS feature in the single-radar AzShear has a better focus and greater “resolution” of small-scale features, versus the merged 0-2km AzShear product. See image below and the mouse location of the center. The maximum center is also farther ahead of the maximums in the merged product, which is important to realize when issuing a tornado warning.  Also of note, the supercell to the northeast that is producing a tornado track is indicating multiple AzShear couplet maximum locations for the merged product (above right) vs the regular AzShear product (lower right).

I, personally, find the single-radar AzShear product closest to the radar the most useful for identifying a potential for low level tornadic circulations. I would use the 0-2km merged radar product as perhaps a “big picture, earlier lead time” type of product during the initiation stage of features.  -shearluck

Marginal Day in the HWT

Forecasters are beginning the day located in both the Melbourne, FL and Kansas City/Pleasant Hill, MO CWAs each with very different environments.

SPC Day 1 Outlook 14 May 2019

Ongoing convection with a focus on lightning is in store for forecasters in the MLB location.  A (semi-stationary) frontal boundary across central Florida combined with the sea-breeze and plenty of low-level moisture is providing a decent environment for storms capable of producing lightning and high winds.

Surface observations and radar over the SE United States

Forecasters beginning in the EAX region will likely be diagnosing the environment and pre-convective initiation products for the first half, if not majority of the operational hours today.  Later today, we expected isolated convection to develop with enhanced lapse rates and associated increase in CAPE as well as increased low-level moisture.  The HRRR doesn’t initiate convection until ~0200 UTC, but hopefully we will see activity a bit earlier.


-Kristin Calhoun


Tags: None

Convection on LL PW Gradient

Convection began along a low level PW gradient across NW OK per GLM Flash Extent Density. Expected forecast: Based on steering flow, the storms should move into a more moisture rich environment and expand in coverage.

2027Z Upper Left: TPW, Upper Right: Sfc to 0.9 sigma PW, Bottom Right: 0.9 to 0.7 sigma, Bottom Left: 0.7 to 0.3 sigma PW

A little while later…Storms continued to expand eastward along the gradient into the more moisture rich environment.

2228Z Upper Left: TPW, Upper Right: Sfc to 0.9 sigma PW, Bottom Right: 0.9 to 0.7 sigma, Bottom Left: 0.7 to 0.3 sigma PW

-Tempest Sooner

Event Density with RGB Composite VIS/IR Sandwich

Image 1 shows the  GOES16 RGB Composite VIS/IR Sandwich.  This product displays the texture of the convective cloud tops and the temperature of those cloud tops.  The texture and temperature of the clouds provides information about the updraft.  The 2nd image shows the most intense GOESR GLM event densities and how they correspond with the taller clouds and strong updrafts. – Jonathan W. Smith (ESSIC/UMD) .

AzShear and Tornadoes

Using AzShear it seems that possible areas of rotation are visible prior to rotation being evident on a velocity product or a hook is evident using reflectivity. Utilizing AzShear in a storm that is forecast to possibly become tornadic may help to identify the area of rotation sooner thus enabling the forecaster to warn sooner. – Desmond

Merged AzShear Vs. AzShear oh my

The first feature I noticed at first glance of all of the AzShear products was the “time lag” so-to-speak of the merged AzShear products. More specifically, I compared the velocity couplet with the AzShear product and the merged 0-2km AzShear product. The merged product shows a disconnected and smeared/cluttered version of the max shear couplet region, making it difficult to find exactly which high value center you would like to focus on.

Above is an example of those three products with my mouse over the circulation center for reference. In particular, I grabbed the 0.9deg radar tilt to get the middle of the averaged layer (~1km AGL).   Because of this multi-maximum issue in the merged product, I find the main AzShear product more useful and trustworthy than the merged product with this particular case.

In addition, I was able to pick up a “debris ball” signature at a similar time. I noticed the low CC was spatially ahead of both of the AzShear product maximum couplets. This tells me to not solely rely on a one product as the main location of greatest shear or tornadic location, just because there will be a slight spatial lag between products (more noticeable in the merged product) . This also makes it clear in making sure to continue to utilize velocity data (as is well known with debris ball signatures).  Image below:

This debris ball signature was notable at both the 0.5deg tilt and the 0.9deg tilt, so I kept the 0.9deg screen for consistency.

Lastly, I noticed the strength of the AzShear couplets began ramping up and showing maximum values in prior temporal radar scans to the debris ball signature, which is to be expected. I would be more concerned if it was the other way around. Having all of these signatures in place further verifies the strength of the system.


Az Shear Tornado

Just before tornado development, AZ shear showed increasing values and non-linearity of positive AzShear values along the line, indicative of a tightening/developing circulation that was not  as subjectively/visually evident on Velocity/SRM. Feel this could have helped increase warning lead time due to better warning forecaster situational awareness.


Once the tornado developed, the Az Shear product made the life cycle of the tornado more visually evident. In the image below, late in the tornado life cycle, it became  clear that tornado circulation was becoming cut off from the storm inflow, behind a line of advancing outflow. If a warning forecaster were considering reissuing a TOR, this could help provide information that the current tornado may be ending soon. In the second image below, spectrum width could be used to try and visualize this process as well, but note that AzShear is much less noisy.


Comparison to MRMS AzShear: Overall found the MRMS AzShear products were useful for  situational awareness. However, artifacts in the data, like double maxes (seen below, upper left panel) due to old radar data lingering too long, limits the usefulness for in depth interrogation. It also washes out the details in storm/tornado evolution noted above. Would much rather have single radar site AzShear for warning decisions. How soon can we get this operational??

— warmbias —

unstable NUCAPS soundings east-southeast of TX convection

The 1921Z NOAA-20 overpass is now in and there are many valid soundings to east-southeast of convection in west Texas. Several soundings indicate CAPE above 1500 J/kg with a few soundings over 2000 J/kg. Below is a short loop of GOES-16 channel differences between 1.6-2.1 microns and the NUCAPS sounding quality control.

The black circle indicates the selected NUCAPS sounding depicted below with MUCAPE of 2188 J/kg.

This sounding (centered on Edwards County) as well as neighboring soundings were obtained over fairly homogeneous terrain and surface topography doesn’t appear to be complex and therefore problematic for near surface layers. These soundings are near the edge of the NOAA-20 swath, thus they are much larger than the nominal 45-km spatial resolution at the center of the swath.

Brian Kahn

AzShear – Focus on the negative

One of the great things about AzShear that is not available with rotation tracks – negative values. There is a strong couplet of bright red (positive shear) just to the right of bright blue (negative shear) towards the bottom left.  What does this mean? My hypothesis is that we’re seeing anticylonic flow with a maturing RFD on the rear flank of the mesocyclone. You’ll see these shear couplets become quite apparent  coincident with supercell tornadogenesis! Several examples of this in previous blog posts. If you look closely there is a verified tornado track to the east just east of the state line. Be interesting to see how this evolves!

Next, look at the kink in the AzShear line farther north. This appears to be a developing mesovortex along that kink.  The orientation of the kink was normal to the 0-3km shear vector, which was very strong. The AzShear here is much noisier here overall due to the messier storm mode and the much smaller velocity bin sizes close to the radar.

#MarfaFront

Low Level Rotation in QLCS

Looking at a tornadic QLCS event in eastern Mississippi, low level rotation is clear in both the 0.5 degrees SRM and Single Radar Az Shear. At 0.5 degrees, the radar is looking at approximately 1.94km ARL.

0.5 degree Az Shear, SRM and Reflectivity

At 1.8 degrees, as typical with QLCS tornado events, the rotation is present but not as strong. At 1.8 degrees, the radar is looking at approximately 4.45km ARL. The AZ Shear color curve still does a good job of highlighting the area of concern.

1.8 degree Az Shear, SRM and Reflectivity

Last I looked at the 0-2km merged Az Shear. There is clearly two areas near each other with high Az Shear values, which is clearly an artifact of either merging multiple levels and/or multiple times. As seen above, there is only one area of rotation. For this reason, I might prefer to look at the single radar non-merged Az Shear over the merged Az Shear — but will wait to see additional cases.

Merged 0-2km Az Shear

-Tempest Sooner