Today we focused on the Pueblo, Colorado CWA for afternoon High Plains convection. Scattered convection developed across the CWA leading to large hail and damaging winds. The first Severe Thunderstorm formed on our CWA border with Albuquerque and drifting south into their CWA. A second Severe storm developed and tracked north towards our DSS Event in Pueblo, bringing the potential for large damaging hail and strong winds.
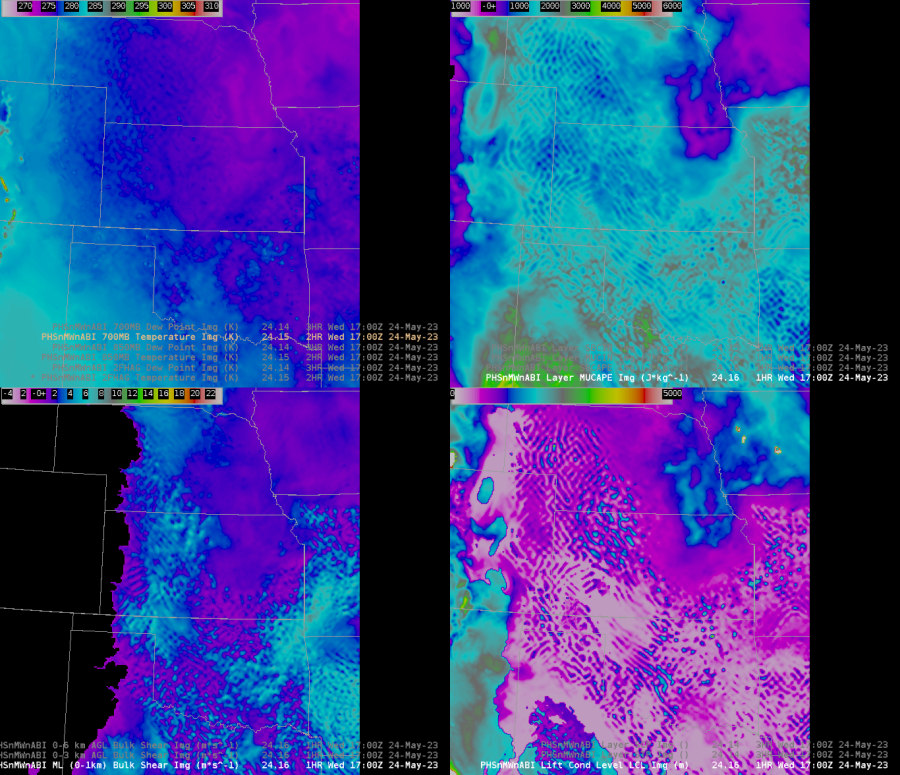
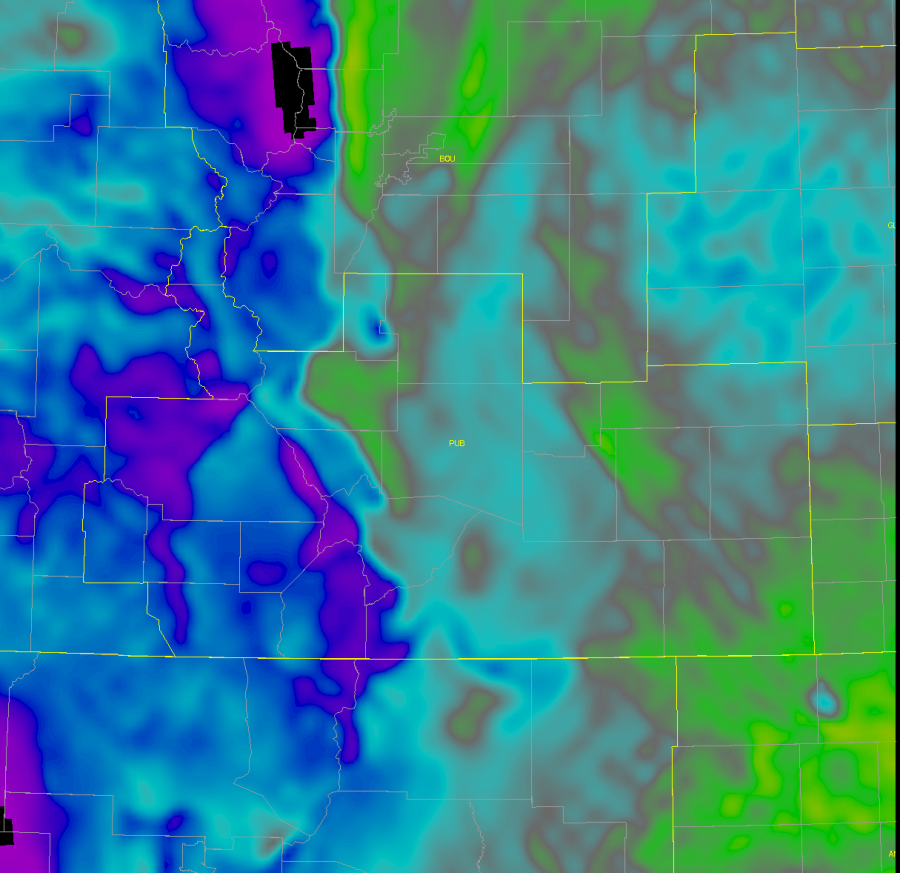
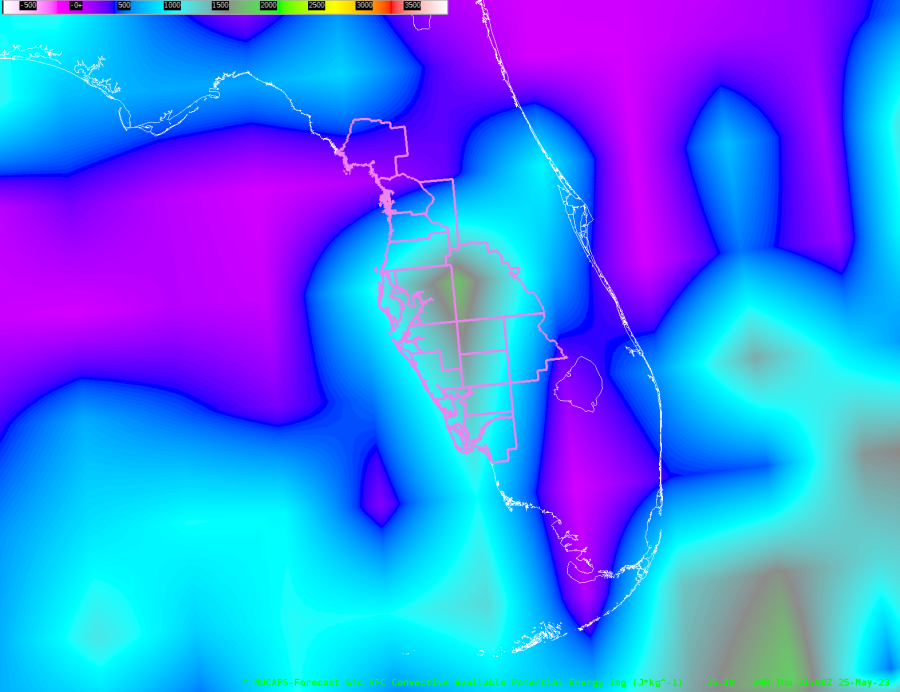
15Z PHS MUCAPE valid at 18Z showed around 2000 to 2500 J/kg for green areas while areas in blue had roughly 1000 to 2000 J/kg.
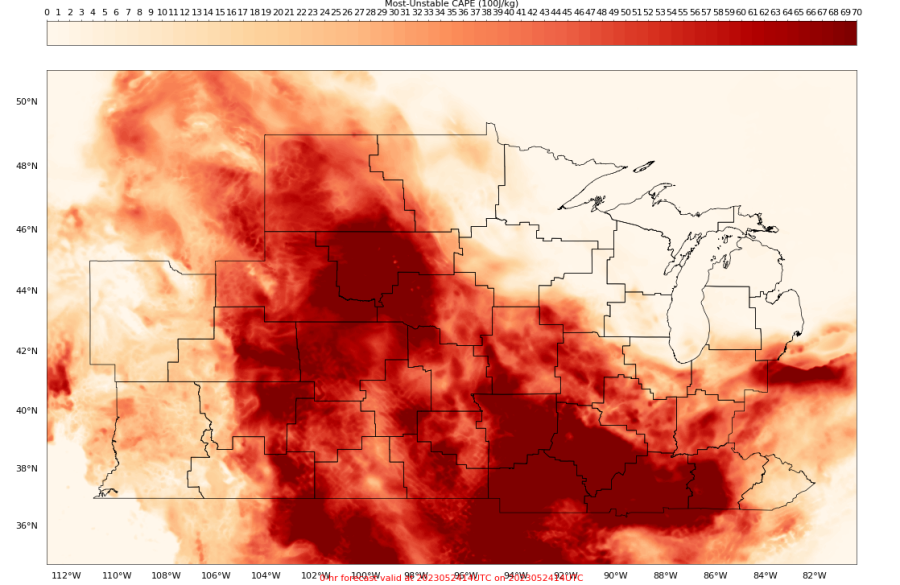
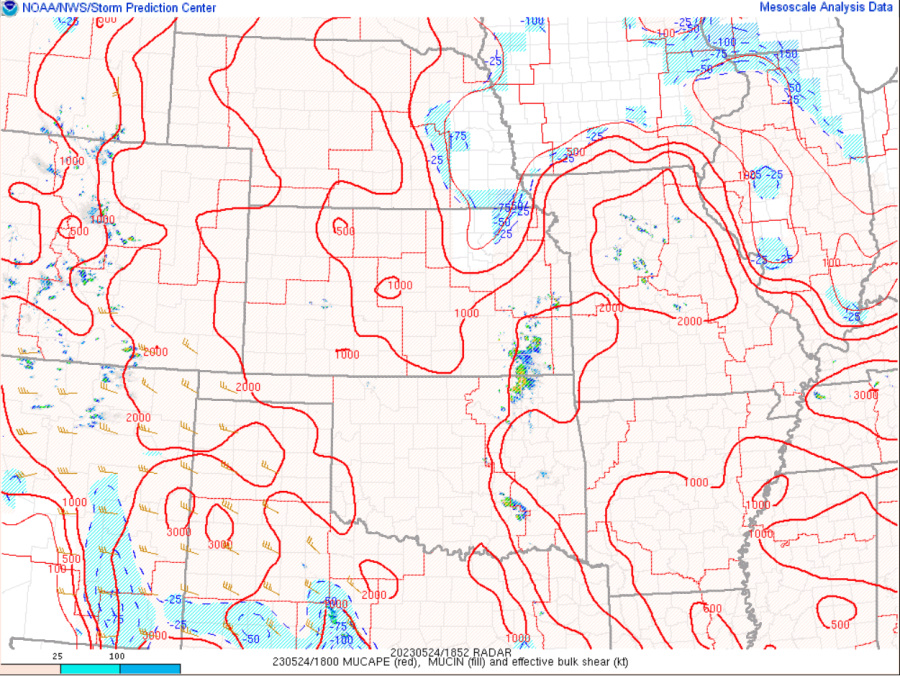
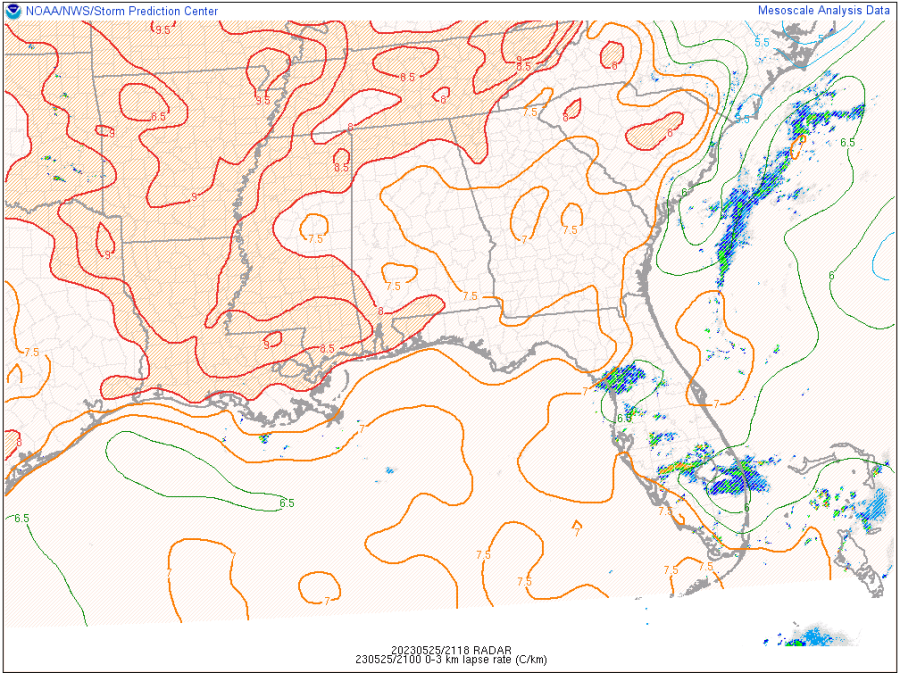
 SPC MUCAPE Mesoanalysis valid at 18Z shows similar trends to the 15Z PHS MUCAPE values.
16Z PHS valid at 21Z showed a slight upward trend of MUCAPE in the eastern half of the CWA. 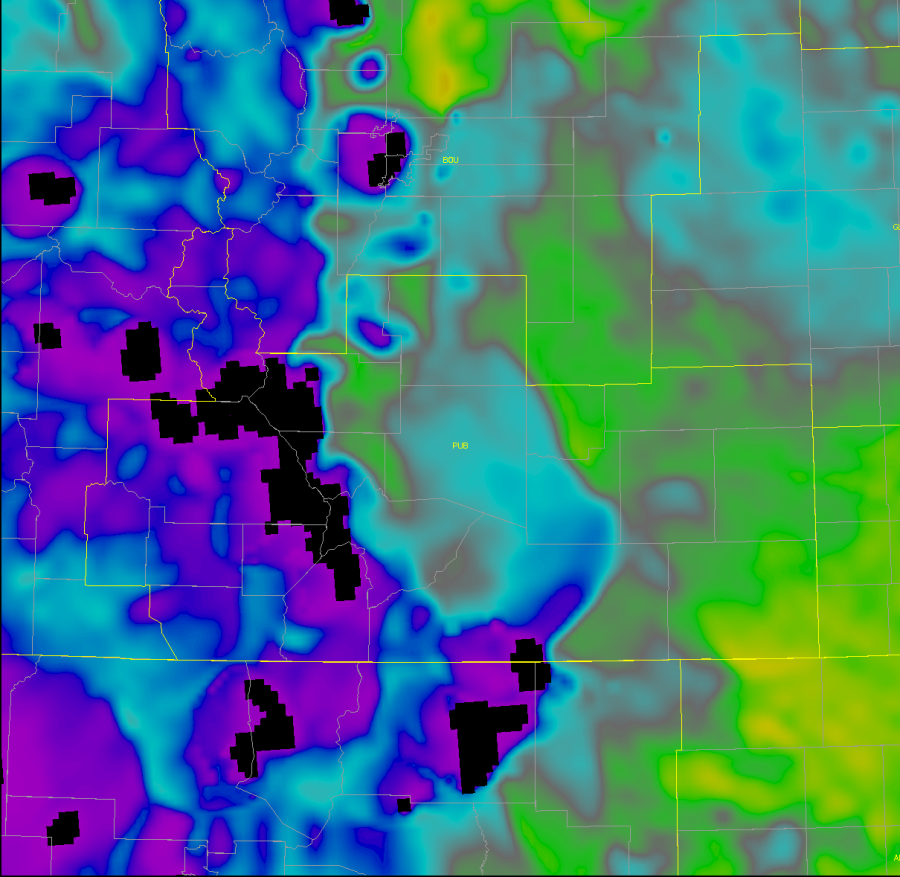
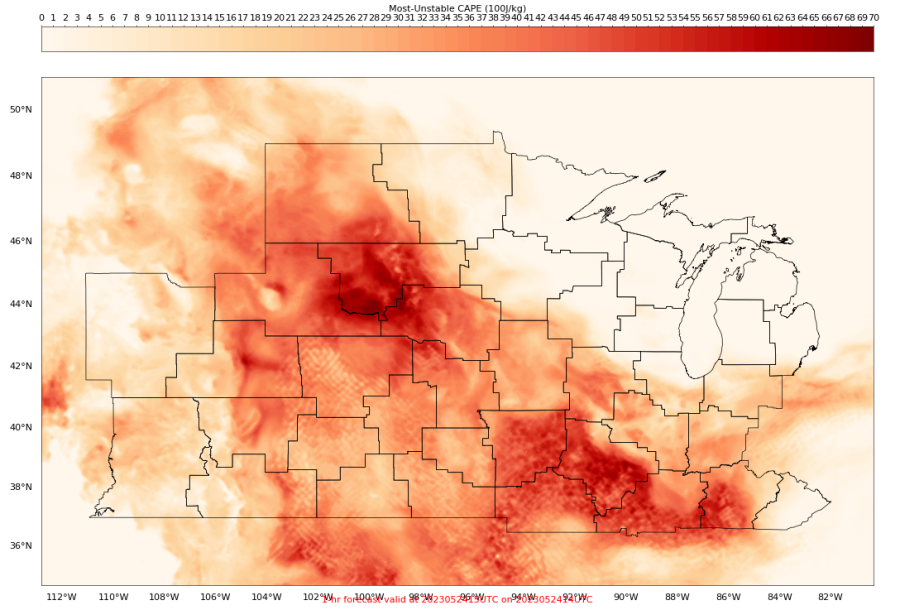
21Z SPC Mesoanalysis showed increasing values of MUCAPE developing just south-southeast of the CWA, similar to the 16Z run of the PHS shown above. 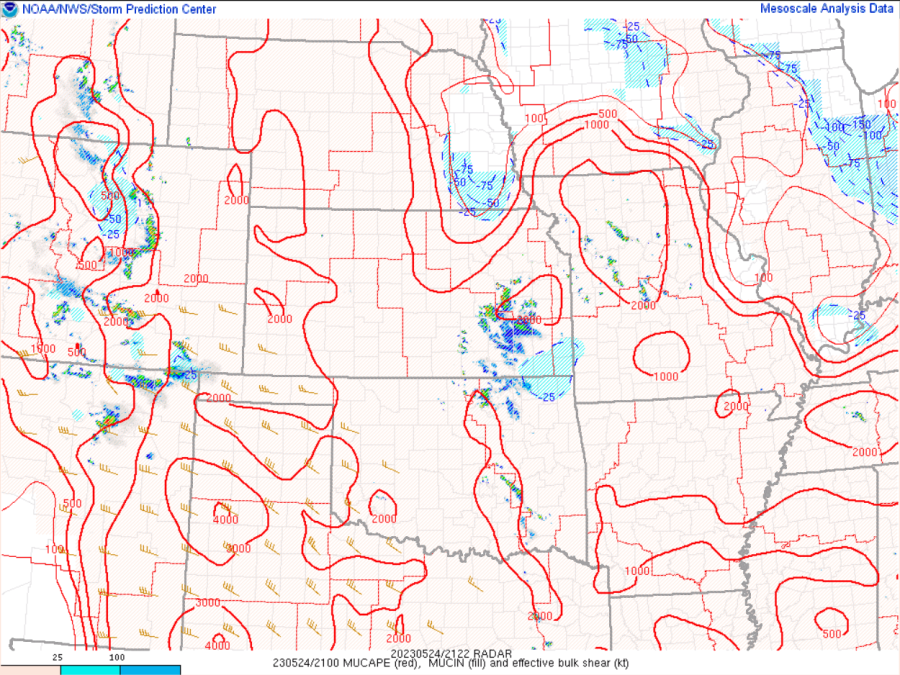
15Z PHS STP valid at 18Z showing little overall threat for tornado concerns through early afternoon, for the most part values were less than 0.25. 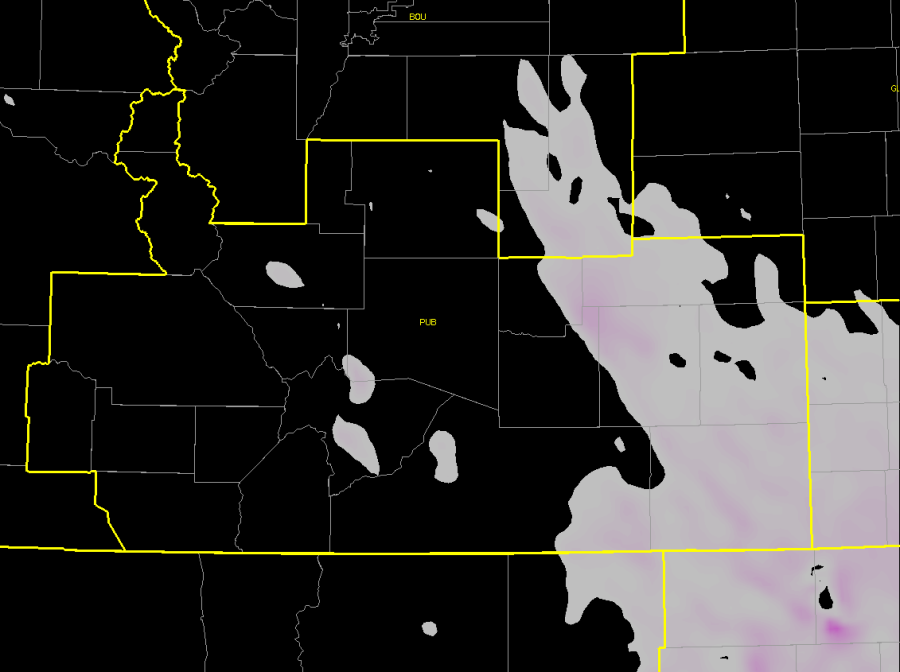
SPC Mesoanalysis page showing 18Z STP values similar to the 15Z PHS forecast. 
The image below shows the Octane Speed product on the left and the Octane Direction product on the right, focusing on a cluster of activity near the Jefferson/Douglas County line in Colorado. Picked this screen capture as it showed a wide range in values, mainly for the Direction product. The Octane Speed product shows some speed shear present with the lighter speeds (darker blue, ~5 kts) transitioning to brighter green/a bit of yellow (~30 kts). The magnitude of directional shear was higher, showing direction of motion/divergence ranging from ~170 degrees (core of red area) to ~295 degrees (core of green area).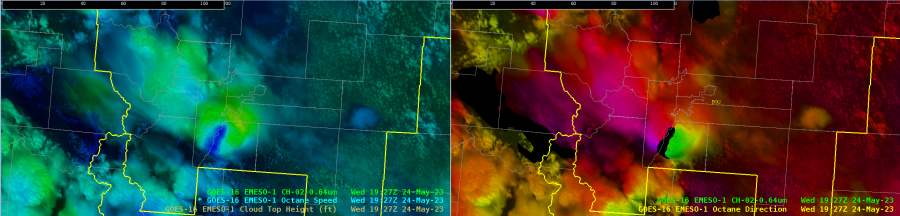
Below is a animated graphic showing the transition in both products. 
———————————————————————————————-
Chose to grab this Octane Direction product screen capture as it shows an elongated area of storm top divergence through central Colorado. The red/magenta colors show direction generally from the 170-190 degree range, while the green/yellow colors show values from the 275-285 degree range. The black areas are spots of data dropout, which can occur when the speed shear product drops below 5kts.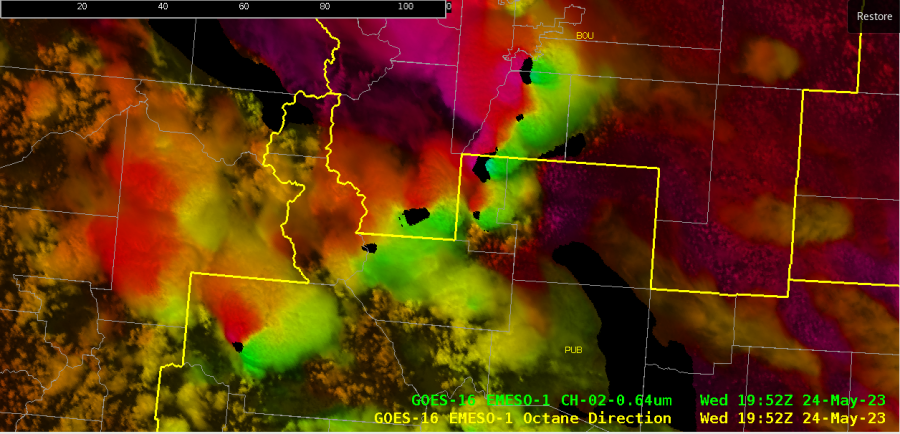
———————————————————————————————-
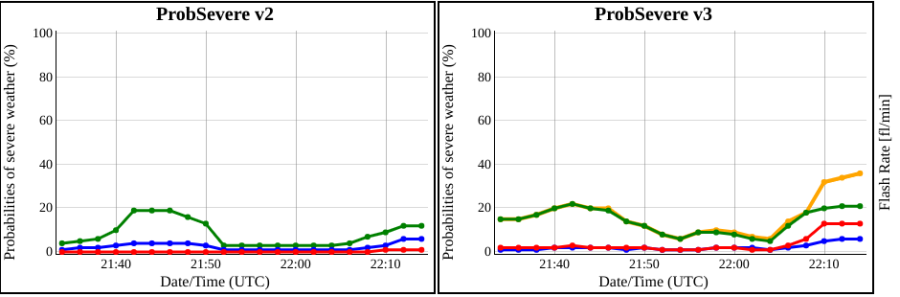
First Severe Thunderstorm Warning issued for this area today came right after 20Z, based on ProbSevere values/time series as well as the Octane Speed Sandwich product. 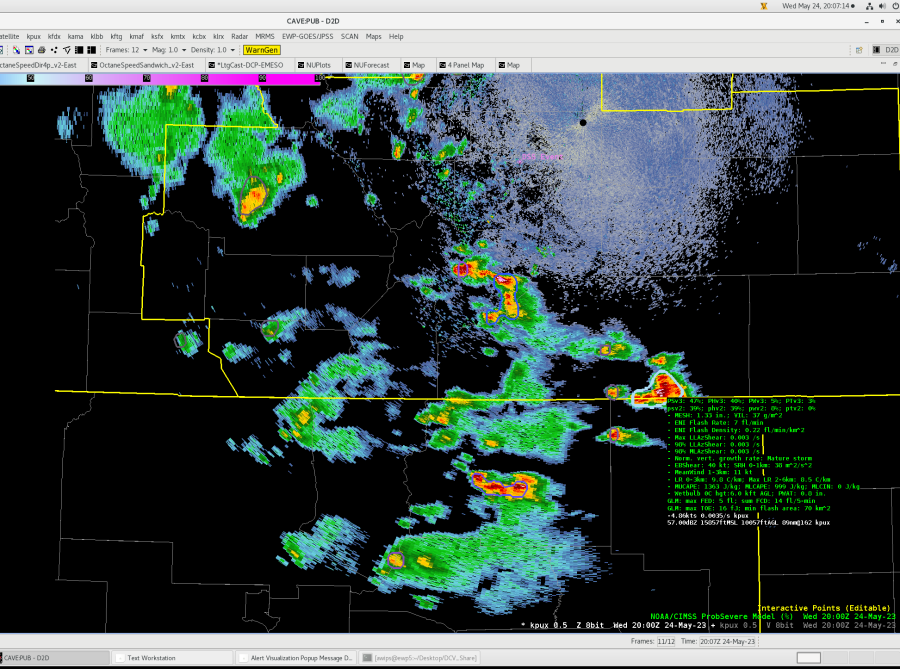 Probabilities ramped up quickly for both ProbSevere and ProbHail on this storm at the edge of the PUB/ABQ CWA boundary.
 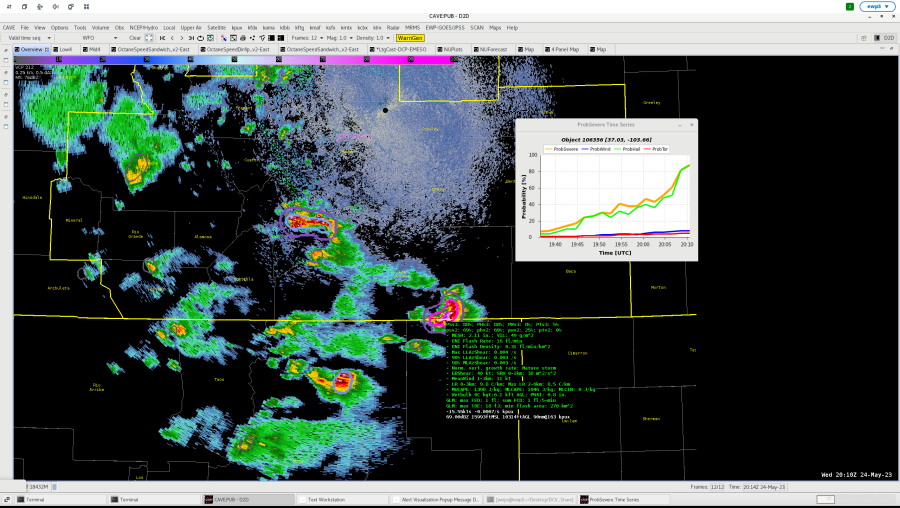 Octane around “peak” of the storm.
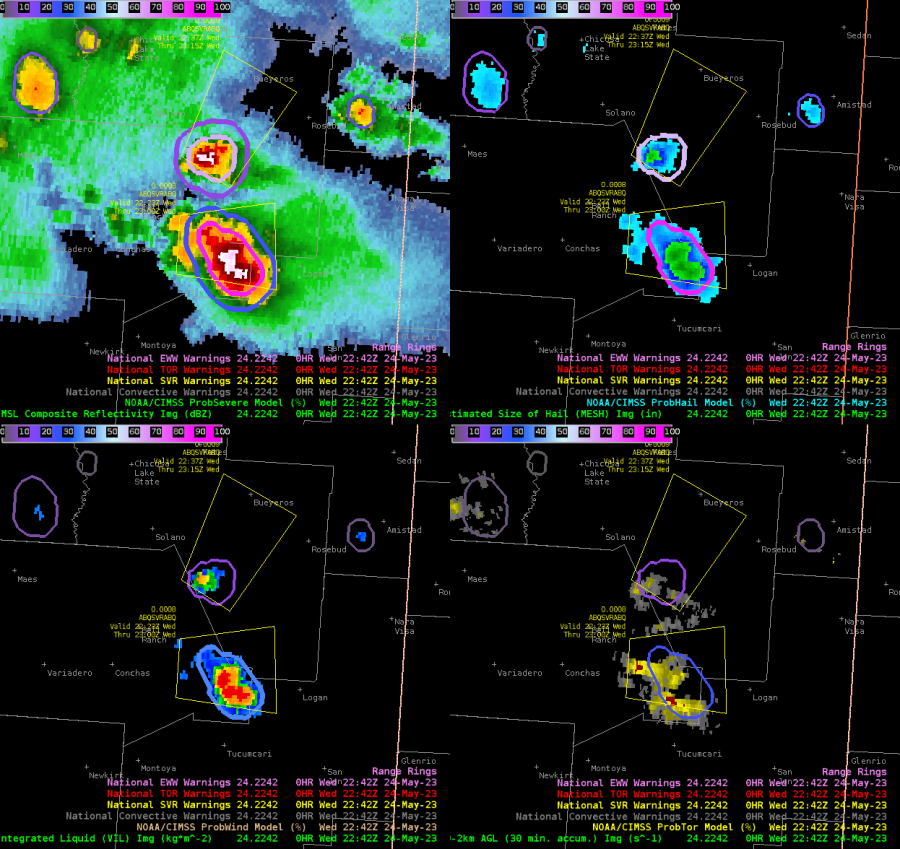
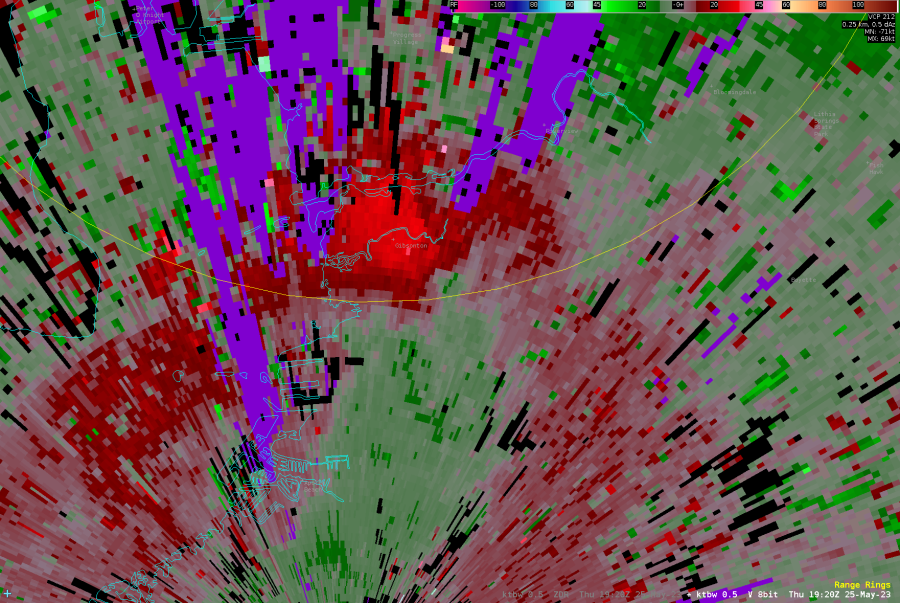
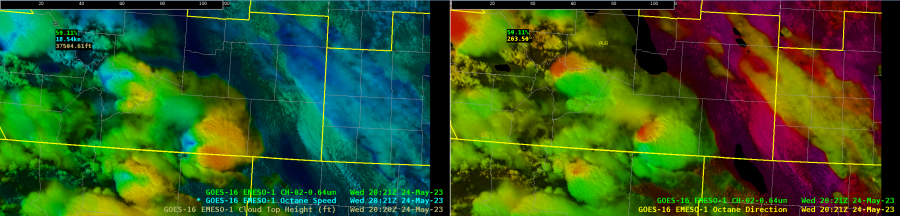 Low Level SRM and ProbSvr (0.5 deg slice is about 10.8k ft AGL)
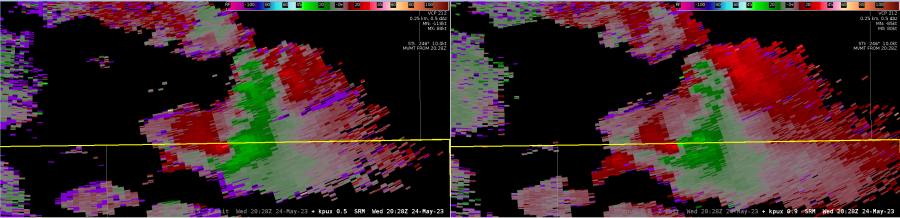 Mesh showing 3 inch hail on the border of the Pueblo CWA.
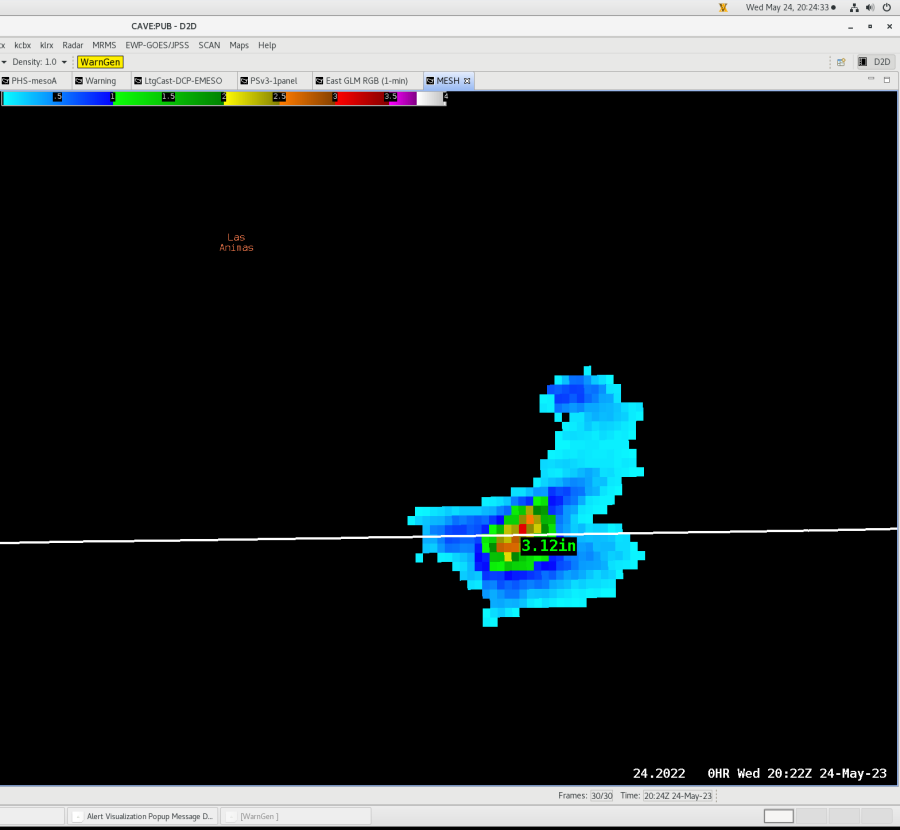
ProbSevere and ProbHail maxed out at roughly 90% while the storm remained severe. This storm eventually moved into ABQ’s CWA.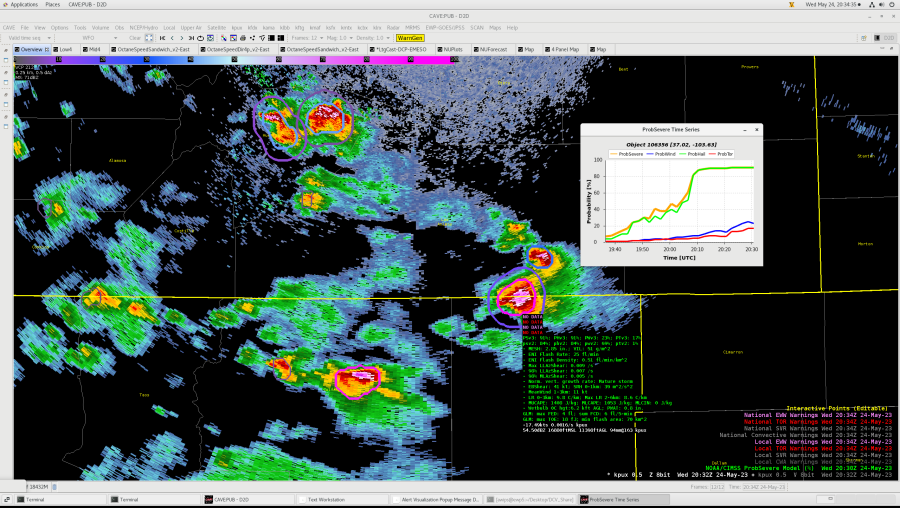 ———————————————————-
2nd Severe Thunderstorm Warning – Huerfano County
ProbSevere values and time series for 2nd Severe Thunderstorm Warning of the day, readout is at its “peak”…around 2045Z.
 Octane Speed/Direction at “Peak” of the storm, around 2045Z. Directional shear varied from ~205 degrees (reds) to ~285 degrees (greens).
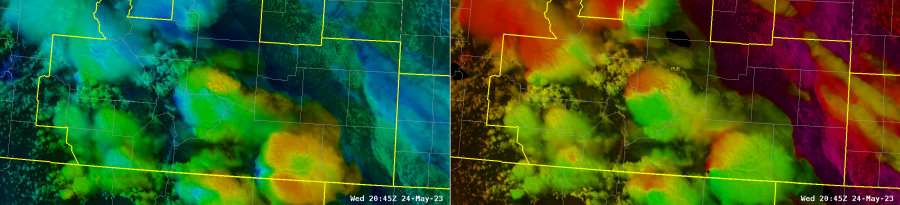
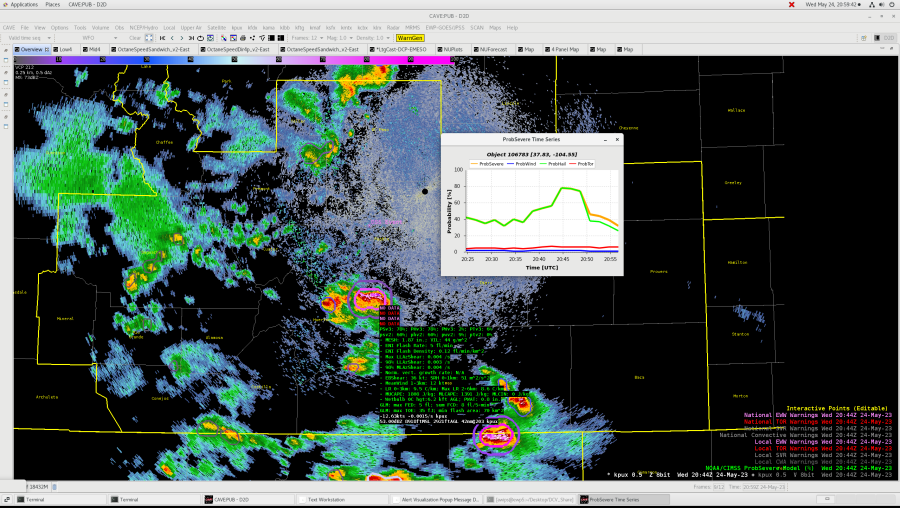
ProbSevere showing the weakening trend of the storm gave us confidence that the storm was in fact weakening. 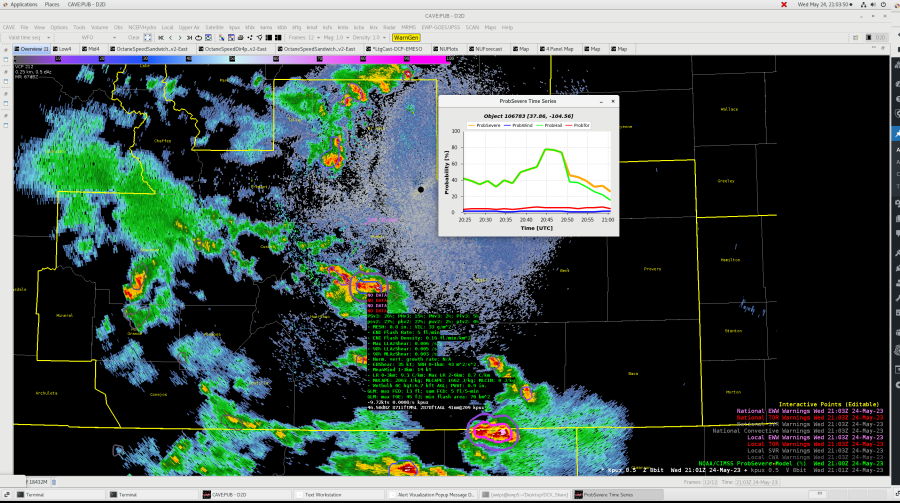 Octane speed/direction further confirming the weakening trend as colors become more diffuse in nature.
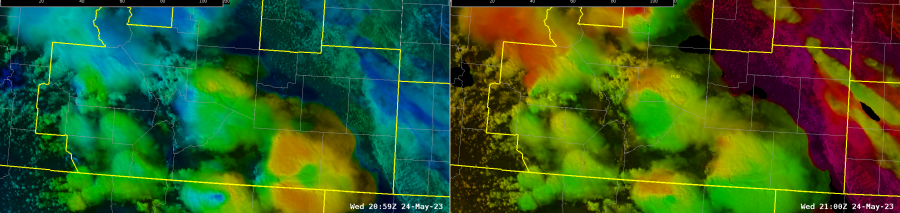
ProbSevere showing continued weakening trend. We decided not to issue another severe thunderstorm warning on this storm based on the trend.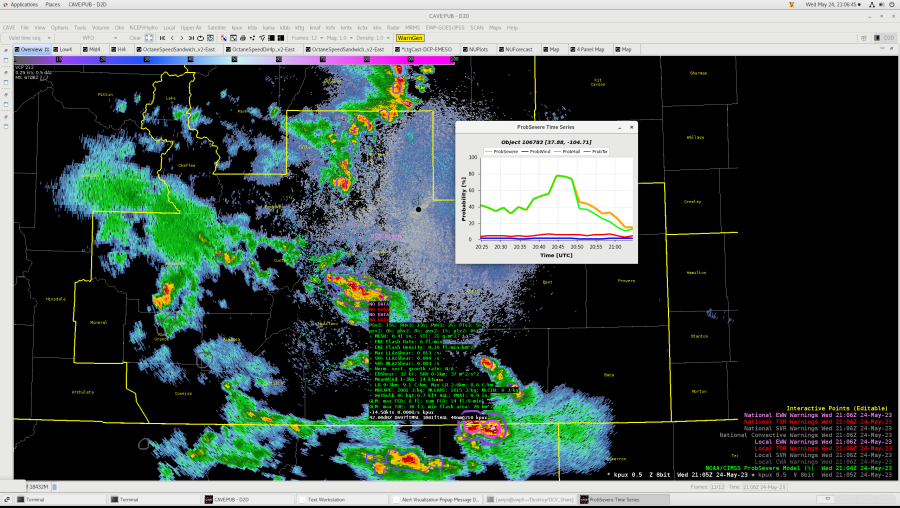
Though this storm showed a weakening trend, it was a short-lived trend, as it still had ~2000 j/kg of MUCAPE and effective shear around 30kts to work with as it tracked farther north. 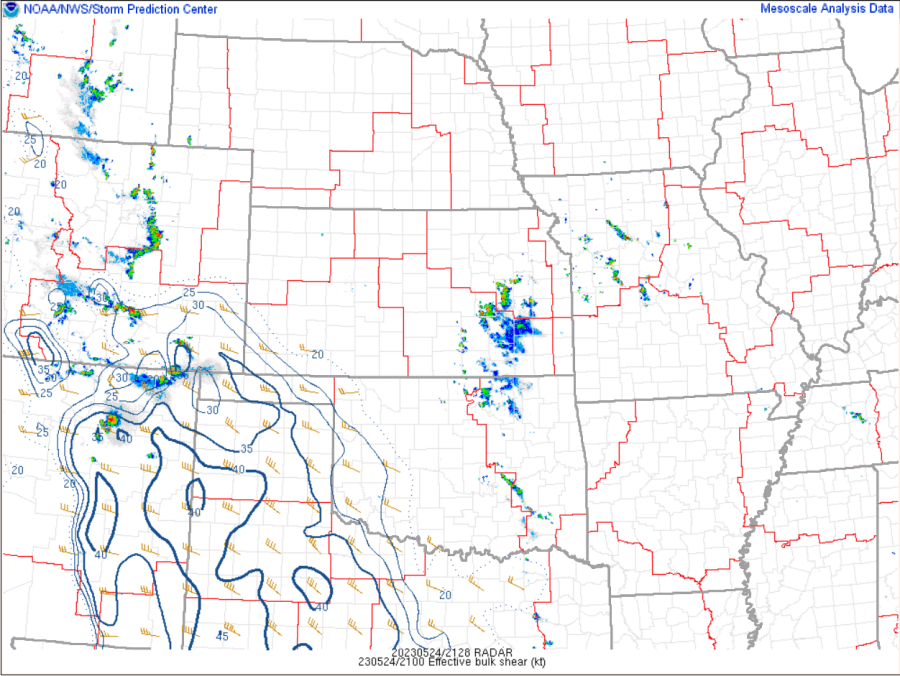
The storm ended up re-intensifying, as shown by the ProbSevere output/time series below. We went ahead and issued another Severe Thunderstorm Warning for very large hail. 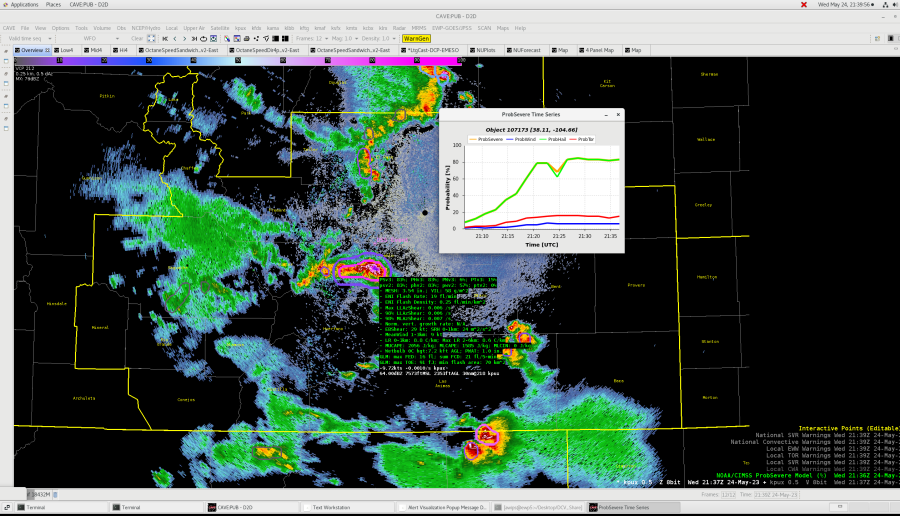 An increase in both storm top speed/directional shear was also shown by the Octane product.
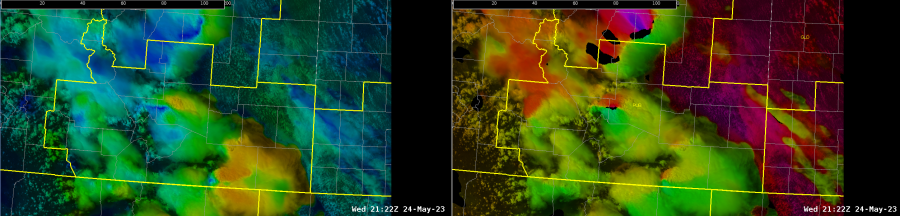 The level reflectivity images show an impressive core peaking in the 36-40k ft range, shown in the 12.5 deg. slice.
 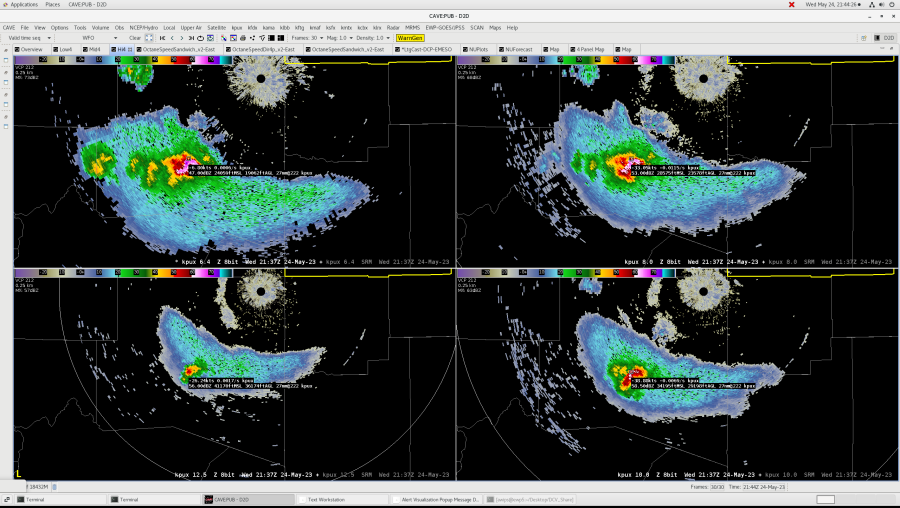 MESH showing nearly 4 inch hail south of our DSS event in Pueblo. The event was notified about the potential for large damaging hail.
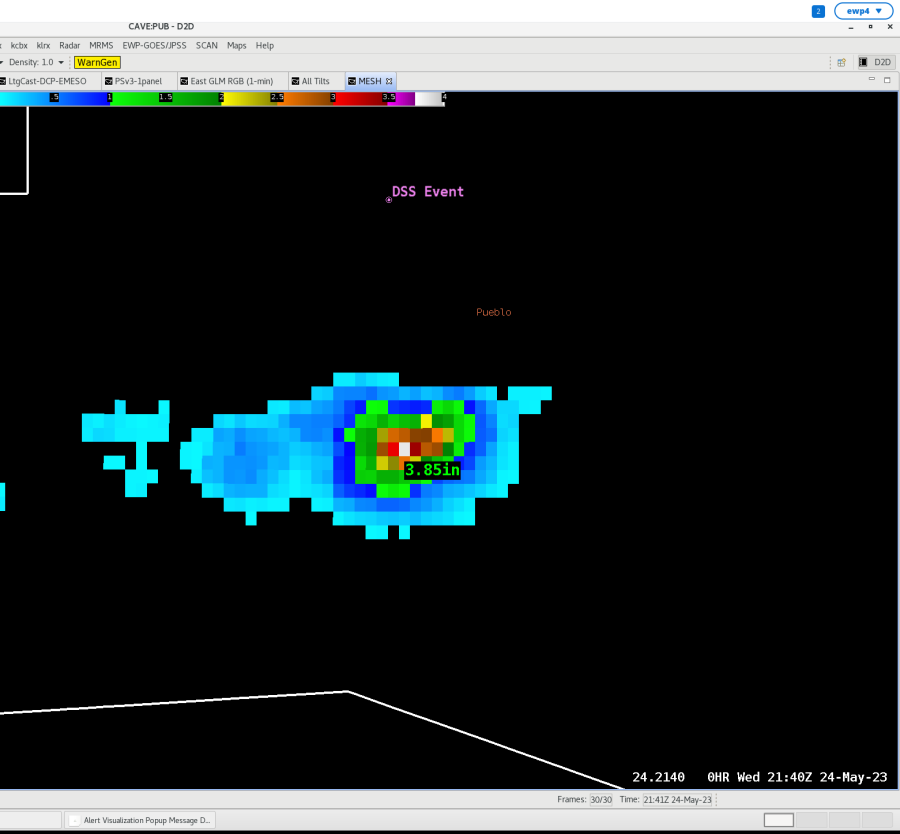
-Dwight Schrute/Bubbles

 Octane Speed Sandwich also captured the outflow boundary approaching the DSS Event.
 -Thunderstruck
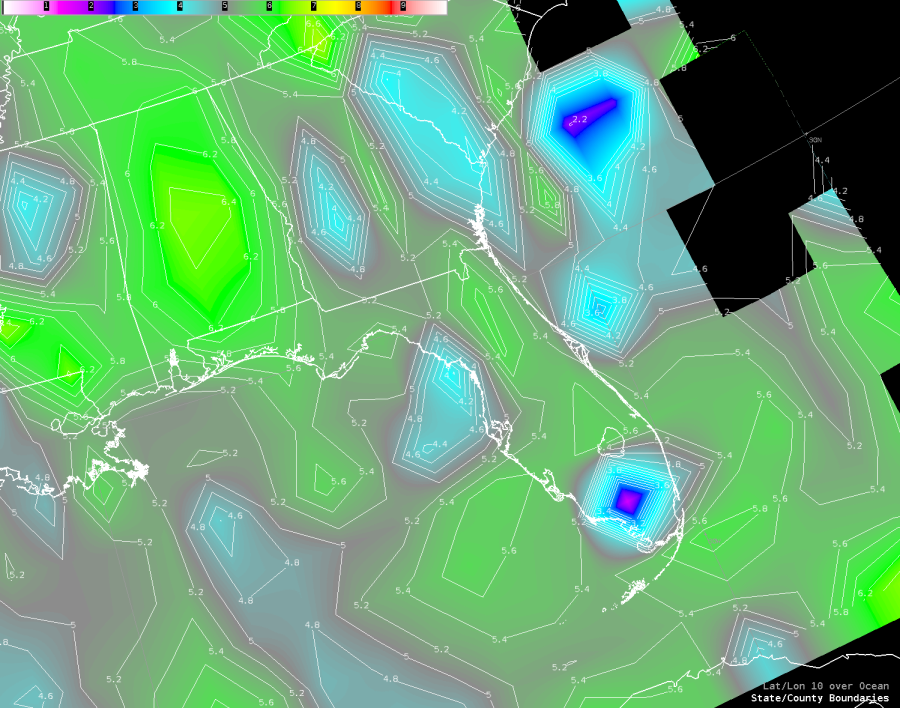
 PHS shows a similar trend to NUCAPs with higher areas of SBCAPE across the central and southern CWA with lower values across the northern half of the CWA. However, the color scale on the online version of PHS is difficult to interpret as the gradient ramps up from light red to dark red. So, you cannot really pinpoint specific values of SBCAPE. However, you are able to see areas of lower SBCAPE and areas of higher SBCAPE at a glance.
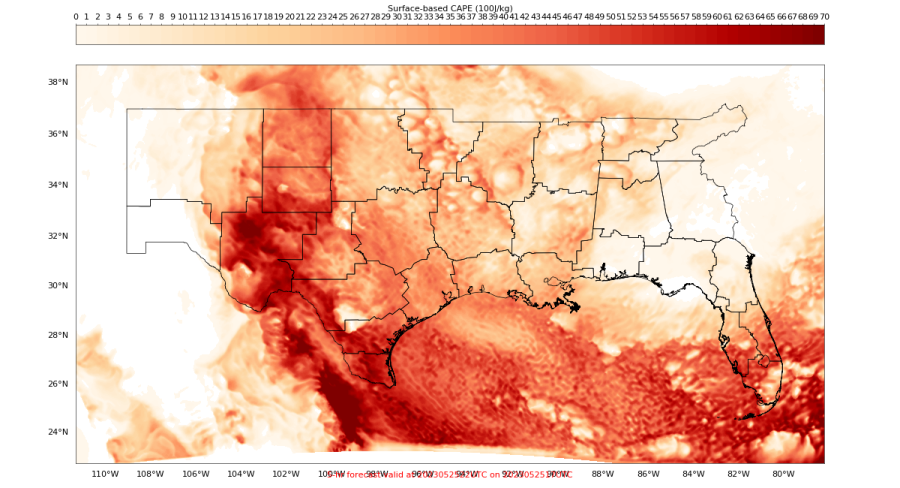
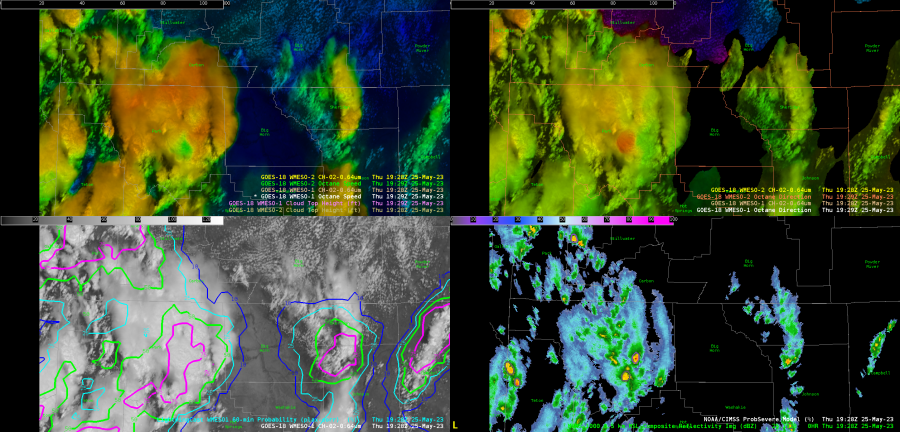
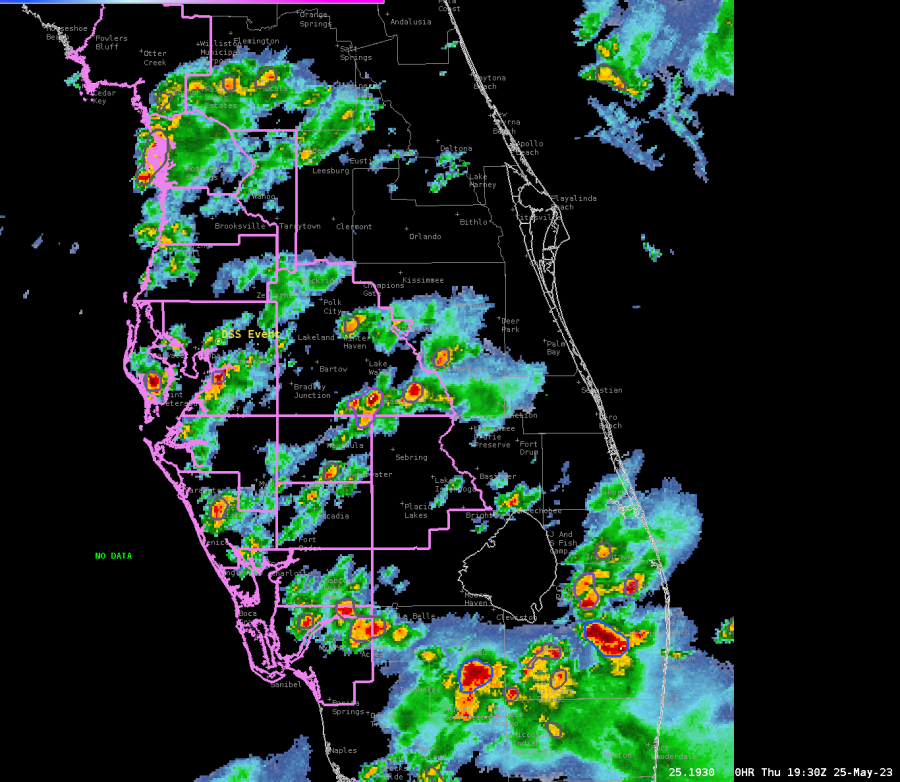 The Octane Speed Sandwich product further confirms that storms are remaining below severe limits as the strongest storms are noted over southeastern Florida this afternoon as of 1930Z. Not only do these products help us pinpoint areas of potential severe weather, but they also help us pinpoint areas of sub-severe weather.
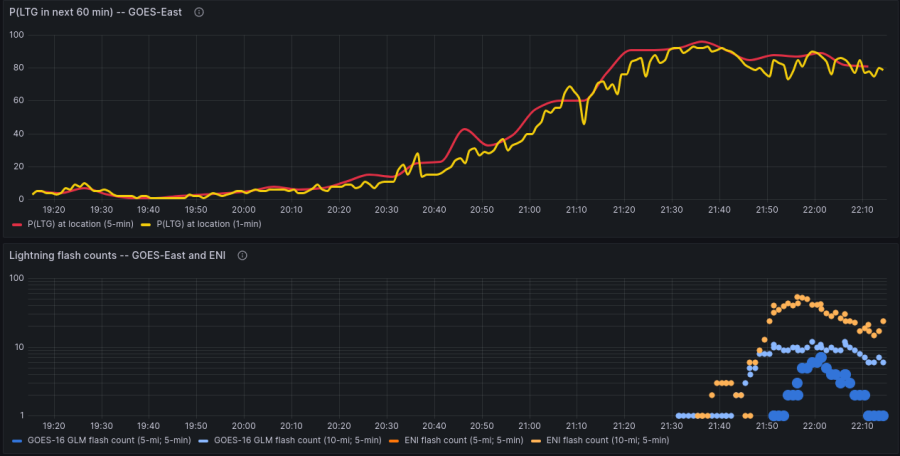
  GLM shows lightning activity increasing across the Tampa CWA early this afternoon, and activity is expected to gradually increase in coverage as more thunderstorms develop through the late afternoon and early evening hours.
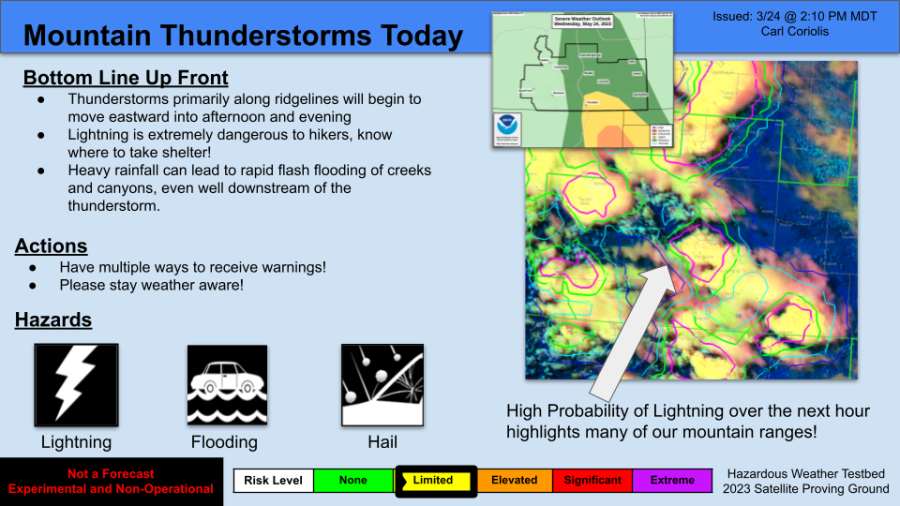
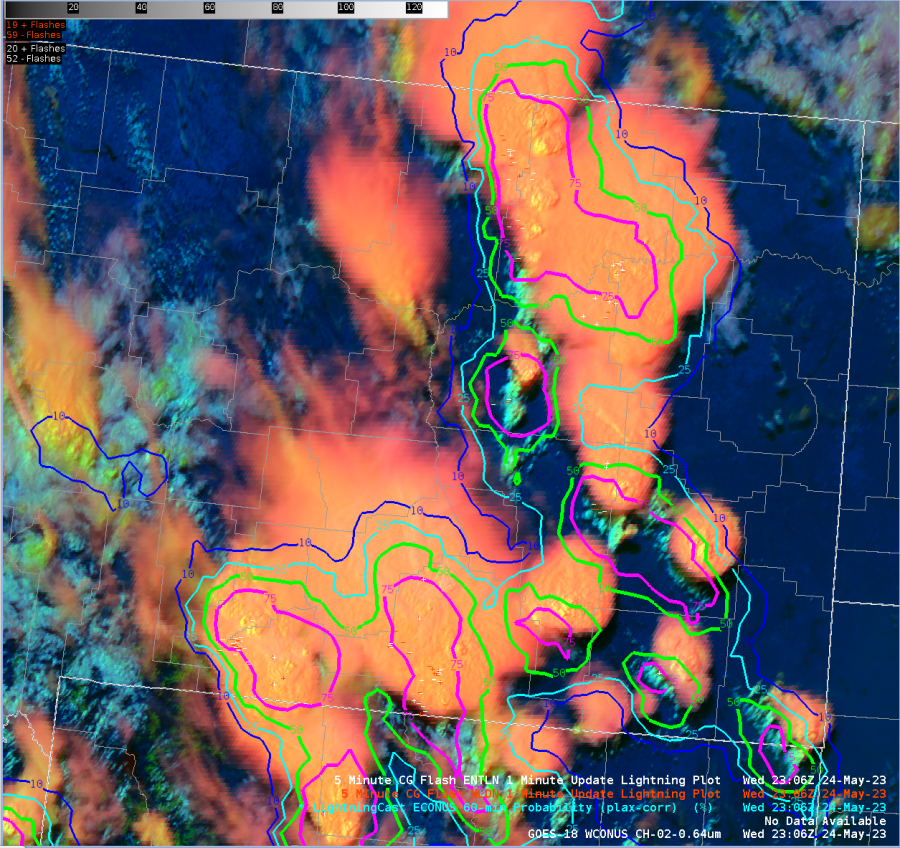
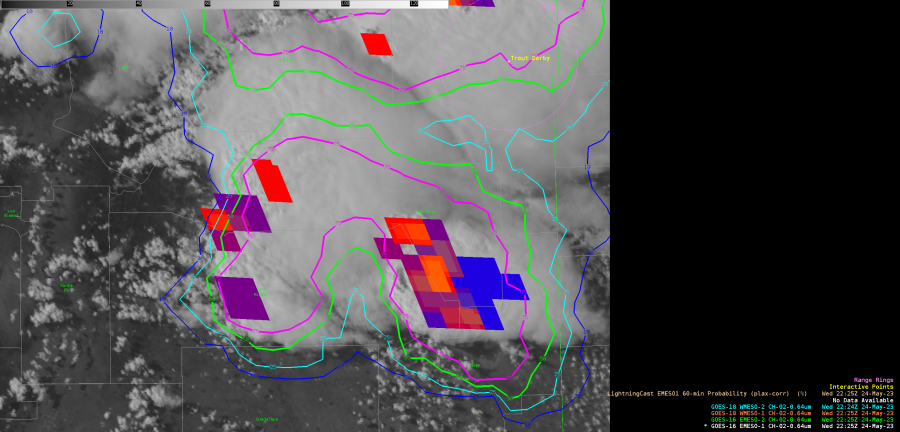
  Lightning Cast around 1930Z shows lightning probabilities increasing across the Tampa CWA over the next hour. Pink contours represent a 75% chance of lightning in the next hour. Green represents a 50% chance, teal a 20% chance, and dark blue a10% chance of lightning in the next hour.
 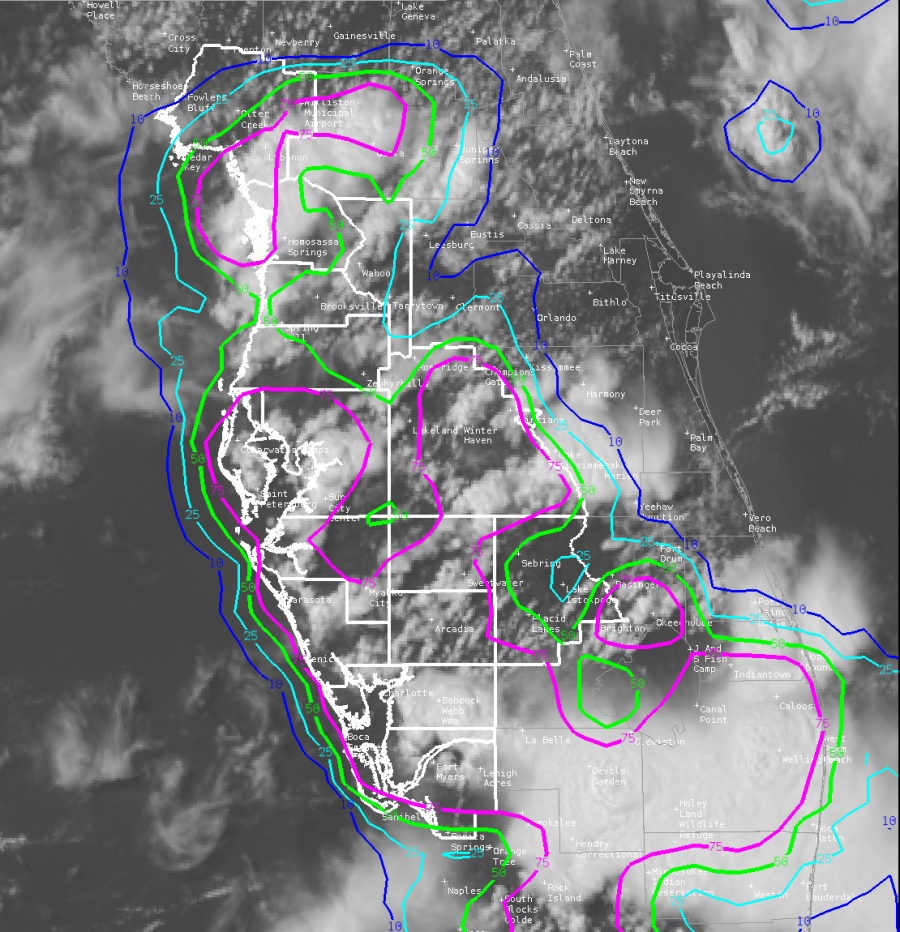 GLM showing lightning activity increasing across Florida from 1930Z through 2016Z across the Tampa CWA. Areas showing more oranges and yellows have shorter flashes and more lightning density. These areas help us know where stronger updrafts are located. The strongest updrafts at the time of this loop remain outside of the Tampa CWA.
  -Dwight Schrute
 track a developing storm near the Florida State Fair
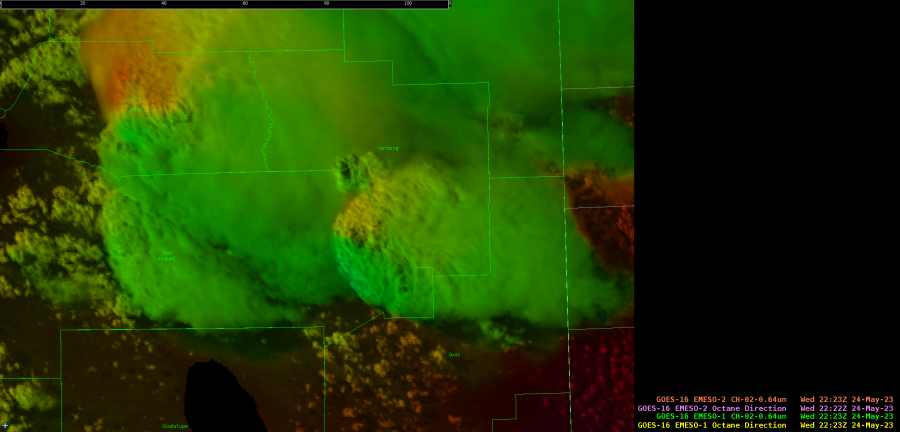 GOES-16 Octane Direction.
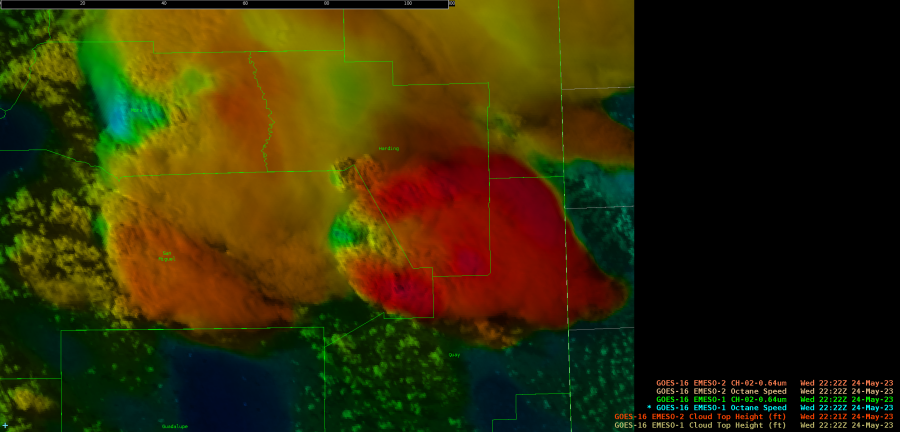
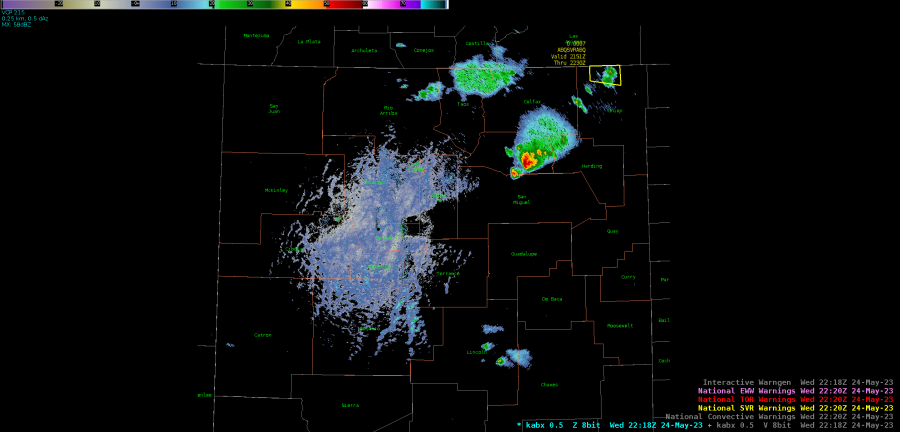
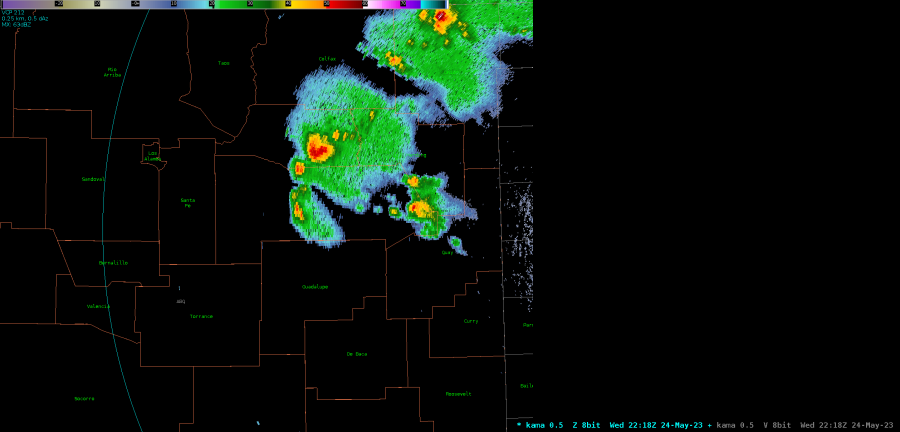
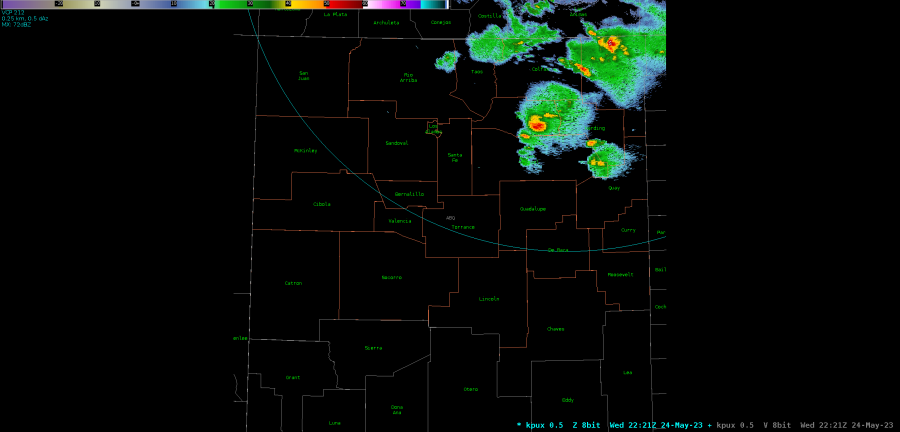 KPUX 0.5 degree reflectivity.
 _
_