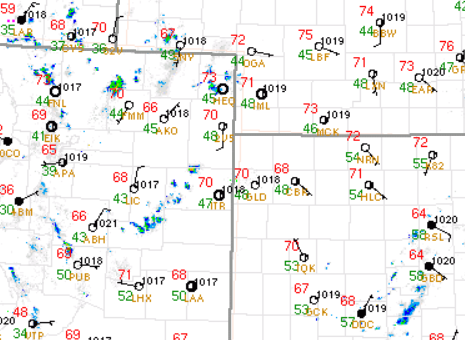
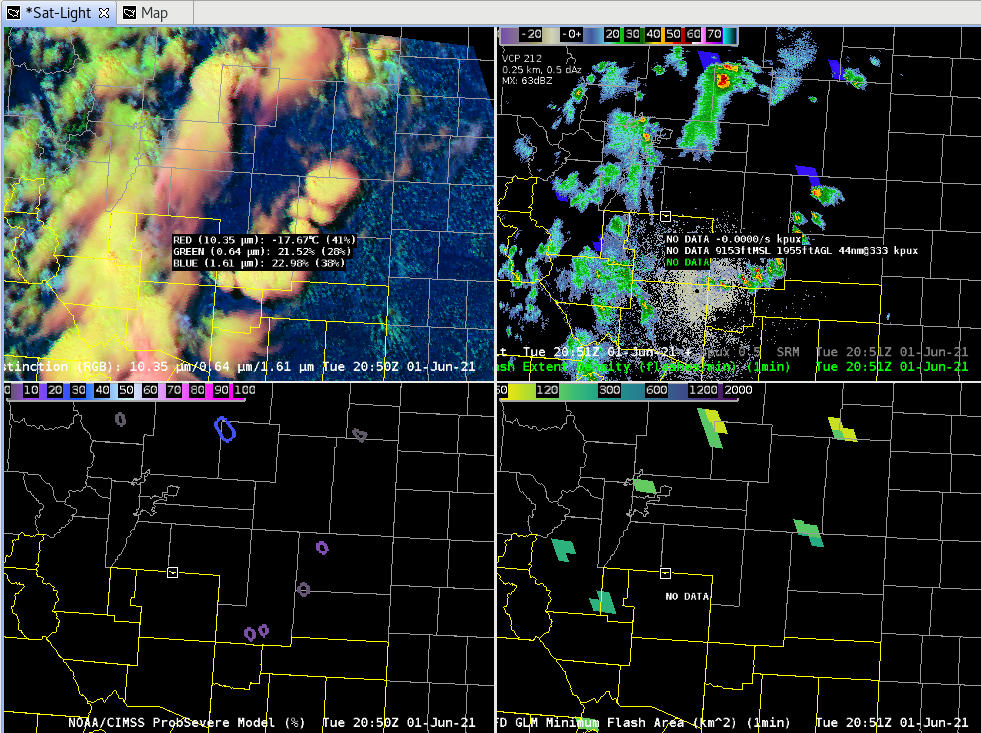
Looking at a surface map there looks to be a boundary, possibly a weak warm front, over E CO that storms are firing off of. A similar feature can also be seen in the satellite data taken at the same time.
Lightning:
The FED did not give as much information about the growth stage of the updrafts as the flash minimum area did. Also noticed the VII trend resembled a similar trend as the flash minimum area did.
The flash minimum area is also a good way to help catch the eye of what updrafts are strengthening, especially if the trend of low flash minimums persists. Great tool to use at first glance of which storms need to be watched and which don’t.
-Dwight Schrute and Accas
Saw several examples of the flash density for lightning either muting out or not showing the trend the flash minimum area was showing. In the past I have been using the flash minimum area to help me see trends in the lightning, but am now seeing that I should be using the flash minimum area instead if I want to see trends in lightning activity. I use the lightning trends to help me know if the storm is rapidly intensifying or suddenly weakening and possibly about to generate a severe downdraft. Being able to see these sorts of trends better can also help communicate a potential threat for storm intensification or severe wind development to those in the path of the storm.
-Accas
Area of coverage greater for the minimum flash vs extent density.
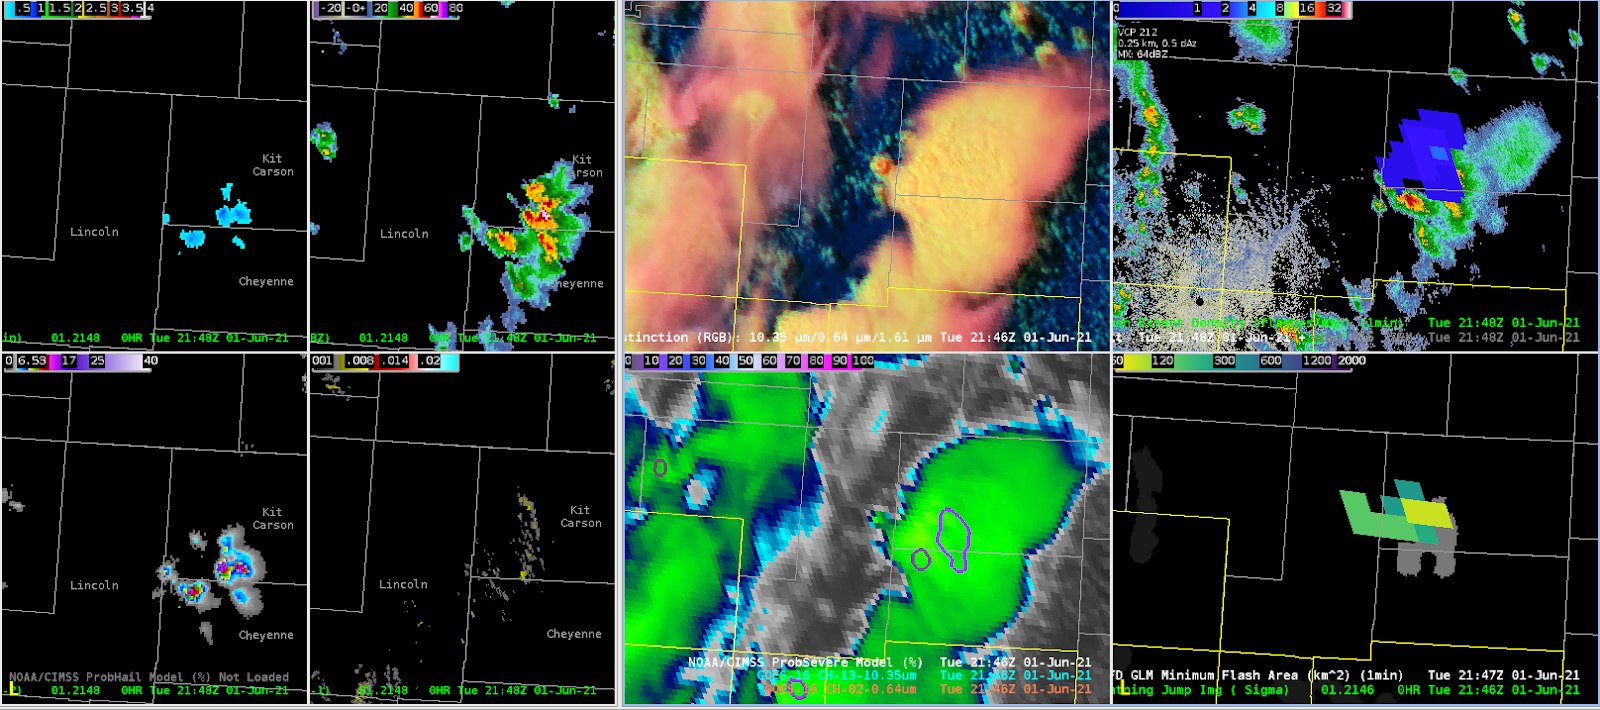
MRMS and Satellite indicating glaciation (the small updraft in the center of the satellite picture). Lightning expected, but only seen potentially with the minimum flash area product and not with the flash extent density product. Until one scan later (shown below).
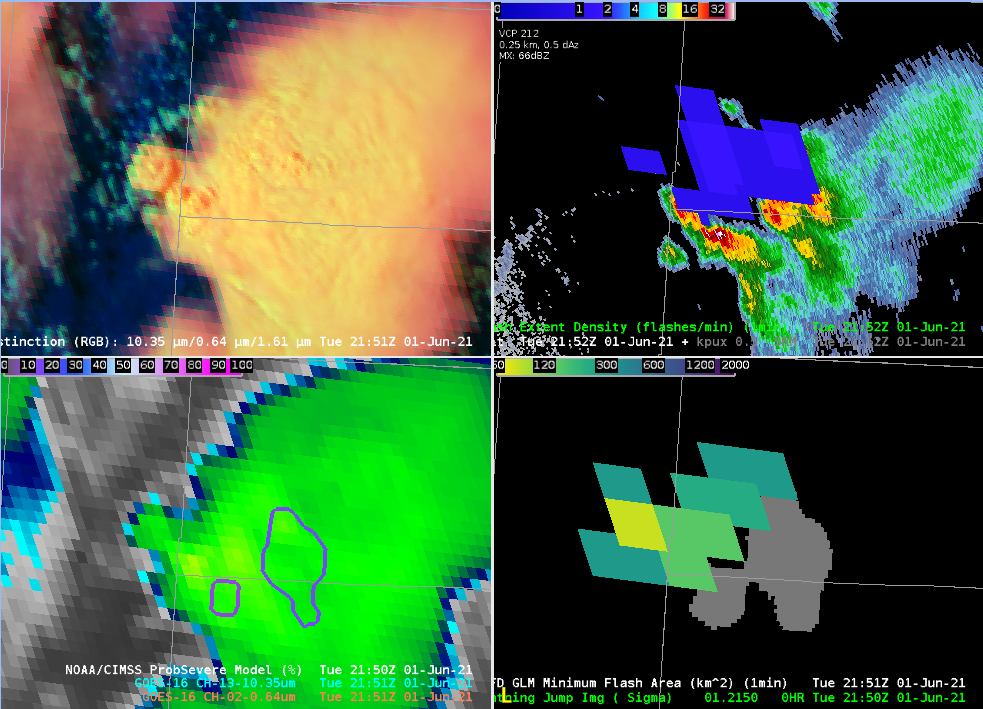
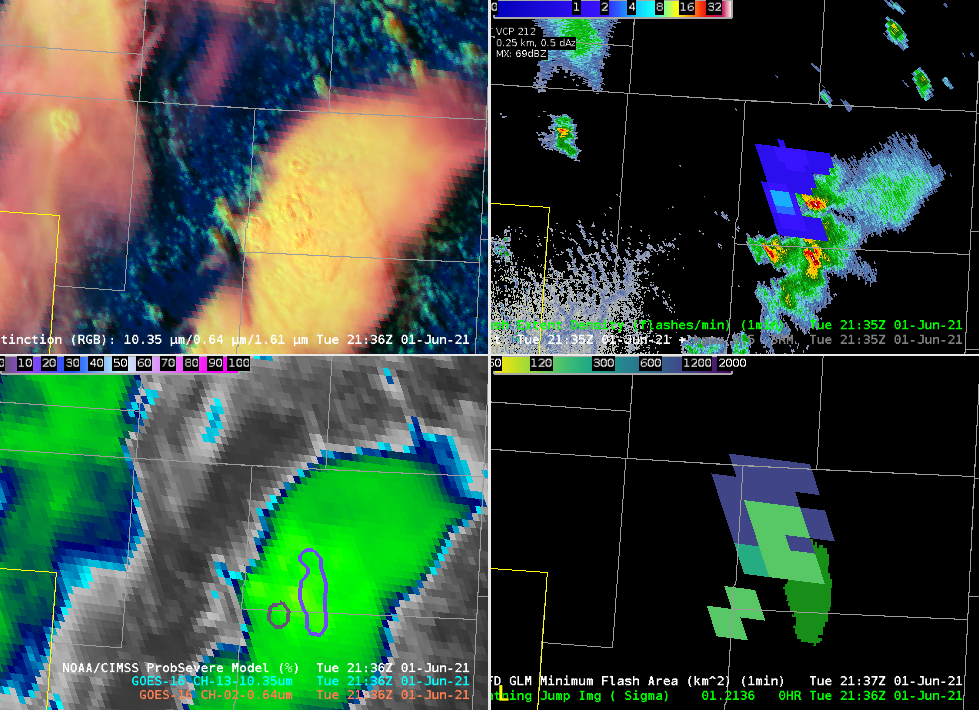
Next time stamp, we can see increased minimum flash area lightning over the new updraft and a pixel from the flash extent density. So the minimum flash area would likely be the best bet for using the tool with decision support services in mind due to its higher sensitivity.
-Dwight Schrute
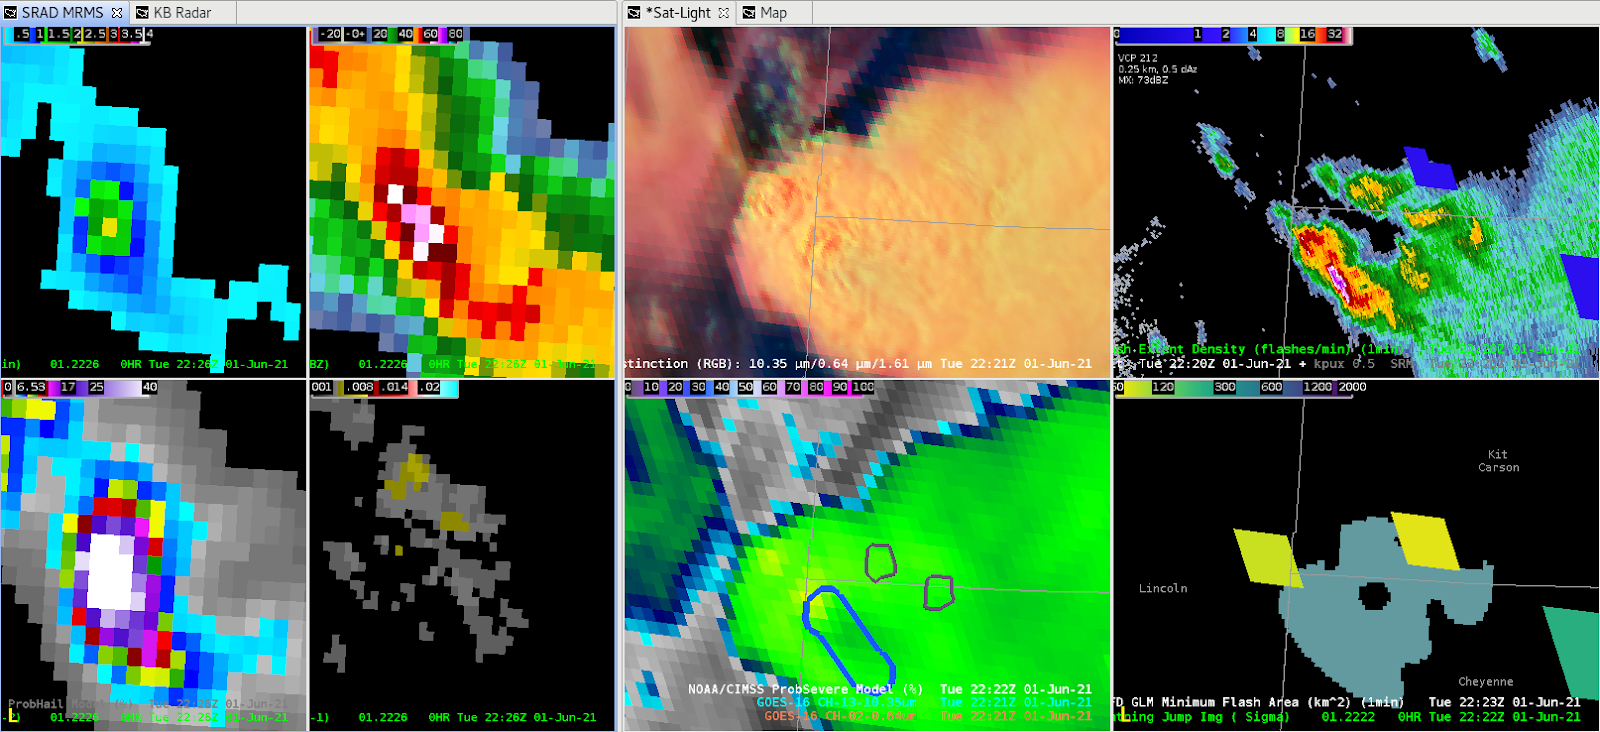
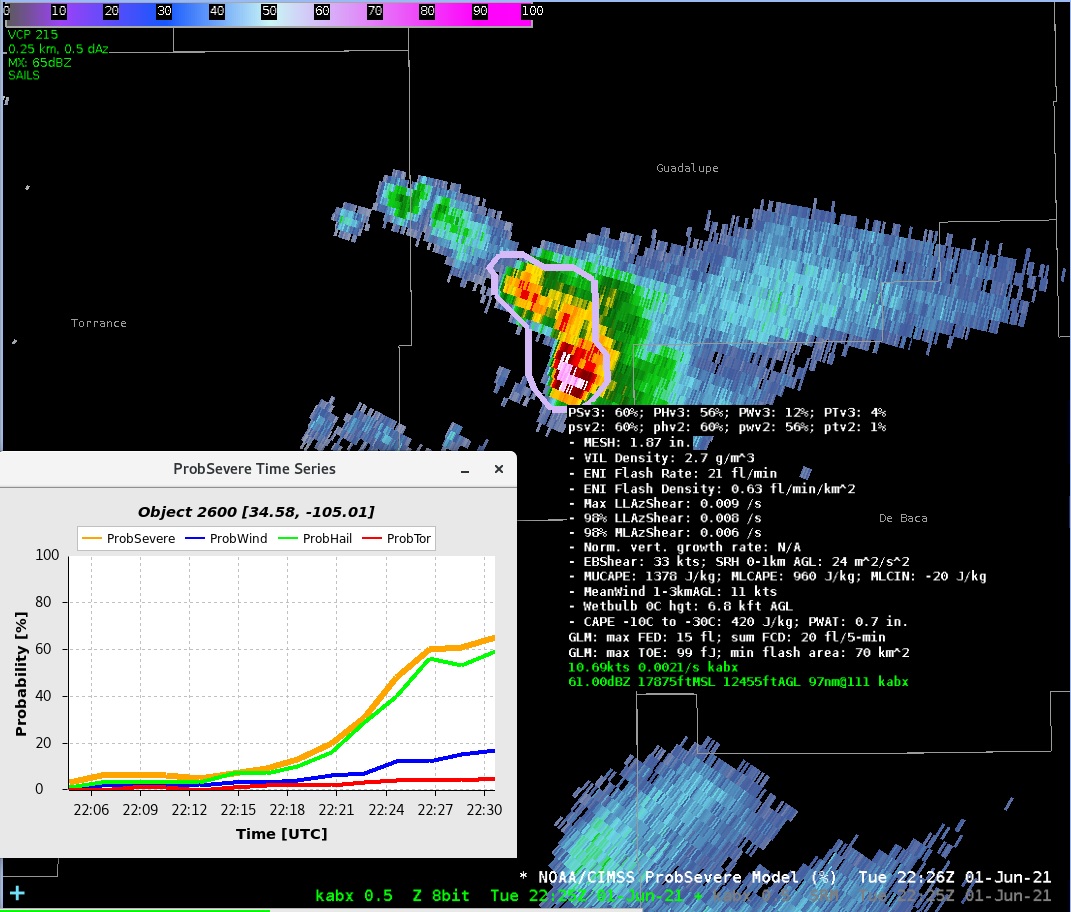
This was a scenario where we were baffled by how little lightning was being shown from both the minimum flash area and flash extent density products. We asked why so little lightning compared to how much ice is in the storm, combined with MESH indicating a 2” hail stone. The lightning with this maturing storm was not being sampled well.
-Dwight Schrute