Severe Cell in TFX CWA

At WFO Great Falls (TFX), we made use of the Octane speed and direction imagery, plus the IR brightness and day-cloud phase distinction to evaluate a cell northeast of Iliad. This imagery helped us screen the multiple cells over the CWA so we could home in on this particular cell. Characteristics that stood out included the higher anvil speeds on this cell, the diffluent cloud top signal on the Octane direction imagery; the cooler cloud tops (around -62C), and new/robust convection noted by DCPD.

4 Panel OCTANE depiction of severe warned storm near Iliad, MT.

Meanwhile, the cell closer to the Canadian border is becoming stronger. The ProbSevereV3 is trending higher for total severe, up to 19% at 2104Z. The anvil from the storm to the south is beginning to impinge on the cell to the north and somewhat obstruct the view.

The PHS imagery showed a regional peak in MUCAPE in this area.

Looking a bit later, the total ProbSevere continues to climb. It is well above the individual probabilities, which is curious.

Storms have matured with a notable V notch of cooler cloud tops and warmer tops to the north of the notch. Based on Octane speed, there is a notable difference in speeds from the southern end of the anvil to the northern reaches with 35-40 kts increasing to 65-70 kts. PSv3 does indicate a 50% chance for severe with this storm.

Meanwhile, down in CA, northeast of Sacramento, the Octane direction product is showing an impressive divergence signal!

–  Satellite Steve and Edgar

Tags: None

BRO PHS COMPdBZ comparison

Here is a comparison of the 15z  PHS Composite Forecast at 21z to the 21z MRMS Composite Reflectivity. Notice that the PHS has more widespread convection than what actually occurred. However, the PHS did forecast the translation really well (not shown here), which would aid forecasters in understanding where current convection is likely to travel.

21z MRMS Composite Reflectivity

15z PHS Composite Forecast for 21z

– Burton Guster, StormofCentury, Harvey Specter

Tags: None

Satellite HWT Day 4 Carl

Satellite HWT Day 4 Thoughts

Octane Direction

During my initial afternoon analysis I noticed a good use case for the directional product in identifying how different air masses may be coming together over the CWA. In the directional product below, we can see the magenta showing the moist surface air mass that is advecting up from the SE into west Texas and western NM. A drier air mass that is creating a bit of a dry line is pushing from the west in the more yellow colors, with some glaciating cu noted within the Day Cloud Phase RGB. Elevated convection that is still persisting from overnight can be see pushing to the southeast in the lower right, giving the more green colors. This provided a very clear and quick way to pick out these different air masses that will be the main players later in the afternoon for potential convection.

MoistGradConv RGB ECONUS

Some really interesting features that stood out when looking at this imagery during the afternoon today. Notice the sharp gradient in the light vs dark greens running across Texas, starting in the southern pandhandle near the NM border and then running SE through central parts of TX. When overlaid with 24 hour MRMS precip, you can see a clear boundary between the areas that received rain last night (the panhandle, darker greens) and the area that did not (lighter green in the Big Bend areas). This clearly stands out in the Snow/Ice NIR band which makes up a portion of the RGB. Moisture can also be seen pooling in west Texas as it moves northwestard along the edge of the Mexican Plateau. Obs later in the day showed that the “brighter” area was mixing out a bit faster given the lack of soil moisture. Some good potential situational awareness being combined within the RGB, given the ability of this to also pick out things like the dry line a little bit easier.

ProbSevere v3

Issued a warning in an area of pretty poor radar coverage (lowest tilt height was around 15kft). MRMS was still capturing a good bit of the freezing level to -20C isothermal levels, so ProbSevere was running pretty strongly with hail probabilities. Additionally, there were some significant bursts of cooler cloud tops, and the Octane product began to show some of the stronger “divergent” signatures that we had seen throughout the week as well as highlighting a clear AACP, all signs of a stronger updraft capable of keeping hail lofted.

Given the environment, these products definitely gave me additional confidence and potential lead time, given these cores really grew tremendously about 15 minutes later, including an eventual split and right mover that likely produced some large hail (hard to verify in this area given lack of population).

More Octane (Speed)!

Another picture from later of how this storm grew and exploded. Octane was showing yet another AACP. A very interesting feature of this is that Octane speed algorithm does seem to be “tracking” the AACP in a way. There are a lot of research groups out there that have been looking at ways to track these features for injections of tropospheric moisture into the stratosphere among other things, so this could be a novel way at looking at that problem.

An hour or so later, we can see how the Octane product can be used to see that a storm was weakening. The deep blue divergent signature began to quickly fade, an indication that the updraft wasn’t as strong as it was previously. Given this is data flowing in from the mesoscale sectors on GOES 16, we are getting one minute updates, which will give some lead time over analyzing the core of the storm via the radar or MRMS which needs to get the radar data and then process it. This can be important for SVS or considerations for a downstream severe. I ended up still issuing a downstream severe, but was able to use what I was seeing in the product with the weakening trend to decrease the expected hail size. MRMS and ProbSevere trends closely followed, moving downward in severity.

Above: Weakening trend starts around 22Z for the Octane Speed product in the top left

Below: ProbSevere and MRMS trends begin to come down around 22:05Z or so, lagging the above by a few minutes. Every minute counts in lead time.

-Carl Coriolis

Tags: None

PHS 0-3km SRH for WY/MT – 5/25/23

PHS 0-3km SRH for WY/MT – 5/25/23

Shear parameters are highlighted for the afternoon time period across Northern WY and far Southern MT (northwestern portions of the image domain). Radar observations later on indicated this product did well, with several cyclic supercells moving NE to ENE across far Northern WY, and entering into Southern MT at the writing of this post. This product demonstrated higher resolution, though similar placement of convective elements from the same product on the HRRR model.


PHS 0-3km SRH – 20Z – 5/25/23

PHS 0-3km SRH – 21Z – 5/25/23

PHS 0-3km SRH – 22Z – 5/25/23

PHS 0-3km SRH – 23Z – 5/25/23

– Rain-Free Bass Guitar

Tags: None

Growing Lightning Threat in Carter County, MT

Growing Lightning Threat in Carter County, MT

LightningCast probabilities steadily increase across Carter County, MT (Far SE MT) through the late afternoon. Perhaps the user could opt to select a more detailed range of probs by using the density radio button option in the product menu. At the moment only the 10/25/50/75% probs are available.

Probailities for lightning are steadily increasing over Carter County as convection forms along the cumulus field observed running SSW to NNE across the county. 

Surface-based CAPE from the PHS product indicate values increasing to 2,000+ J/KG across far SE MT.

– Rain-Free Bass Guitar

Tags: None

Octane Direction Corrected Wind Speed Color

Octane Direction is a useful tool but changing the color table helps. I think we need get away from the pinks and reds. The top image is the corrected color table while the bottom was the uncorrected. Some of the stronger storms still stick out with divergent but a lot of the weaker but still significant outflows are masked by the pinks and reds. For me to get these results I did need to change the table to only go to direction 270 which made everything from 270-360 the same color, which in the current environment worked well. I am hoping with some more experimenting we could find a color table that goes to 360 that looks more similar to the upper picture.  -Thunderstruck

Tags: None

Extreme GOES-18 Parallax Over Florida

This animation shows the effects of parallax with the GOES-18 satellite imagery over the west coast of Florida. Overlaid on the GOES-18 visible product is MRMS Maximum Estimated Size of Hail (MESH). You can see MESH objects within the updrafts near the coast line while the associated anvils are well to the east (the displacement a product of the parallax). While GOES-18 wouldn’t likely be used operationally at an eastern location, it does show a potential operational use of MRMS and satellite display together, showing the characteristics of the thunderstorm visually with the estimated hail size derived by radar (among other MRMS calculations).

-Joaq

Tags: None

Evolution of LightningCast Over Southern Montana/DSS Event In Billings

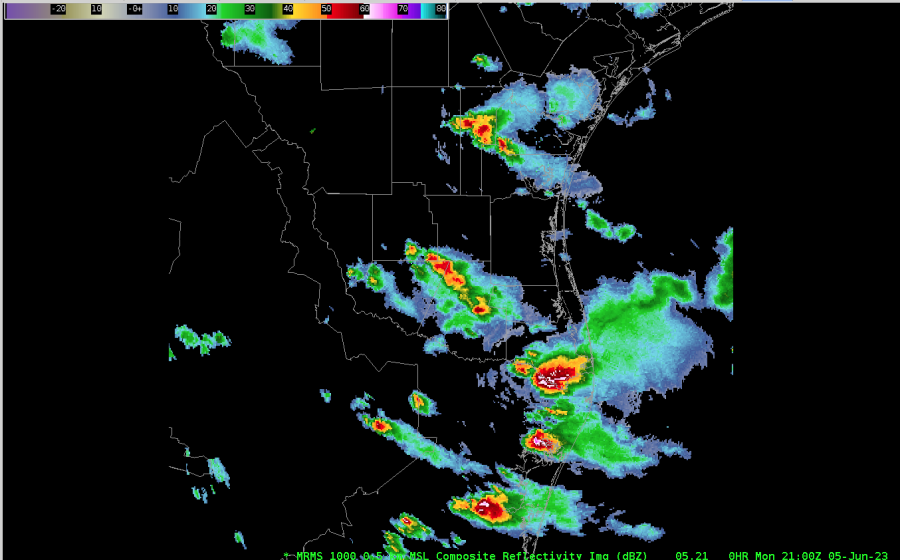
Upper level flow shows continued SSW flow aloft over the region, thanks to deep troughing remaining over the West Coast. Overall forcing through the afternoon is on the weaker side of things, but models show an upper level jet streak nosing into the area. Scattered thunderstorm activity has already developed (below) to the south of Billings in northern WY, and is expected to expand in coverage through the afternoon. The DSS event is noted by the large yellow “B” over Billings.

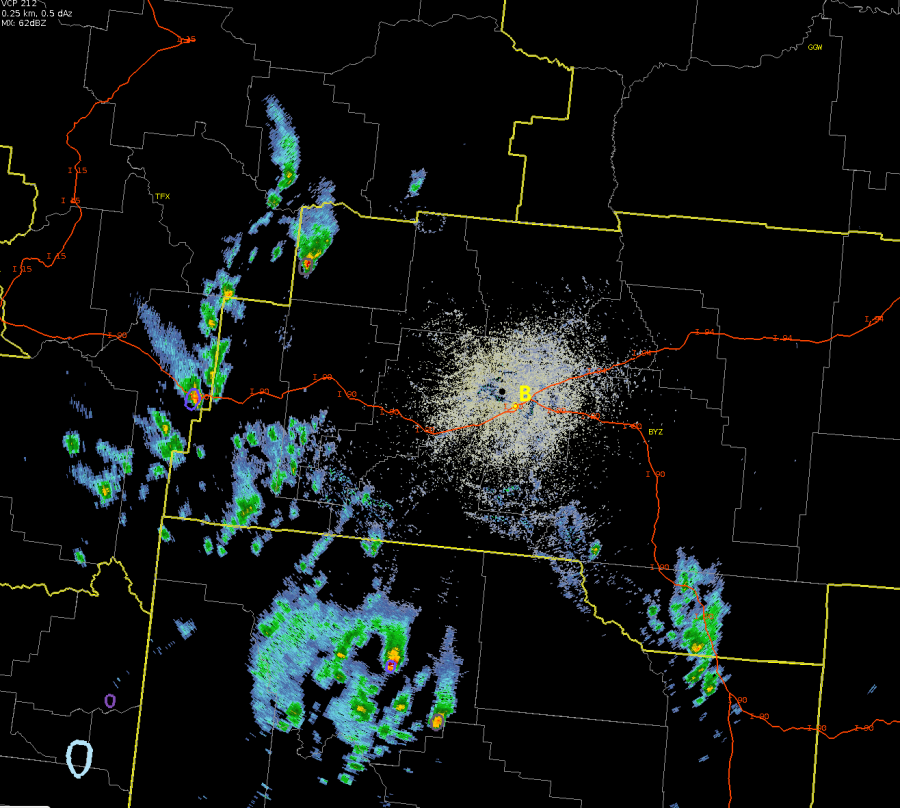
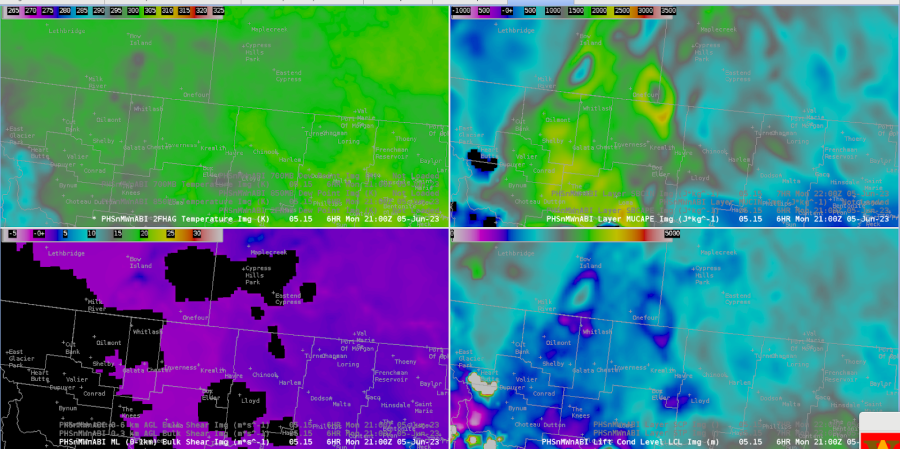
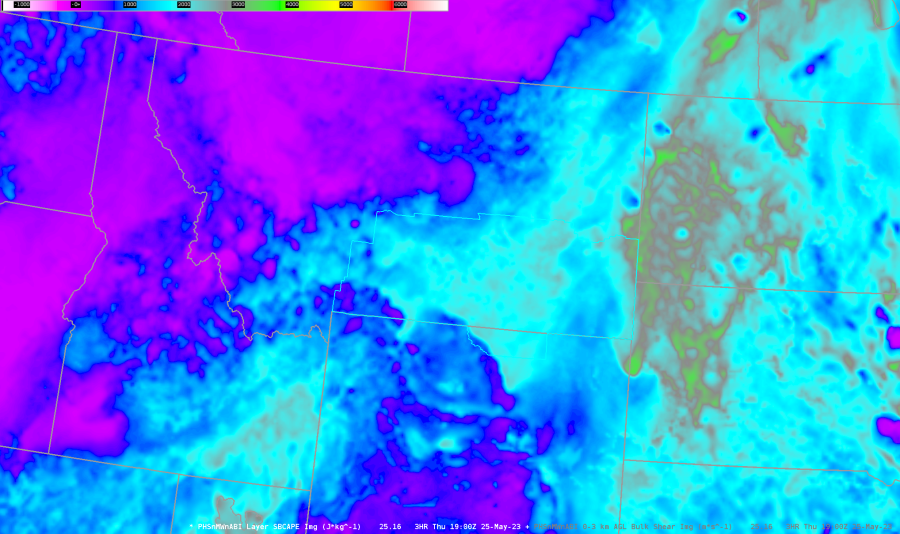
The 14Z PHS forecast output (below) showed 19Z MUCAPE values across the area ranging roughly from 1000-2500 j/kg (with highest values in the eastern areas). Looking further into the mid-afternoon hours, outside of MUCAPE values creeping closer to 3000 j/kg in far NE portions of the CWA, the PHS overall didn’t show any notable changes in values. PHS values of 0-6km shear also matched up fairly well with SPC Mesoanalysis at 19Z, and had values increasing to around 35-40 kts through the afternoon.

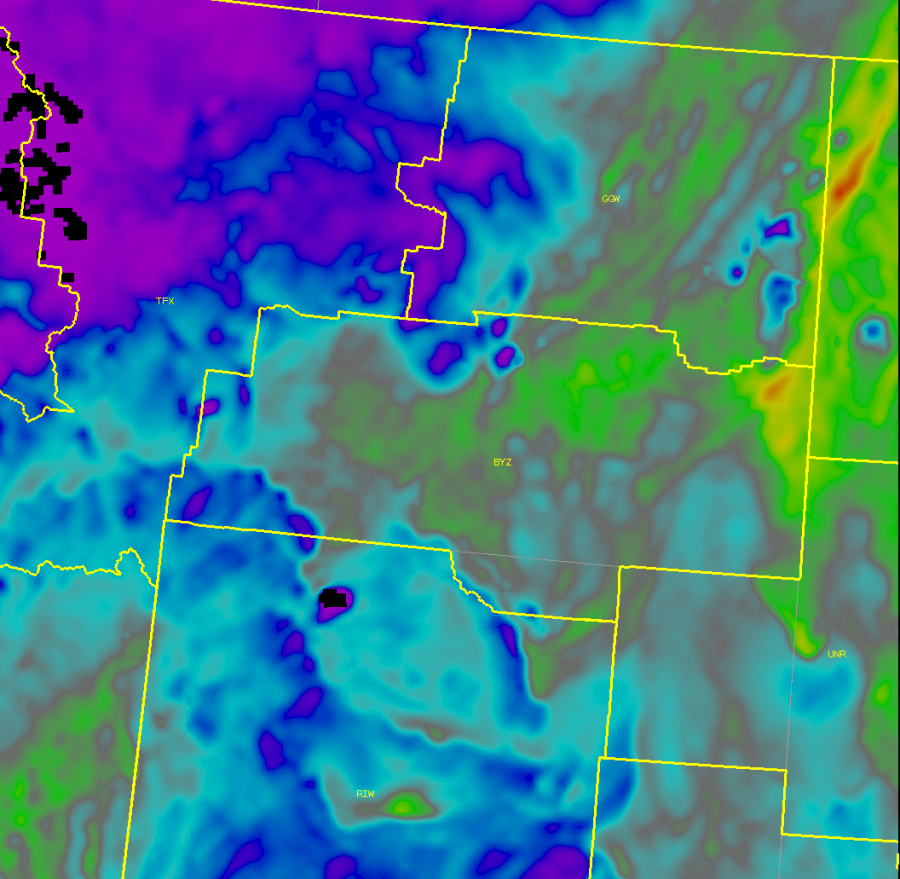
Below is the 19Z MUCAPE via the SPC Mesoanalysis page.

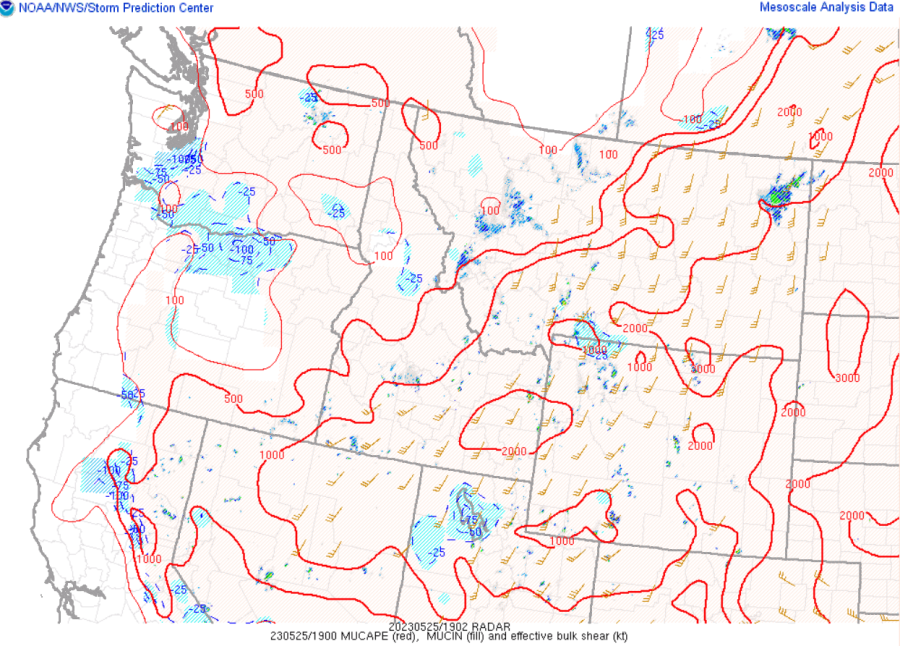
LightningCast right around 19Z showed the 10% probability contour still about 40 miles SSW of Billings at its closest point (below).

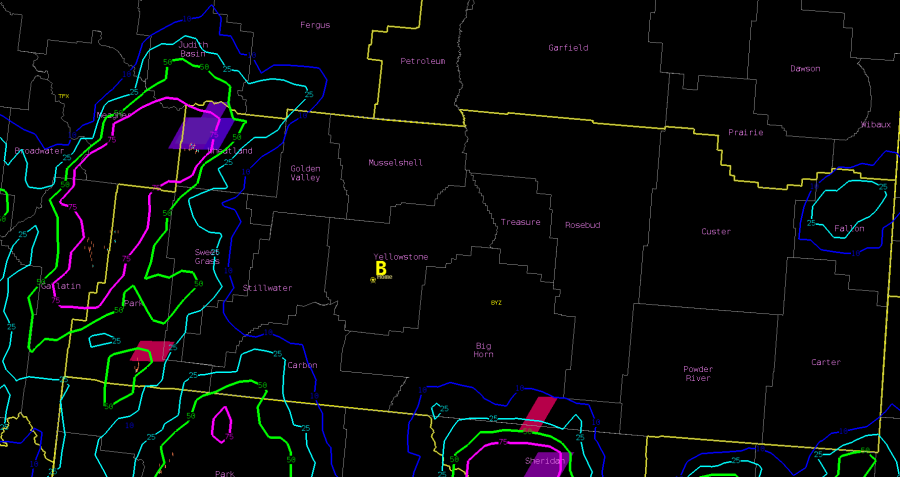
LightningCast right around 20Z showed the 10% probability contour still about 30-35 miles W-SW of Billings at its closest point (below).

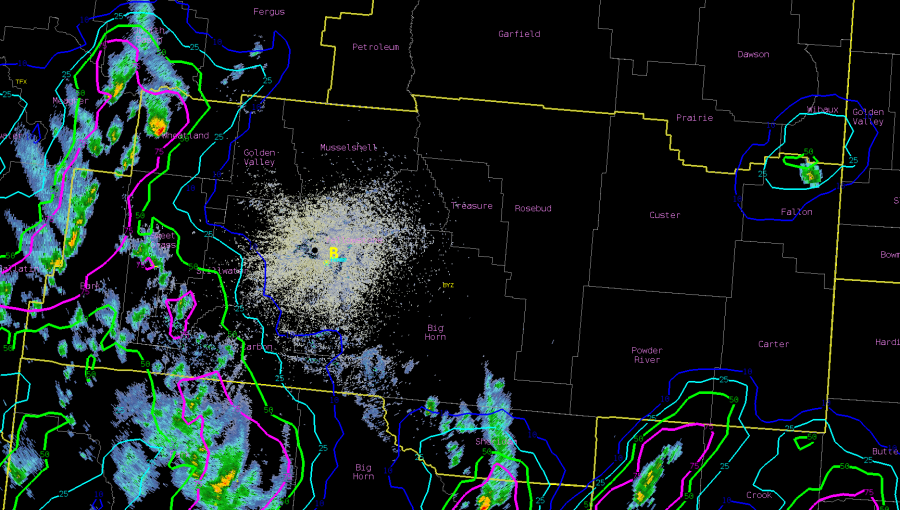
Around 2045Z, the 10% prob. contour reached the DSS event(below), but overall activity continues to be slow to push NNE. The LightningCast Time Series is included to show the trend up to this point.

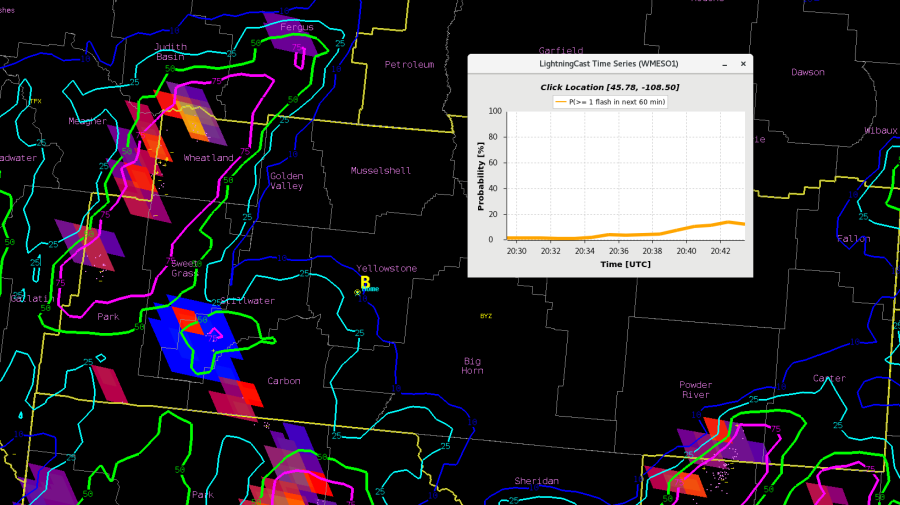
Fast forward to roughly an hour later (~2140Z), there’s been a bit of a jump in the LightningCast Probability/TimeSeries (below), with the DSS event now sitting with a roughly 35% probability of lightning in the next hour.

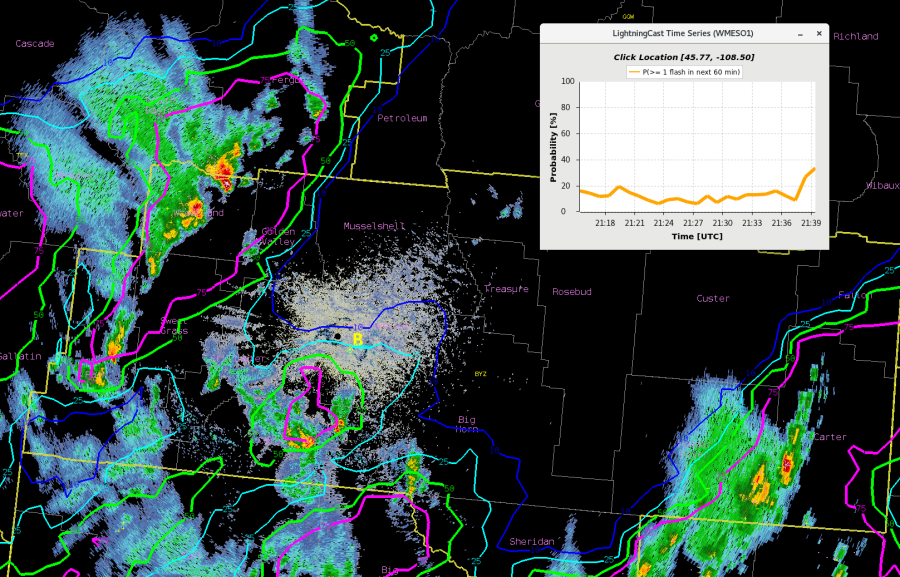
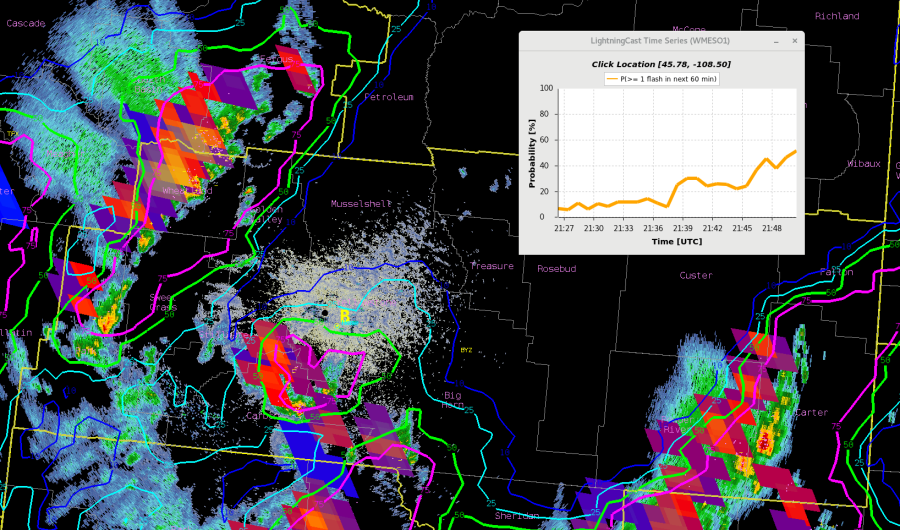
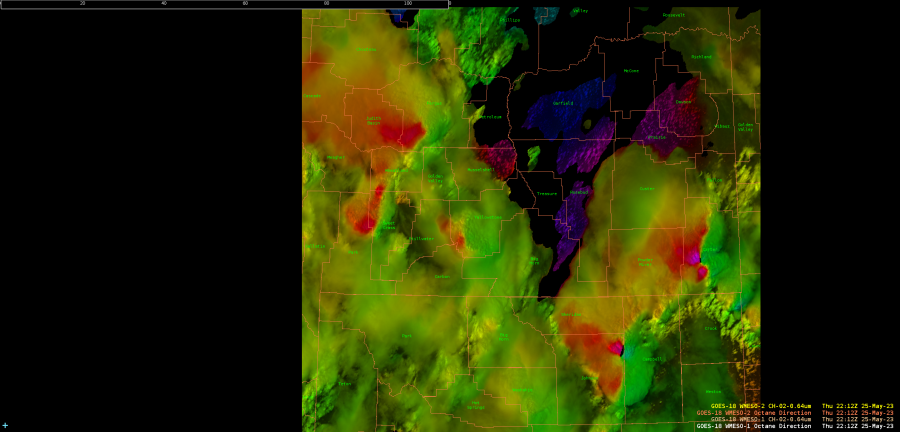
A few minutes later, another jump up in probability – up to around 50%. Below is an image that has the GLM FED (colored pixels) included with the radar, LightningCast, and ENI Total Lighting Plot.

You likely have already been talking with the DSS contact point, but this jump up in the last ~10 mins may warrant another update, conveying that there is an increasing probability of lightning occurring in the next 60 mins.

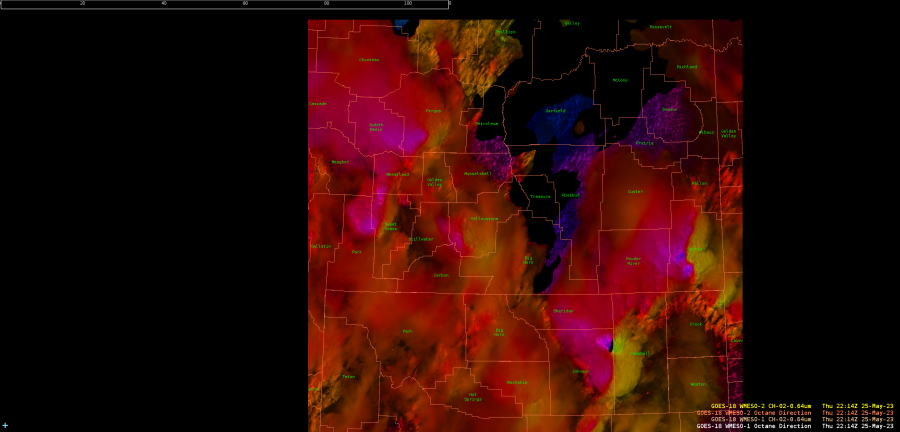
Not surprisingly, the LightningCast probabilities have continued to increase, also shown in the time series. Image is from 2220Z.

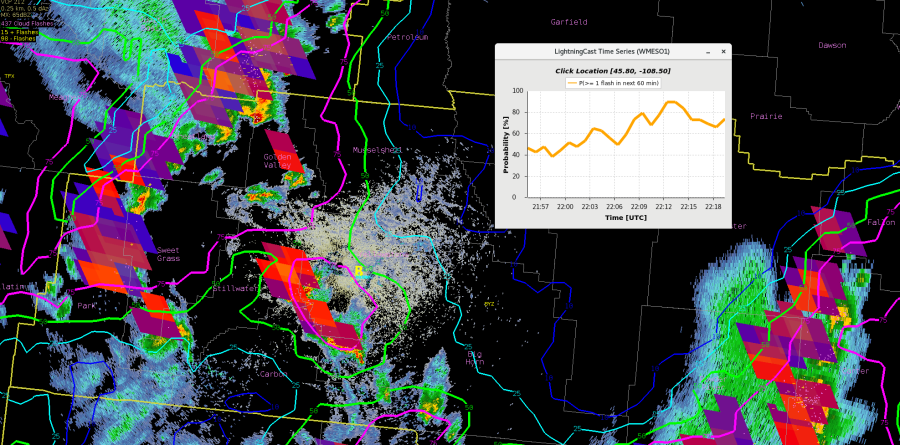
What’s the best way to pass along this information to the DSS contact point?

With this type of event, where it’s slow to move in (driven more by the upper forcing vs the somewhat random quicker-developing activity that can occur in high CAPE/low shear  and other types of environments) and no significant changes in the overall environment across the area, perhaps you could wait until it’s closer to 50% or more  before expressing greater concern for the threat of lightning.  In those instances where activity may be quicker to develop/strengthen, it’s not out of the question that values closer to the 25% contour would warrant greater concern. No matter the overall environment, I do believe the addition of a shorter-term probability (lightning within 30 mins)  would be beneficial.

– Bubbles


Tags: None