
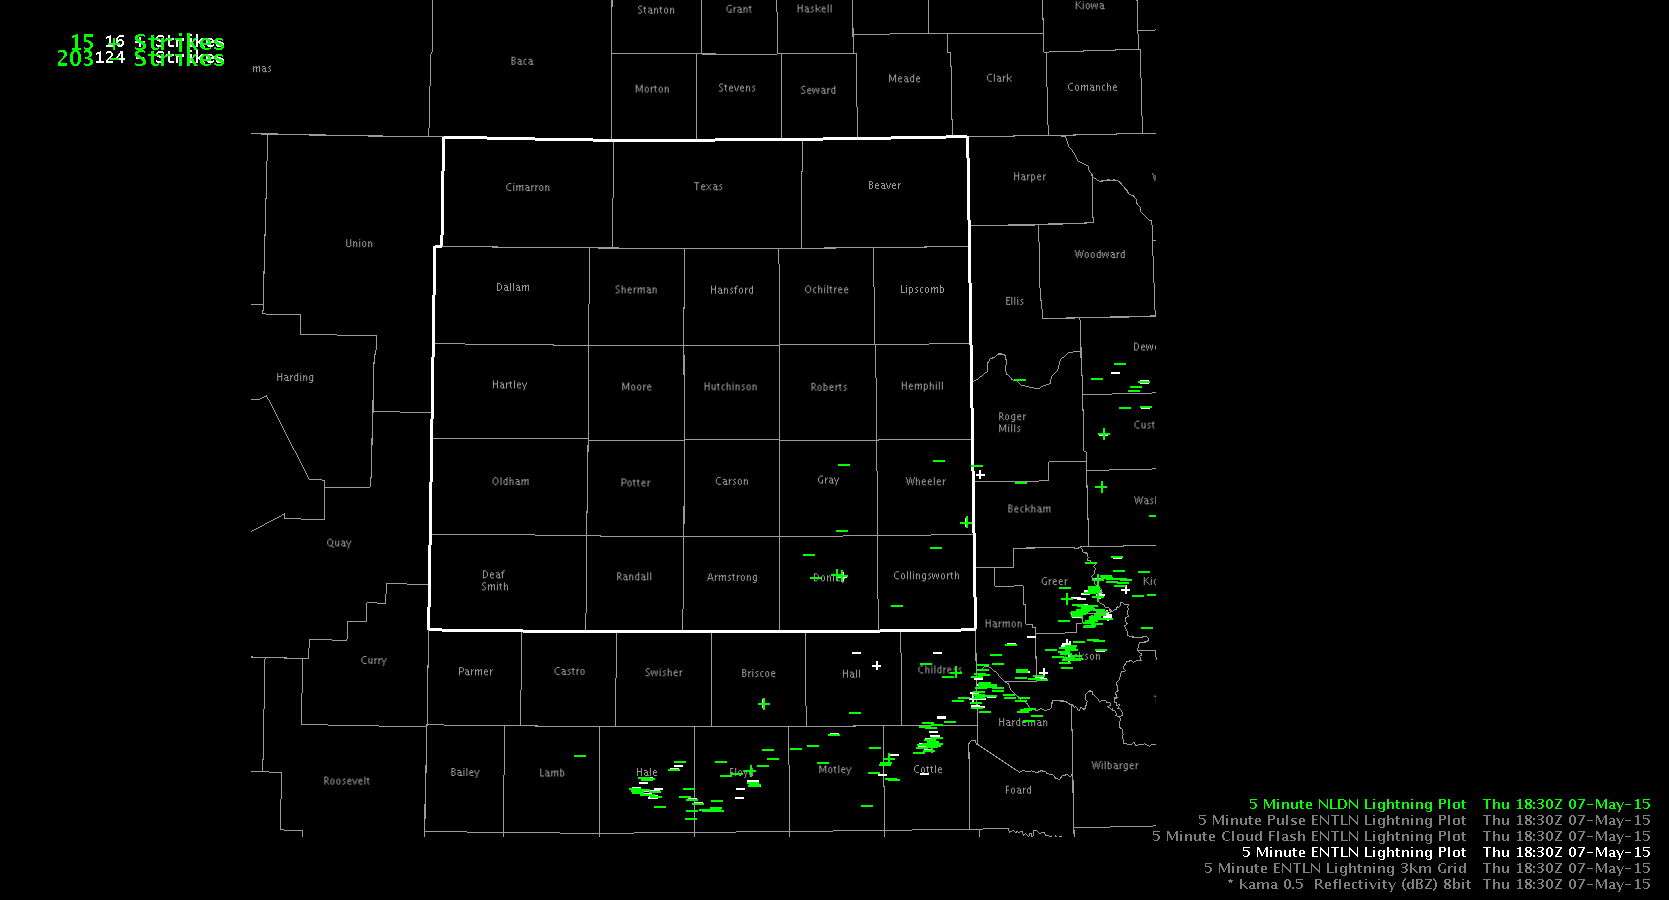
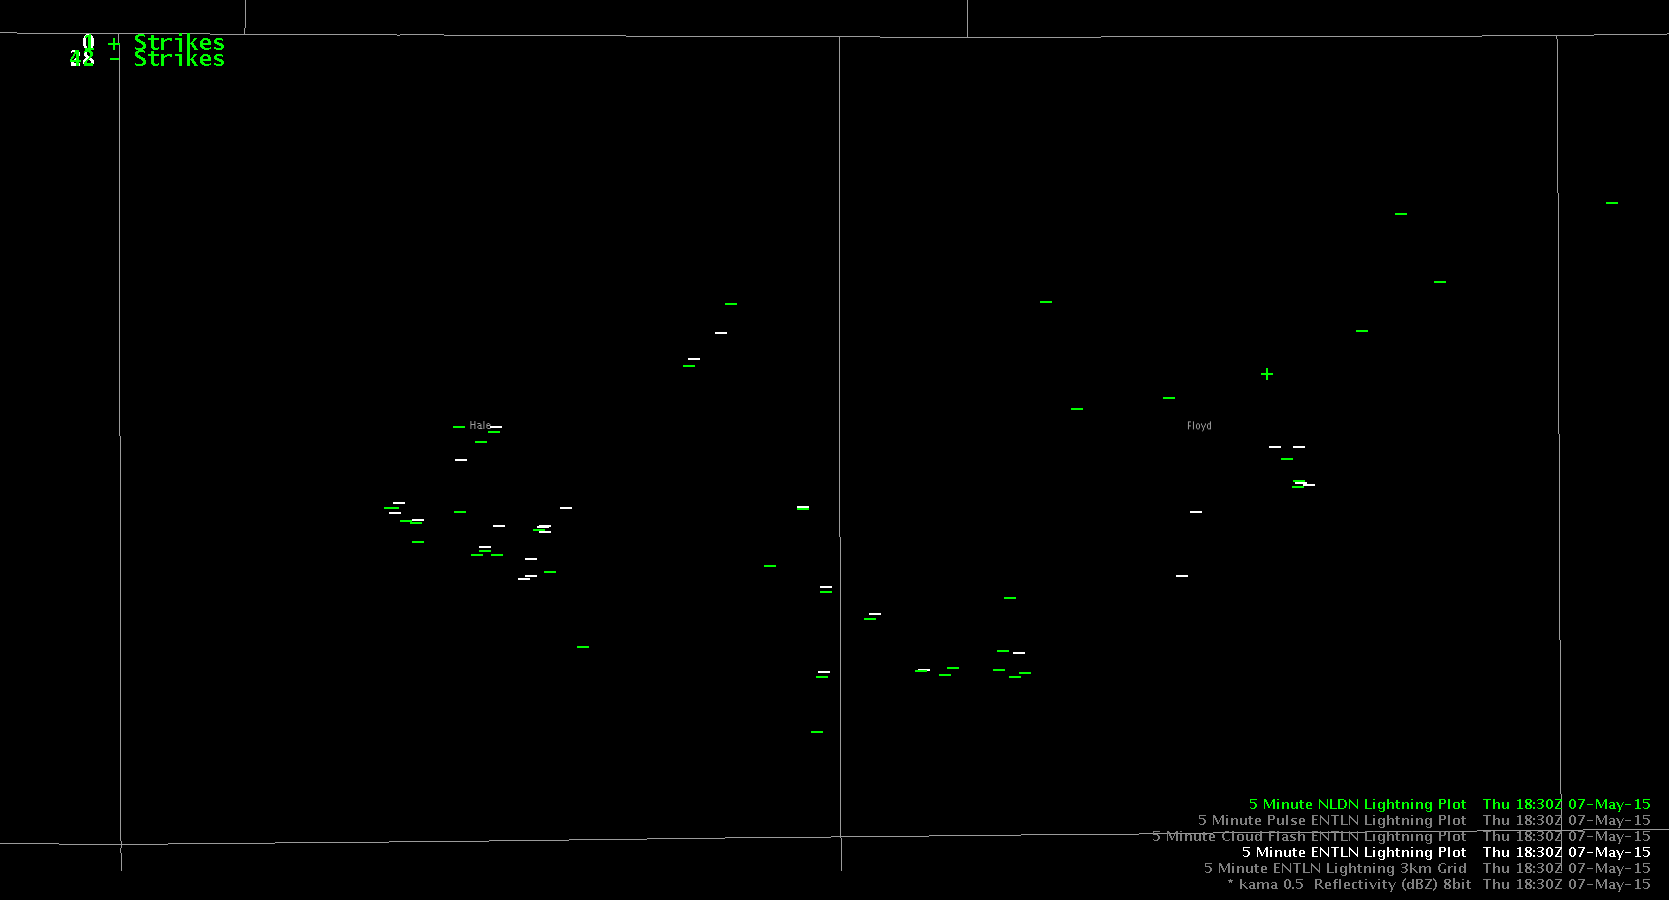
More CG strikes show up in the NLDN than the ENTLN. First image is areal view. 2nd image is close up of Floyd County TX at 1830z.
Lynford
Official websites use .gov
A
.gov website belongs to an official government
organization in the United States.
Secure .gov websites use HTTPS
A
lock (
) or https:// means you’ve safely connected to
the .gov website. Share sensitive information only on official,
secure websites.

More CG strikes show up in the NLDN than the ENTLN. First image is areal view. 2nd image is close up of Floyd County TX at 1830z.
Lynford
We are tasked with assessing the pGLM and GOES-R/UAH CI products. A very moist and unstable atmosphere is present over much of the LUB CWA with an ongoing MCS exiting the northeastern portions of the CWA. GOES-R/CIMSS layer CAPE values range 400-500 J/KG for the northwestern portions to 1200-1400 J/kg for southeastern portions. PWATs also possessed a sharp moisture gradient from NW to SE, with values near 0.60″ NW to 1.40″ SE, along with dewpoints in the mid 60s building across southern half of the CWA ahead of the eastward moving MCS.
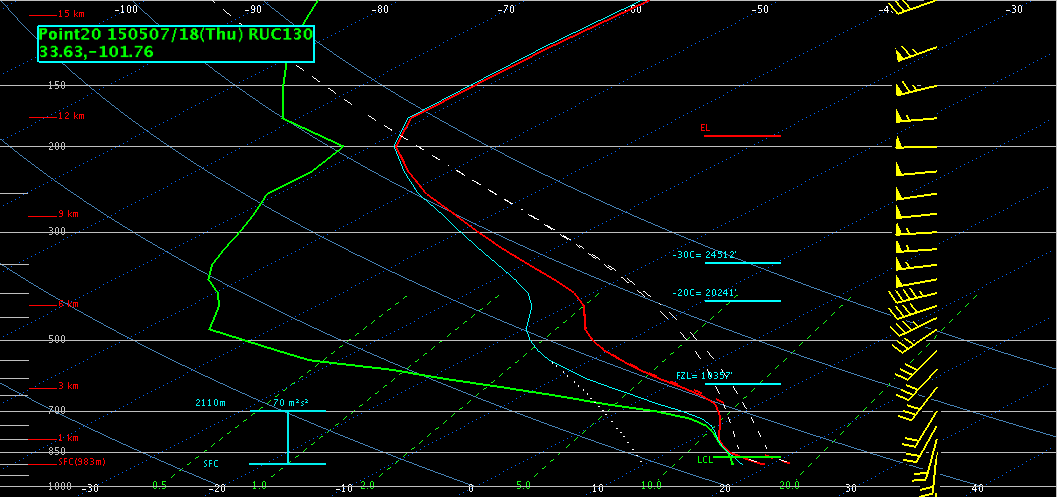 RAP13 forecast sounding centered just south of Lubbock around 18Z indicated MLCAPE around 1600 J/KG, fairly close to the GOES layer CAPE values. Freezing level and -20 C heights are around 20k ft with modest moisture in hail region, though very moist low levels will help overcome some drying aloft. Expect large hail and damaging wind gusts to be an issue with any discrete cells, as well as isolated tornadoes possible due to modest low level shear/helicity. Will monitor CI for possible development south of LUB/ongoing MCS in hopes of catching pGLM/lightning jump with storms as they develop.
Brick Tamland
Around 1800 UTC, a MCS is going across the southeastern portion of our CWA. We expect this region to remain stable in the wake of this system as it progresses eastward along the Red River Valley. Central and western parts of the CWA have seen ample sunshine. A dry punch is visible moving in from the southwest, and dewpoints have dropped into the 40s through eastern New Mexico, with low to mid 50s through much of the Texas panhandle. We expect some additional moisture return, especially through southern parts of the CWA…along with a tightening of the dryline feature. There is some question to the amount of instability, although GOES LAP algorithm indicates 800-900 J/kg through central and southern parts of the CWA…although with heavy clouds in the region, it’s difficult to gage the accuracy of the values. A 500 mb low is centered over central California, with southwest flow over west Texas. Any subtle wave or ripple in this flow may be enough to trigger high based convection along the dryline feature. The 12 UTC AMA RAOB indicates mainly unidirectional flow through the column.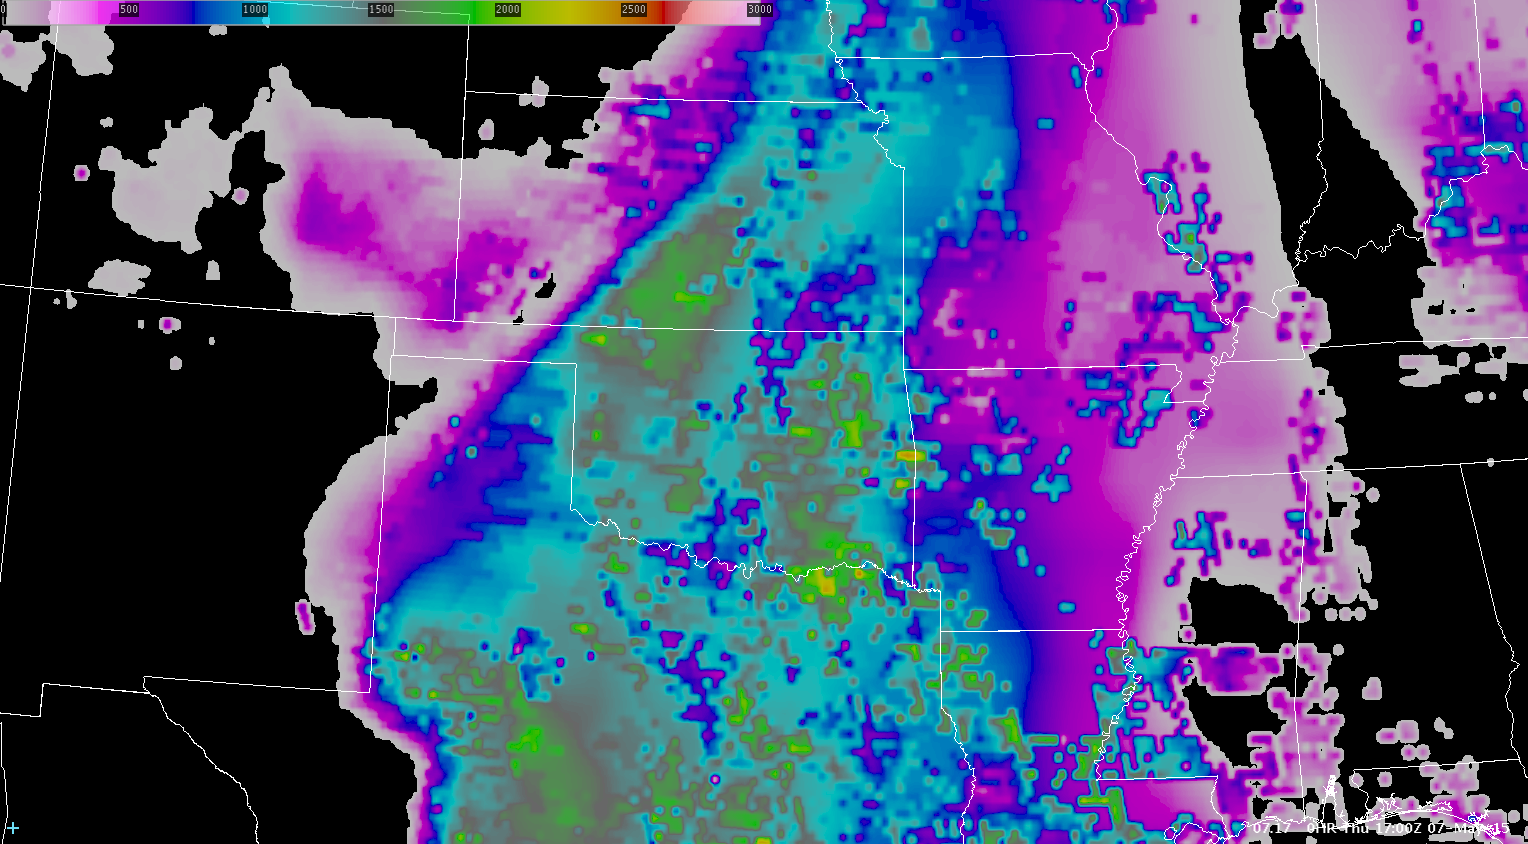
As we were spinning up with the OUN CWA, we received word that the KFDR radar has went down and technicians are on their way to fix it. Looking at the latest radar (1821Z), the strongest storms were near that area and it will complicate the warning process.
 With the surrounding radars seeing the current storms around 15kft, this will be a good opportunity to try out the ENI Lightning Data, both the Thunderstorm Alerts and the Cell Tracking with Time Series. Here is the latest Significant/Dangerous Lightning Alerts for that area at 1832Z.
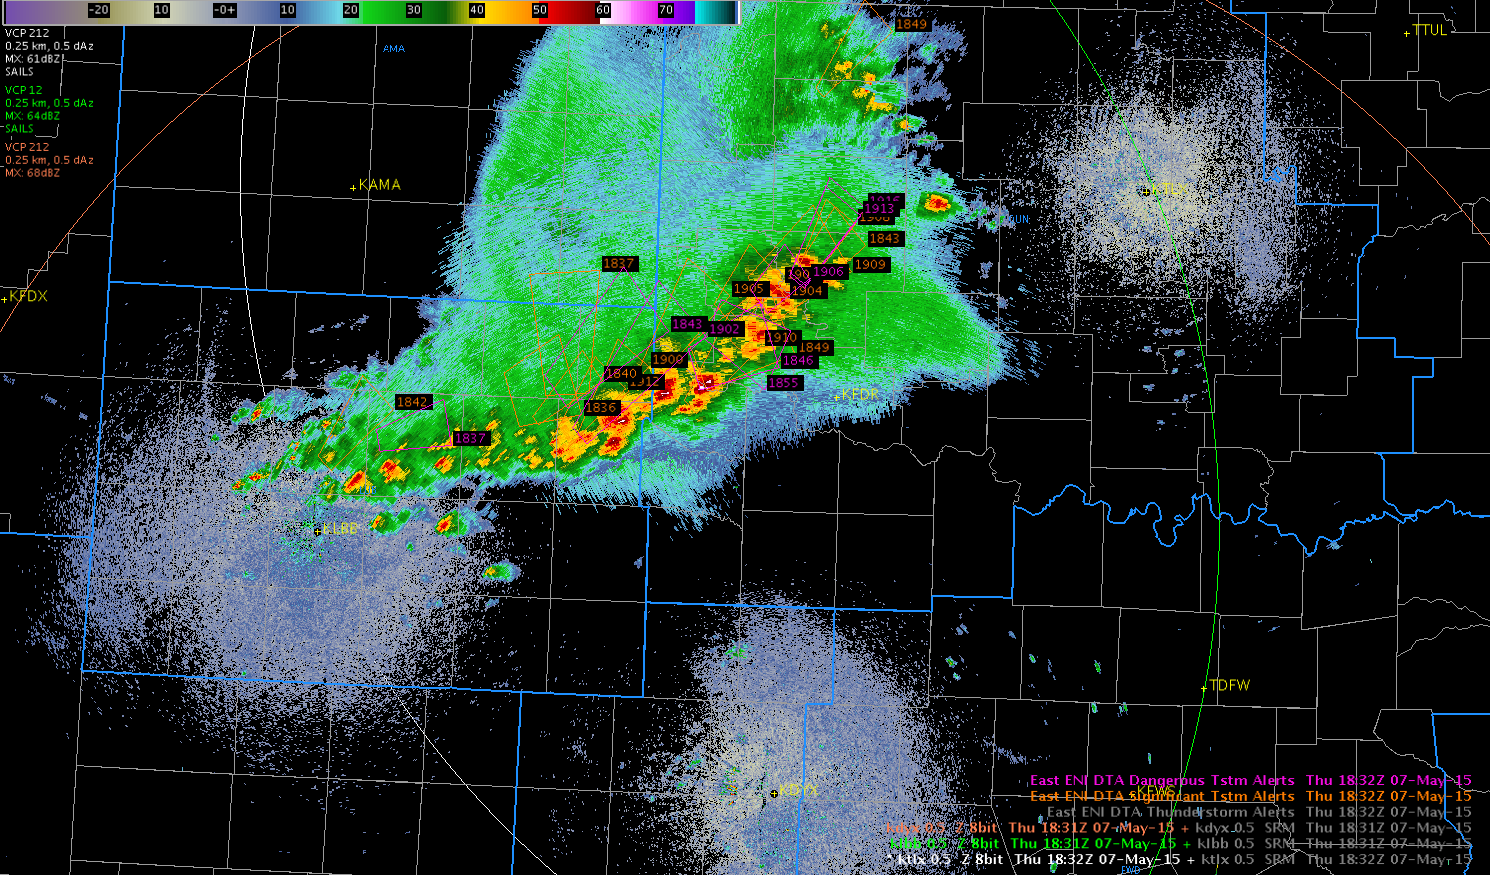 There are a numerous boxes with the default settings and one of the other groups was going to set a higher threshold, which we will try out shortly.
Finally, taking a look at the cell tracking data, we area able to pick out a couple stronger cells, with one location outputting over 100 flashes on the strongest cell.
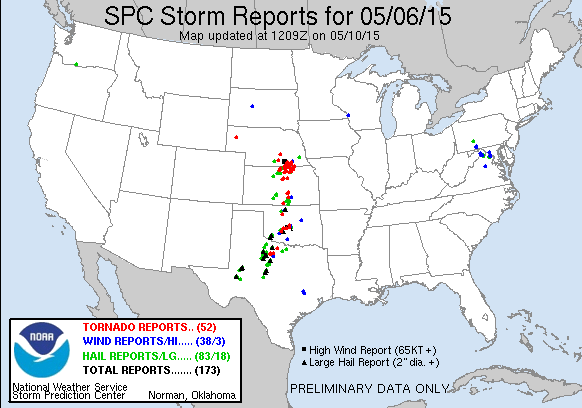
Convective activity began today earlier than was expected across the southern Great Plains. We placed groups in CWA’s where the greatest severe threat was expected for the day: Norman, Wichita, and Hastings. As convection was already ongoing when we began operations, attention was focused on warning activities from the start, with the Earth Networks lightning products, Lightning Jump, and ProbSevere Model having a lot of utility.
Tomorrow, we will start activities at 12:00 pm in the Dev Lab for the daily debrief before moving to the HWT for the EFP briefing. Activities will likely shift back to West Texas.
– Bill Line, SPC/HWT Satellite Liaison and Week 1 EWP Coordinator
After a busy day at ICT, we have come to the conclusion that radar base data is still our #1 when it comes to warning operations, while the other tools are “confidence boosters”. With many (if not all) of the warnings we issued today, there was little doubt that the storms were likely to produce severe weather. The radar base data told us what we needed to know to go ahead and issue the warnings, with things like lightning jumps and prob severe being more of a reassurance. In a lot of cases, the prob severe did not substantially increase until we we already in the process of writing up or had already issued a warning. Take this storm in Ellsworth County, KS for example.
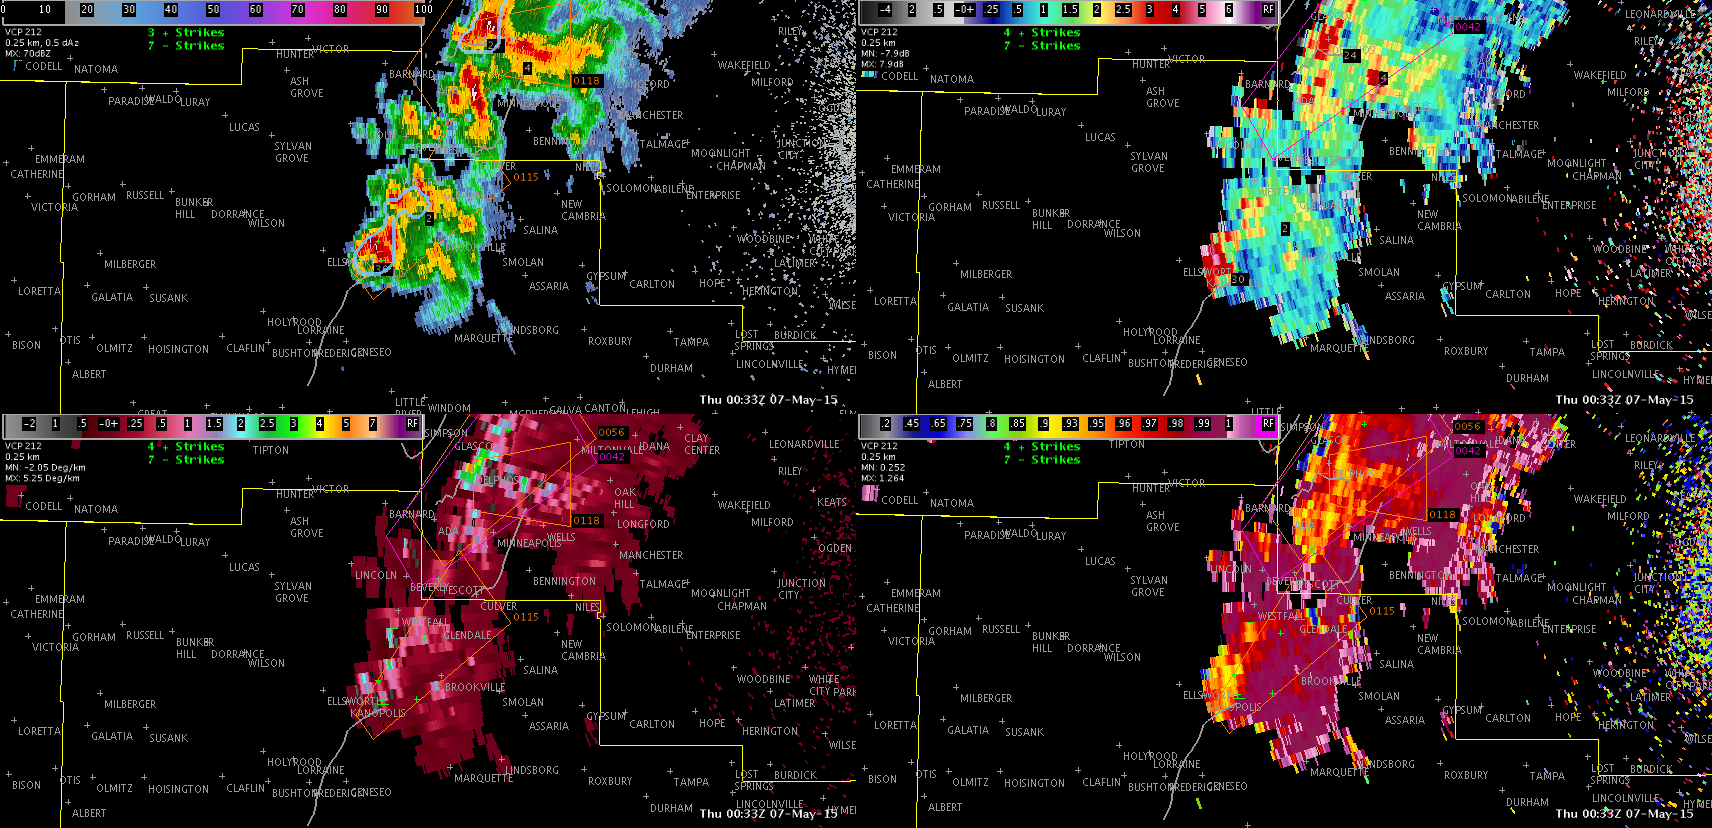
When we decided to issue a SVR for this storm, the prob severe was only 13%. Meanwhile, the base data was pointing towards severe hail.
As the warning was being typed up, the next volume scan came in and the prob severe jumped to 85%. Trends in lightning were also more of an afterthought/confidence booster with regards to subsequent storm intensification.

In cases like today, the supplemental tools did not necessarily add any lead time. We do think tools like prob severe and changes in flash rates would be a bigger help with the warning decision making process in marginal severe environments or pulse storms.
Jack Bauer/V. Darkbloom
After working primarily with the ENI data today for the first time, I think one of the things that I can takeaway is that the ENI Time Series showing total, in-cloud, and cloud to ground flash rates can improve the forecaster situational awareness.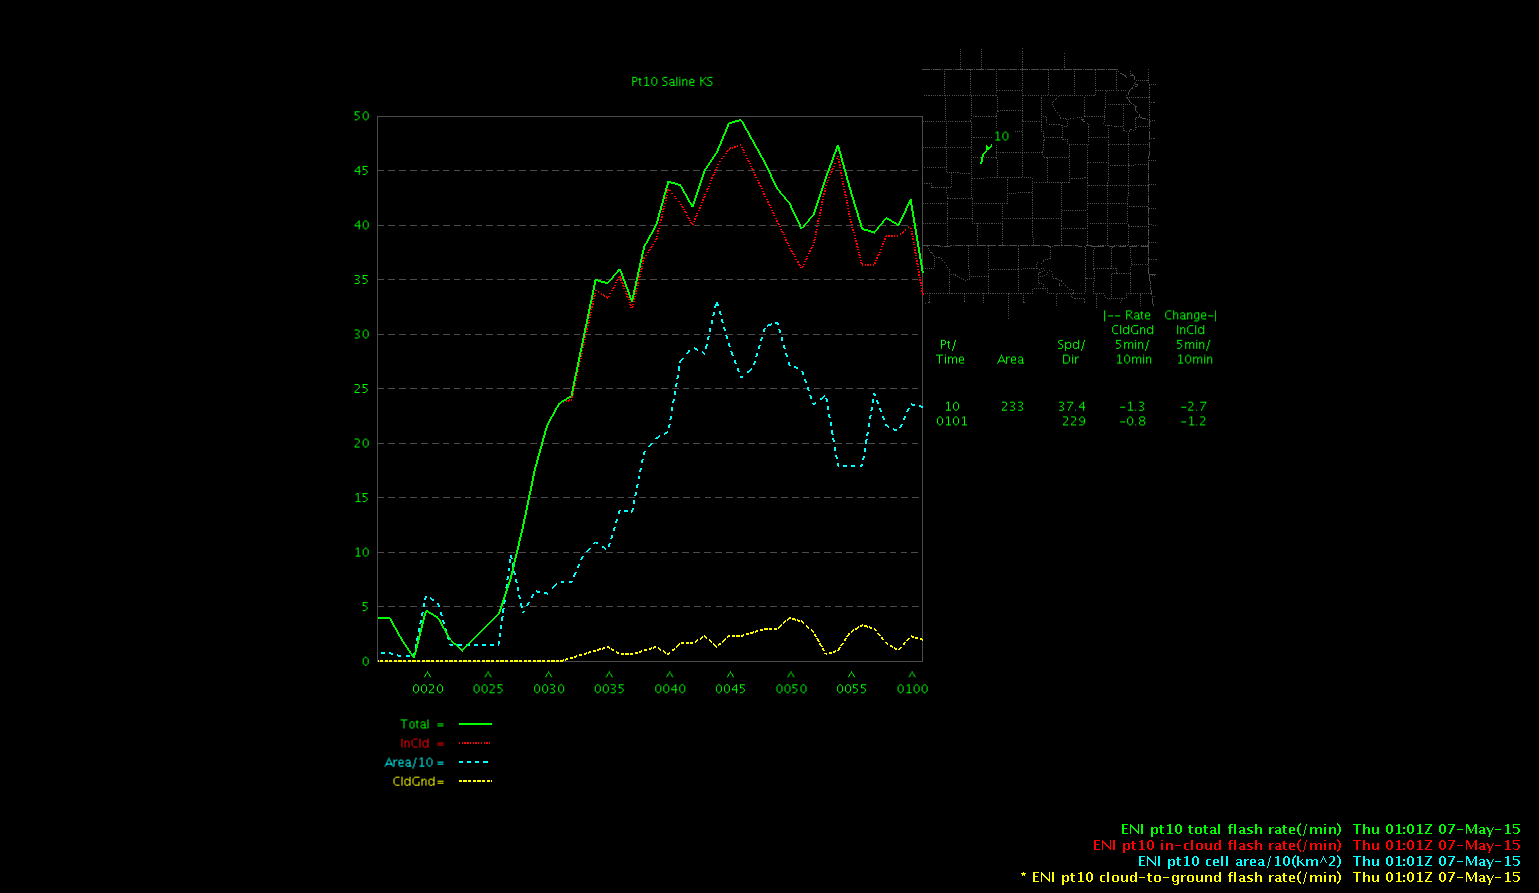
Especially in situations where you are looking a multiple storms within your warning area, the ENI Time Series data can help draw attention to other storms you may not be spending enough attention to. I don’t think that the ENI flash rates or DTA improved my warning lead time as I found the base radar data still to be the primary warning tool which provided the best lead time but this data does provide confidence in the warnings issued.
Jack Bauer
I should have know a busy day was in store for the OUN area when sitting down and already seeing a storm that needed a Tornado Warning. That continued throughout the rest of the day with numerous TOR/SVR warnings issued (at least 30 and probably over 40). With the quick startup, didn’t get much of a chance to look at the GOES LAP data other than a quick overview to start the shift.
With the size of the OUN area, I was jumping back and forth between 3 different radars and a significant distance between areas made for an overwhelming feeling at times during the shift (especially when trying to look at more than just radar). I used the ProbSevere and lightning jump throughout the shift and found them both to be very useful (especially for situational awareness). In most instances, saw both lightning jumps and rapid increase in ProbSevere before the storms really took off. With as busy as things were, I wish I could have looked at the lightning jump data more in real-time. Unfortunately, there just wasn’t enough screen real-estate to overlay another product (I tried to overlay it on radar data with 50% transparency and it was too much).
All in all, a busy but fun day in the OUN area.
-SRF
Unfortunately we lost GOESR/CIMSS layer CAPE/PWAT products around 22Z. Originally we expected to have a short amount of time to form a mesoscale discussion for GID but quickly transitioned to warning mode, issuing both SVRs and TORs. We were not able to assess the UAH CI product as the area quickly became cloud covered. The Overshooting Top product successfully highlighted the stronger storms, especially those with large hail cores aloft.

Brick Tamland/Alexander Darkband
I used mainly lightning jump and Prob of Svr. This was helpful with increasing confidence in issuing warnings but was not a deciding factor to warn. CI was used the first 3 to 4 hours of the shift before the CI shield became to thick to make it useful. Was able to assist the warning operator during the first two hours of the shift of where to be looking for development based on CI from satellite. This would have been more useful with much better familiarization of the CWA.
Saw some impressive hail spikes and deep convection today.
Lynford
 -SRF
-SRF