Daily Summary: Week 4, Day 4

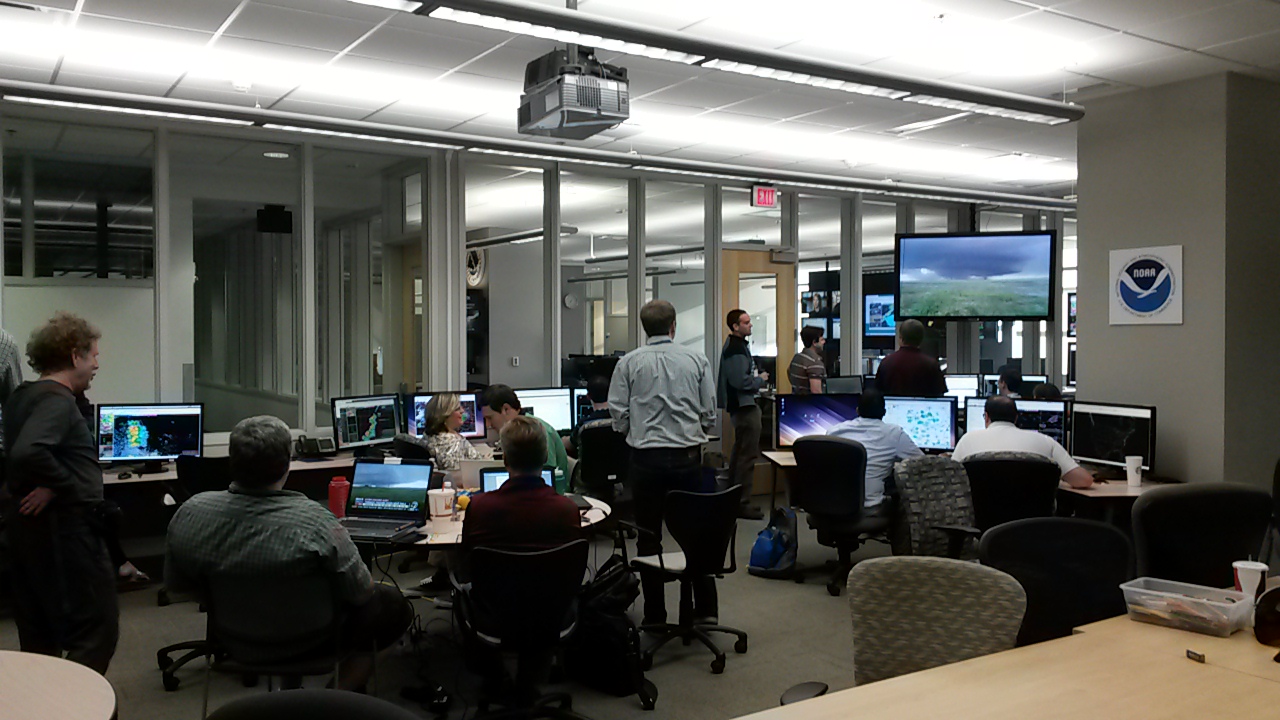
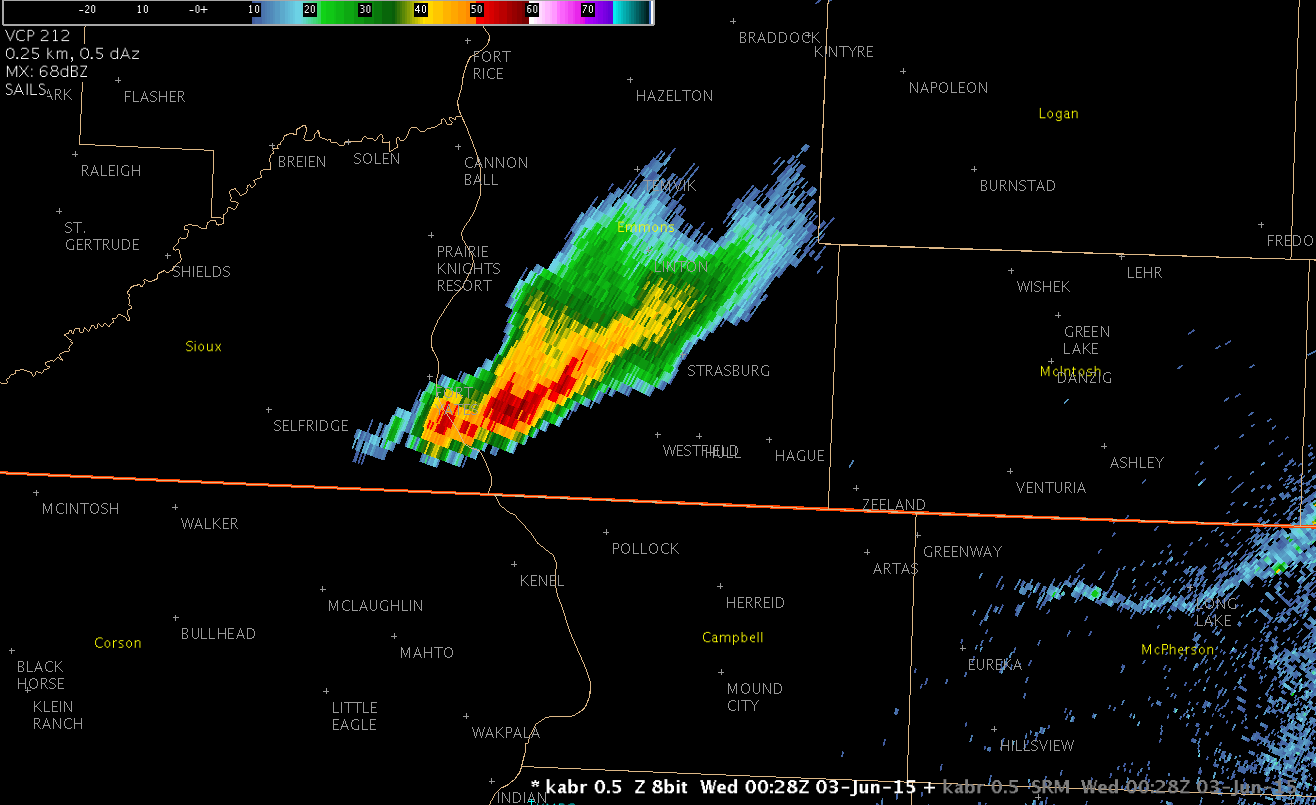
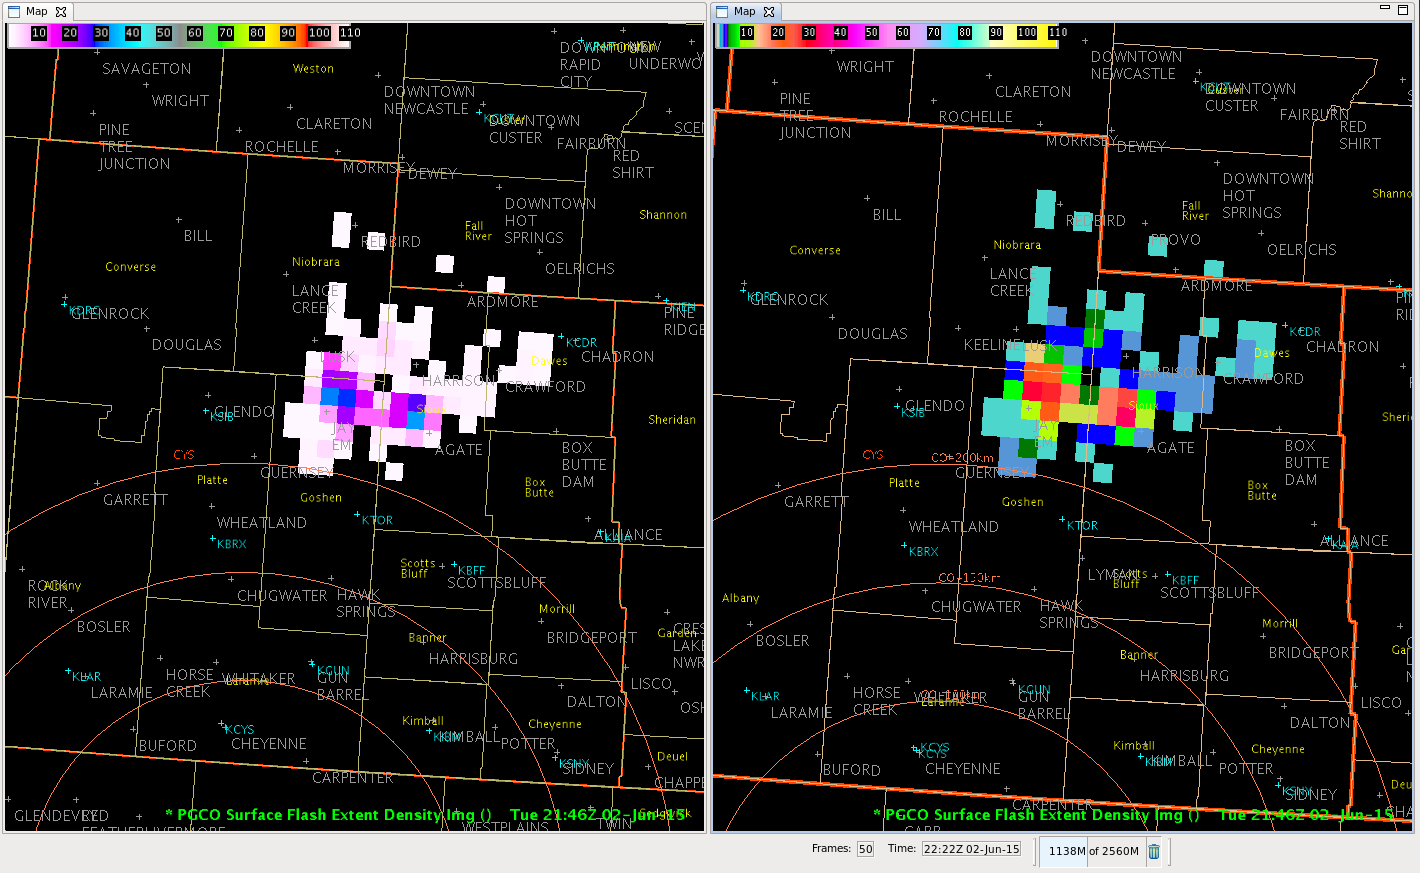
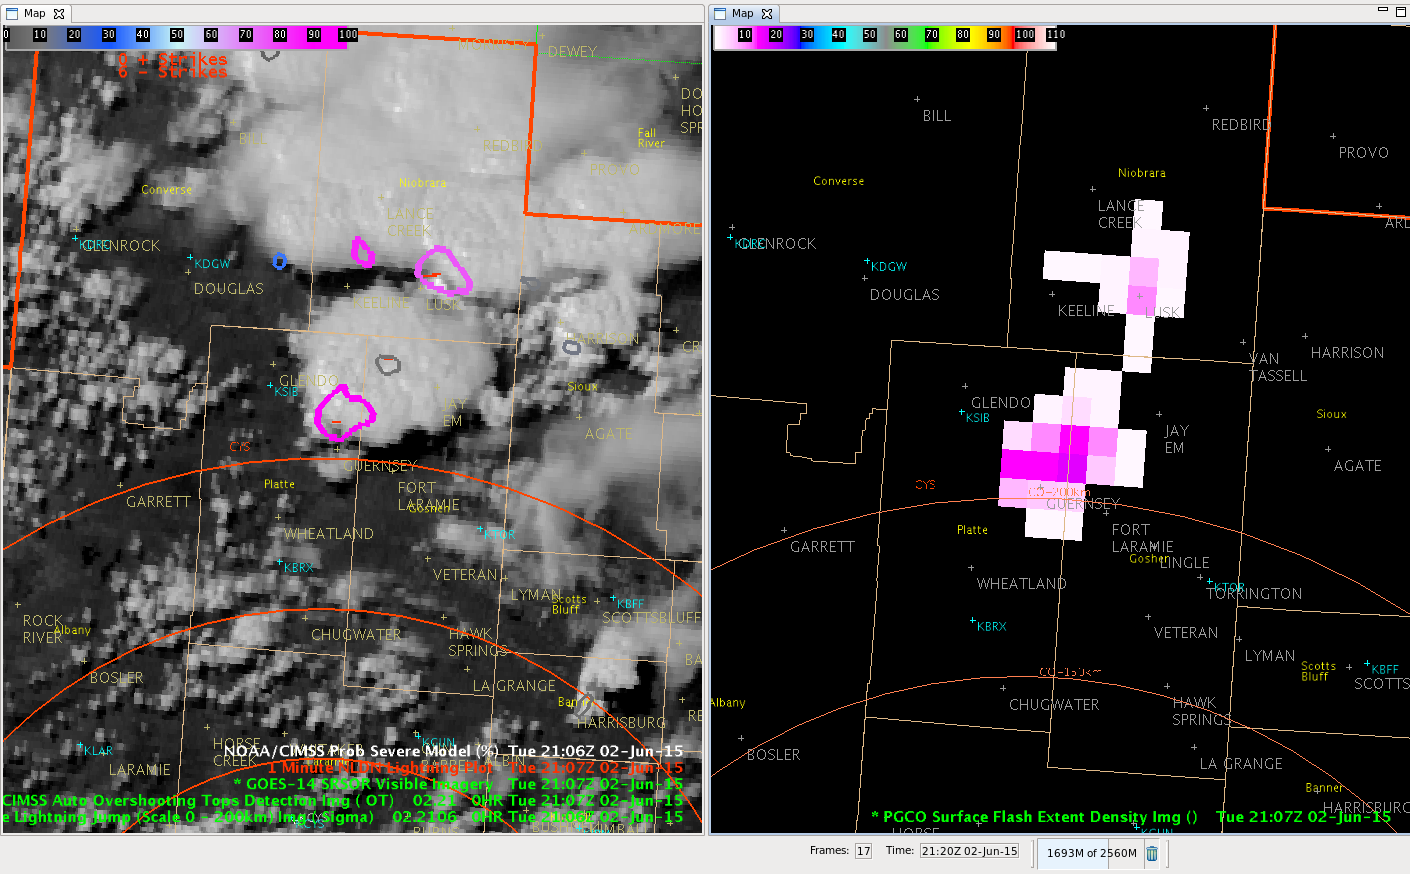
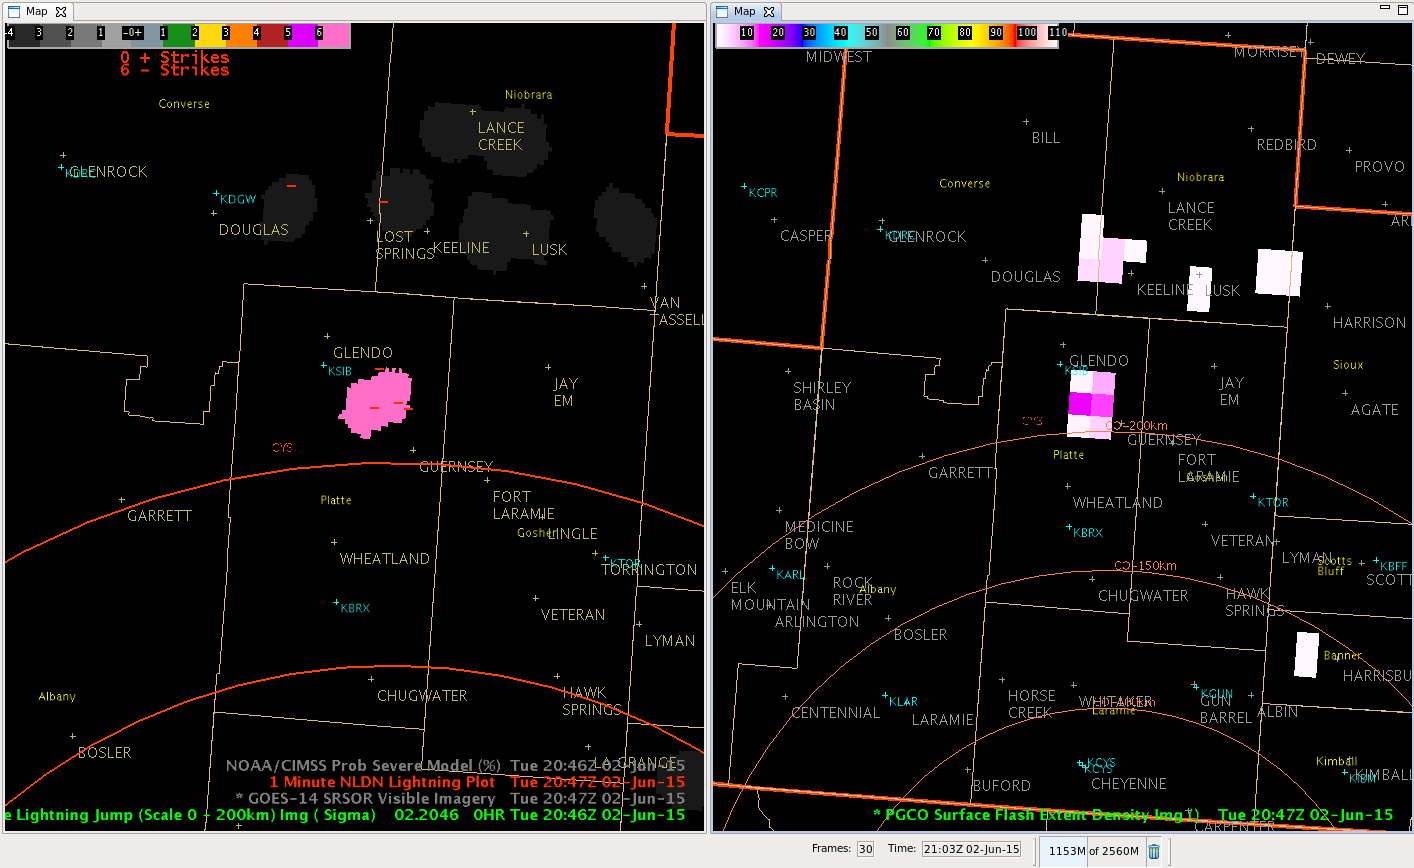
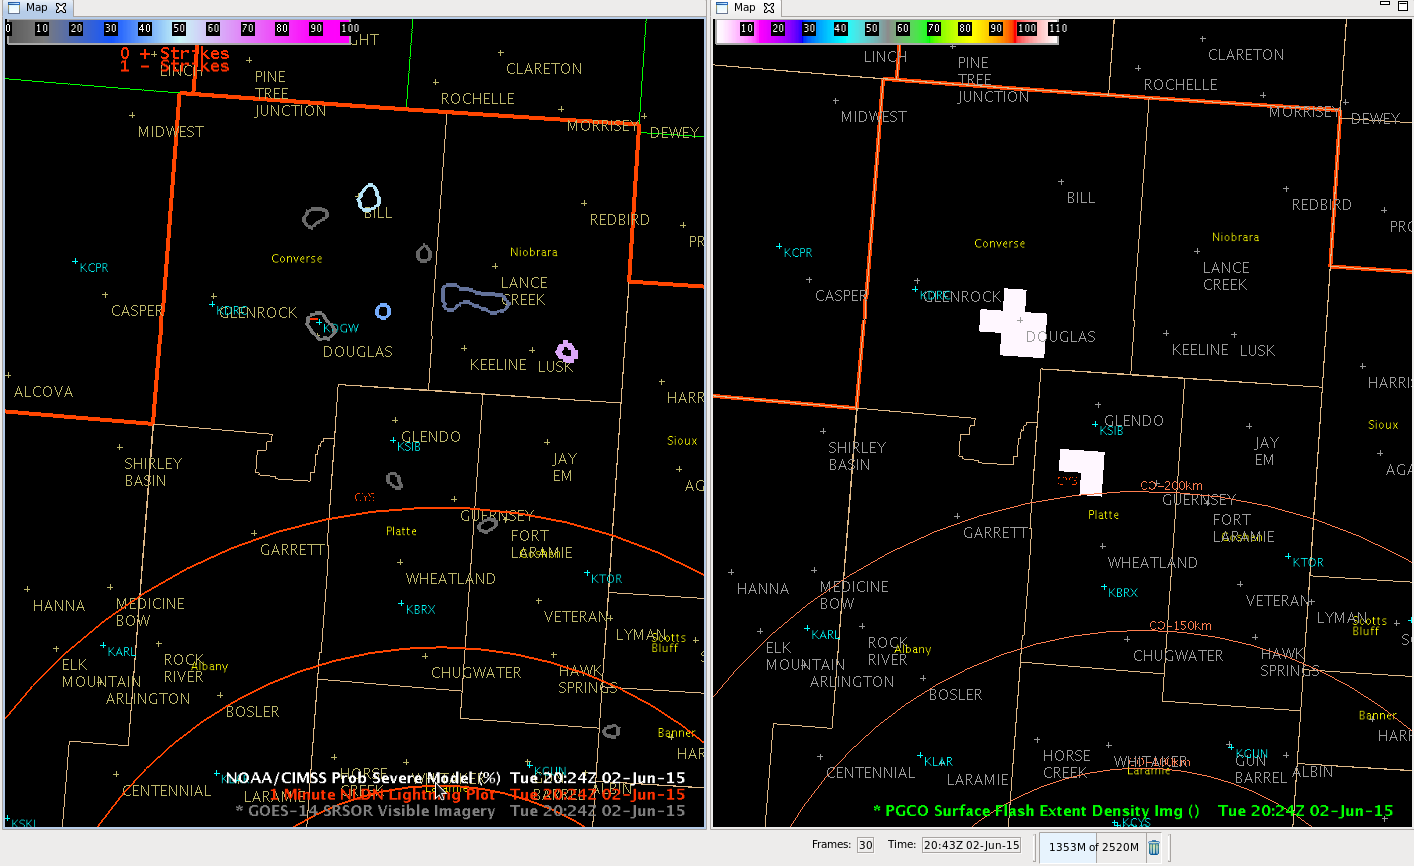
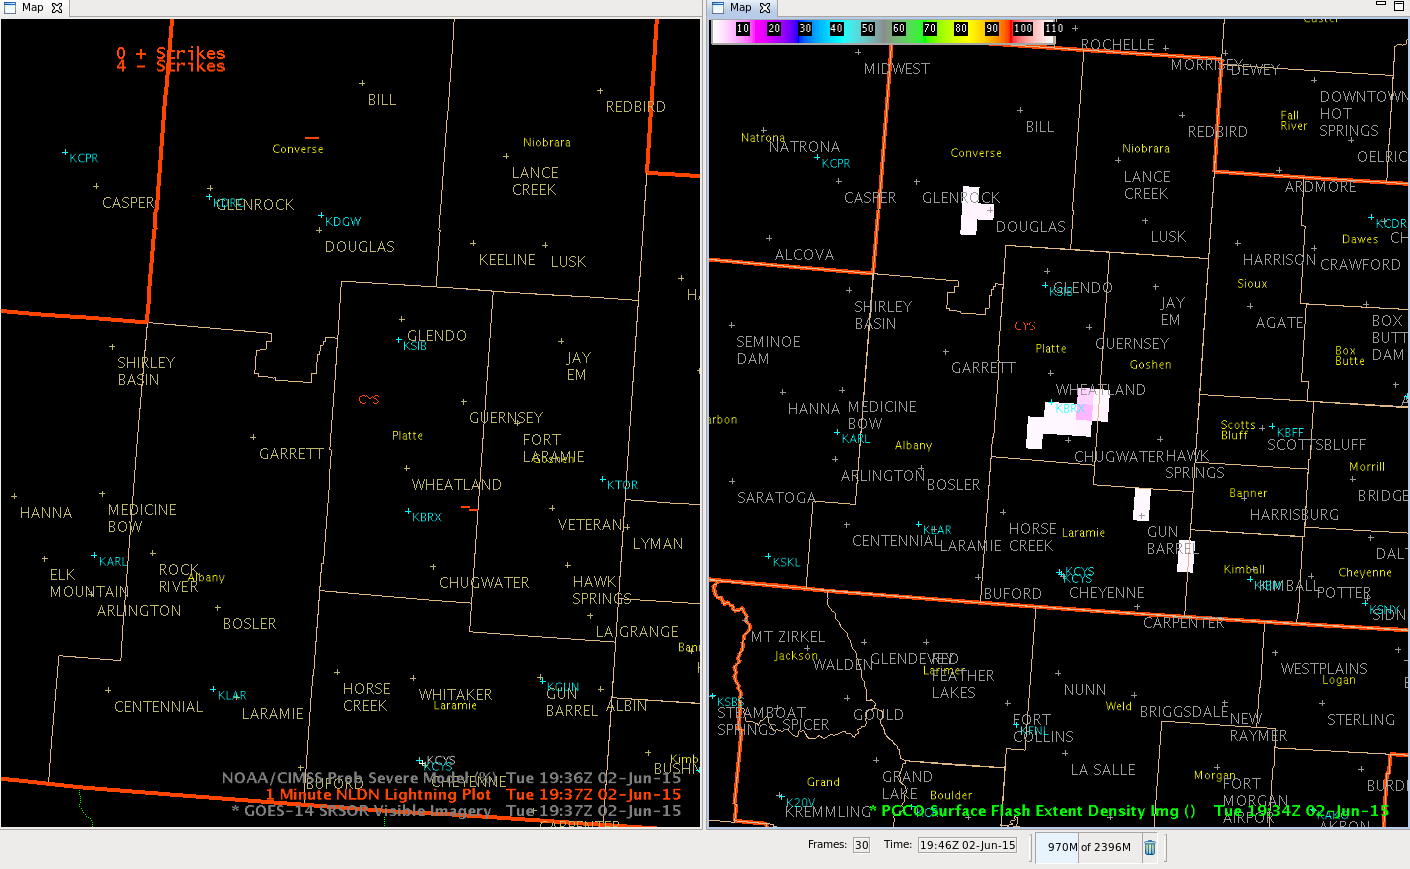
The final day of forecast activities for week 4 didn’t see much change geographically, with groups operating in the Boulder, Goodland, and Hastings CWA’s. The Goodland group would later move to Dodge City as activity to the south looked a little more promising. Once again, the Boulder group found the PGLM total lightning Flash Extent Density and Lightning Jump information to be quite valuable in monitoring fluctuations in storm/updraft intensity. One particularly strong storm near Simla, CO produced a tornado from which we were able to view live streaming footage (see image below). Activity in the other CWA’s, was a little slow to develop, giving participants ample time to evaluate the pre-convective products.

– Bill Line, SPC/HWT Satellite Liaison and Week 4 EWP Coordinator

20150604_190539


Tags: None

Daily Summary: Week 4, Day 3

Today’s activities took us to Cheyenne, Boulder, and Jacksonville, with the Cheyenne group moving to Topeka before ending in Dodge City. The PGLM total lightning Flash Extent Density within the Colorado LMA in NE Colorado saw heavy use with storms that developed in the Boulder CWA. It was nice to have a group operate in the Jacksonville today as it allows us to demonstrate the tools in a different region of the US. This is important considering most of the experiment has been spent west of the Mississippi River thus far. This group, however, did not have access to the 1-min imagery, something they missed dearly! The Boulder group found it helpful to monitor the LAP PWAT products as  moisture quickly approached the front range from the east, tightening the moisture gradient leading up to convective initiation. The approaching feature was also apparent in the 1-min imagery. The NUCAPS, CI, ProbSevere and ENI Lightning products all saw use throughout the day as well.

– Bill Line, SPC/HWT Satellite Liaison and Week 4 EWP Coordinator

Tags: None

Daily Summary: Week 4, Day 2

Today’s activities took us just a little further east into the Bismarck, Billings, and Cheyenne CWA’s. The Cheyenne group would later move to the Aberdeen CWA as activity shifted out of the CWA. Participants were able to analyze the LAP products and later the NUCAPS soundings to get an idea of where severe convection was most likely. The CI product was also monitored for initial development during this period. As convection grew and matured, participants utilized the ProbSevere Model and Lightning Jump to identify significant changes in the storm that would warrant the issuance of a warning. The ENI total lightning products were utilized throughout the life cycle to monitor the evolution of the mature cells. The 1-min satellite imagery was helpful when monitoring for initial convective development, and seeing that development as it occurred, along with failed convective attempts. Additionally, the 1-min imagery along with 10-min winds generated from the imagery aided a forecaster in his assessment of the near-storm environment.


– Bill Line, SPC/HWT Satellite Liaison and Week 4 EWP Coordinator

Tags: None

Thunderstorm weakening as it moves toward Campbell Cty (ABR)

While monitoring a strong thunderstorm moving SE out of Sioux county near Fort Yates earlier this evening, we noted that the cell was beginning to take on bow echo characteristics (0050 UTC).  However, only two volume scans later, the cell began to reform out ahead of its parent cell (0054 UTC).  This broke down the bow echo, and by 0104 UTC, the cell was weakening as it approached the Campbell county line north of Pollock (Figure 1).

Here is the loop of the 0.5 degree KABR radar:

RadarLoop_KABR_3Jun15_0104Z

Fig. 1: Animation of KABR 0.5 degree reflectivity (click to animate)

Another excellent advantage of seeing the 1-minute GOES-14 satellite data is seeing interesting features.  We also noted that, at about the same time that the cell was redeveloping ahead of the parent cell, the clouds also redeveloped out ahead of the original line (Figure 2).

GOES14_1-min_Satellite_loop_3Jun15

Figure 2: Animation of GOES-14 visible satellite (click to animate)

CoonieCatEye

Tags: None

June 2 — Flash Density Color Curve Comparison (CYS)

There has been some question as to the utility of the current default Flash Density color curve or developing different color curves to help forecasters pick out the highest flash densities.

Here is an example of high flash densities we saw this afternoon (2146 UTC) in the CYS CWA, looking at the default color curve and one of the possible options:

FlashDensity_Color_Curve_Comparison


The image on the left is the default color curve, with the right image one of the options. The problem with the right image is the use of blue/green shades and red/orange shades for those that are colorblind.  Those colors can cause problems in figuring out the highest flash rates without use of the sampling tool.  Being a non-colorblind person, I prefer the right image as I was able to pinpoint the highest rates quickly.  It is still a good idea to use the sampling tool with both color curves to ensure finding the highest rates.

CoonieCatEye


Tags: None

June 2 — Rapid growth of 2 supercells across northern CYS CWA

We have been seeing amazingly rapid supercell growth of two cells, one just north of Guernsey and a second near Lusk since 2045Z.  Both cells have also shown rapidly increasing severe probabilities.  The Overshooting Tops algorithm was also indicated with the Lusk cell.

Supercells_2107Z_2June15


The 1-minute GOES-14 visible satellite is showing both supercells very well (L).  The two pink overlays indicate the increasing severe probabilities.  The southern cell north of Guernsey was up to 90 percent, while the cell near Lusk was at 76 percent.  Since 2107Z, the Lusk cell severe probabilities increased to 89 percent at 2110Z. along with several CG lightning strokes.  The 2107Z Flash Density (R) was up to 17/minute with the Gurensey cell, and 10/minute with the Lusk cell.

CoonieCatEye/MacGyver


Tags: None

June 2 — Lightning Jump coincides with Large Flash Density (CYS)

Just a few minutes after my previous post on distant flash density, we got a lightning jump along with several CG lightning strokes AND a large flash density.  The lightning jump was up to 6 sigma!

CGLrng_FlashDensity_2June15_2047Z

Note the 6 sigma lightning jump on the left screen along with 4 CG lightning strokes, while the flash density was up to 16 per minute!

This cell persisted with its density rate as the severe probability quickly increased to 90 percent by 256 PM.  The overshootimg top algorithm also turned on with another supercell that developed near Lusk, WY.

CoonieCatEye

Tags: None

June 2 — Flash Rates vs. CG Ltng outside LMA Range of Efficiency (CYS)

I had been noticing that the LMA Flash Density has been occasionally reporting outside the maximum range of efficiency well north of the sensor array in north central Colorado, over 200 km away.  Even though the flash rate is low (only around 1 flash/minute), it did pick up on one CG lightning stroke in the Douglas area this afternoon, which occurred coincident to the flash report.  See Figure 1 below.

DistantFlash_CGLtng_2Jun15_2024Z


Fig.1  One CG lightning strike near Douglas (KDGW) (L) and the Flash Density (R)

Appears this may be due to increasing cloud heights and possible glaciation rate aloft.

CoonieCatEye

Tags: None

June 2 — Timing from Flash Density to CG Ltng (CYS CWA)

While monitoring the 1-minute satellite and NLDN data, noted that the Surface Flash Density product begins to show in increase in in-cloud density about 2-3 minutes before noting CG lightning strikes.  Check out the comparison on Figure 1.

LtngStrike_FlashDensity_Compare_2Jun15_1937ZFig 1.  NLDN Lightning Plot at 1937 UTC (L) and Surface Flash Density at 1934 UTC (R)

This appears to give a short fused indicator of CG strikes close to the flash density areas, especially as they increase. Expect to see increasing flash densities and CG lightning as the boundary moves NE through this afternoon.

CoonieCatEye

“Surface Flash Density” here refers to the Pseudo Geostationary Lightning Mapper (PGLM) Flash Extend Density product, which is showing Total Lightning (IC and CG) information from Lightning Mapping Arrays processed to an 8 km grid, similar to what we will see from the GOES-R GLM. – BL

Tags: None

Daily Summary: Week 4, Day 1

After a week off, the EWP Spring Warning Project resumed in the Hazardous Weather Testbed. With much of the first 3 weeks of activities taking place in Texas, it is refreshing to have a change in the weather pattern, taking us north this week. Today, we had our 3 pairs of forecasters operate in the Bismarck, Pocatello, and Pendleton CWA’s. It is beneficial to have the algorithms evaluated in a variety geographic regions, so today’s northwest convection was welcomed. With a slow start to convection, participants had ample opportunity to become familiar with all of the GOES-R and ENTL products under evaluation. By the end of the day, as convective activity amped up, participants were comfortable using the products to issue short-term forecasts and warnings.

Tomorrow’s activities will begin at 1 pm, and will likely make a slight shift eastward with the most active convective weather.

– Bill Line, SPC/HWT Satellite Liaison and Week 4 EWP Coordinator

Tags: None