
While monitoring the 1-minute satellite and NLDN data, noted that the Surface Flash Density product begins to show in increase in in-cloud density about 2-3 minutes before noting CG lightning strikes. Check out the comparison on Figure 1.
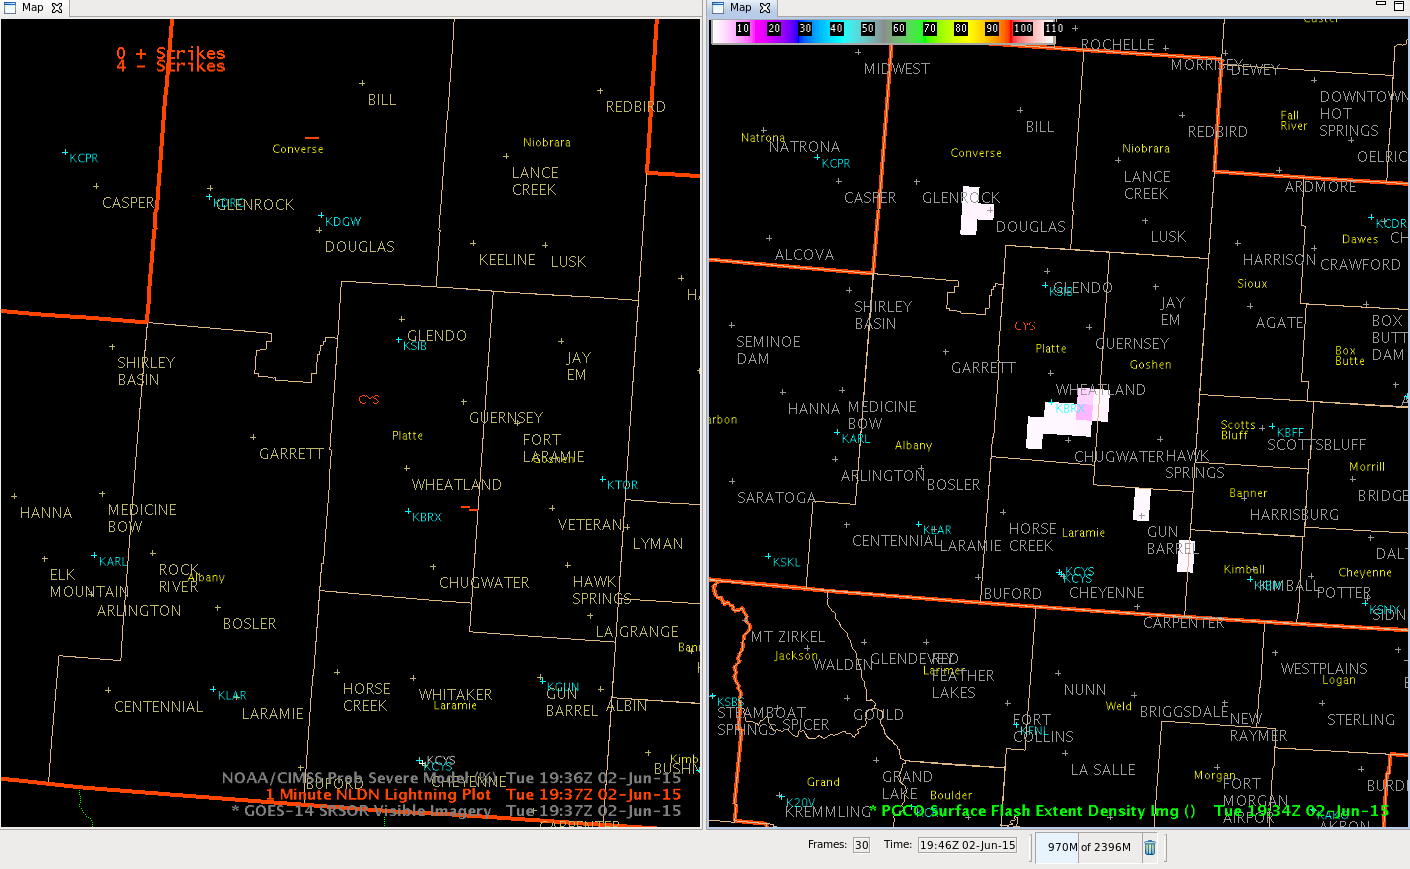 Fig 1. NLDN Lightning Plot at 1937 UTC (L) and Surface Flash Density at 1934 UTC (R)
This appears to give a short fused indicator of CG strikes close to the flash density areas, especially as they increase. Expect to see increasing flash densities and CG lightning as the boundary moves NE through this afternoon.
CoonieCatEye
“Surface Flash Density” here refers to the Pseudo Geostationary Lightning Mapper (PGLM) Flash Extend Density product, which is showing Total Lightning (IC and CG) information from Lightning Mapping Arrays processed to an 8 km grid, similar to what we will see from the GOES-R GLM. – BL