ENI compared to LJ

I’ve noticed a few cases today where the Lightning Jump Algorithm and ENI polygons and time series data do not line up as I might have imagined. Lightning jump is based on radar data whereas the ENI polygons and time series data use the Earth Network lightning data. Beam blockage due to the terrain in the Pocatello CWA may have affected the radar data going into the lightning jump which may account for some of the differences.

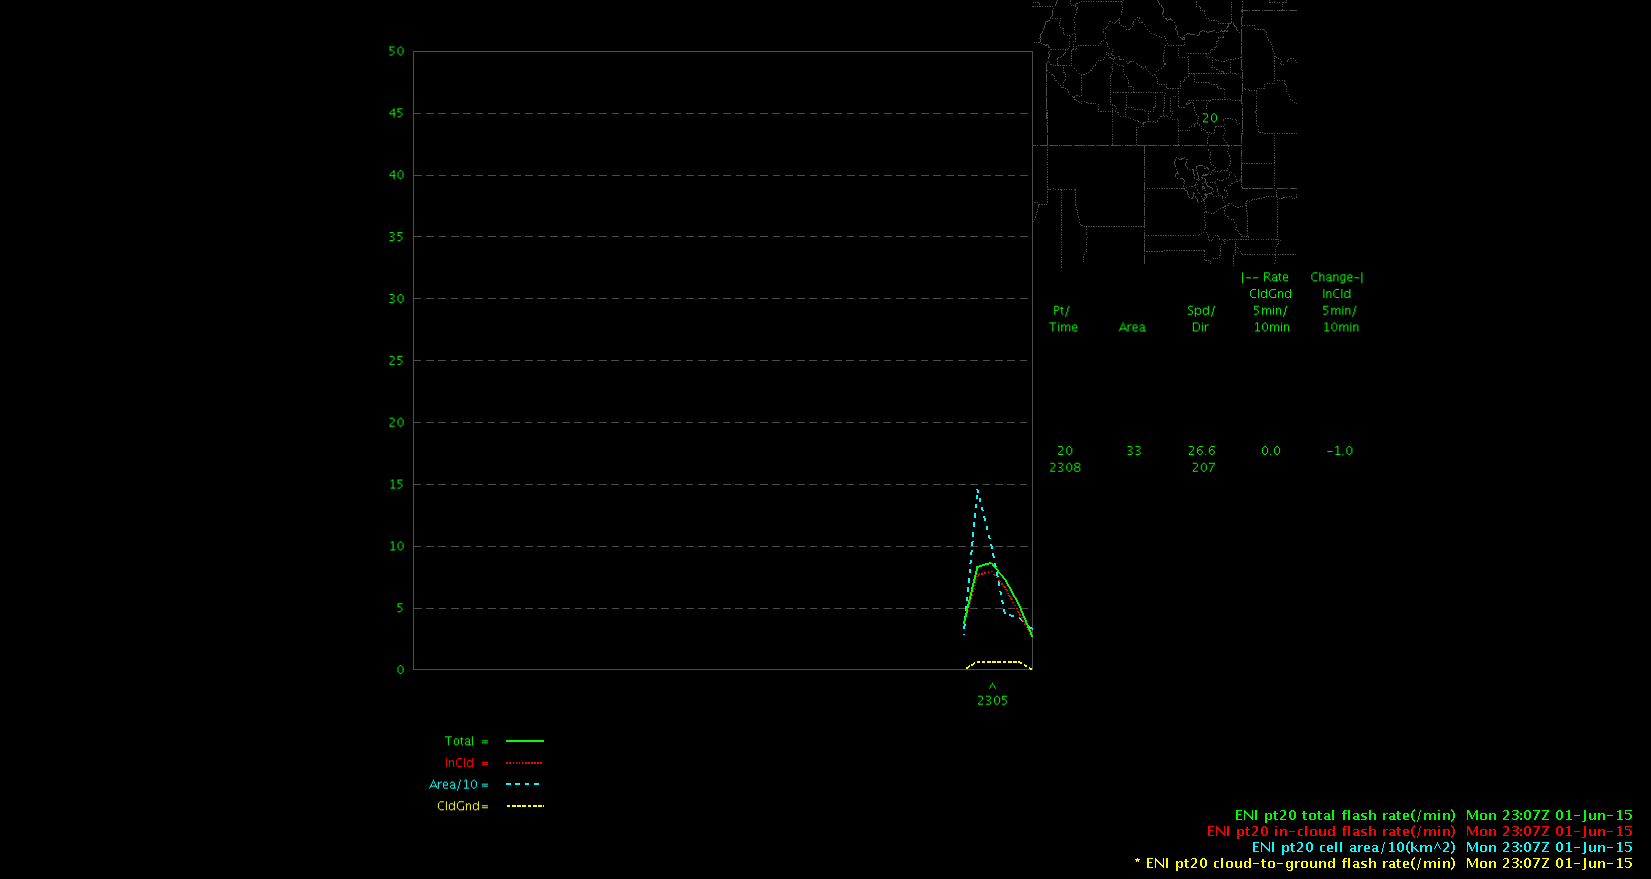
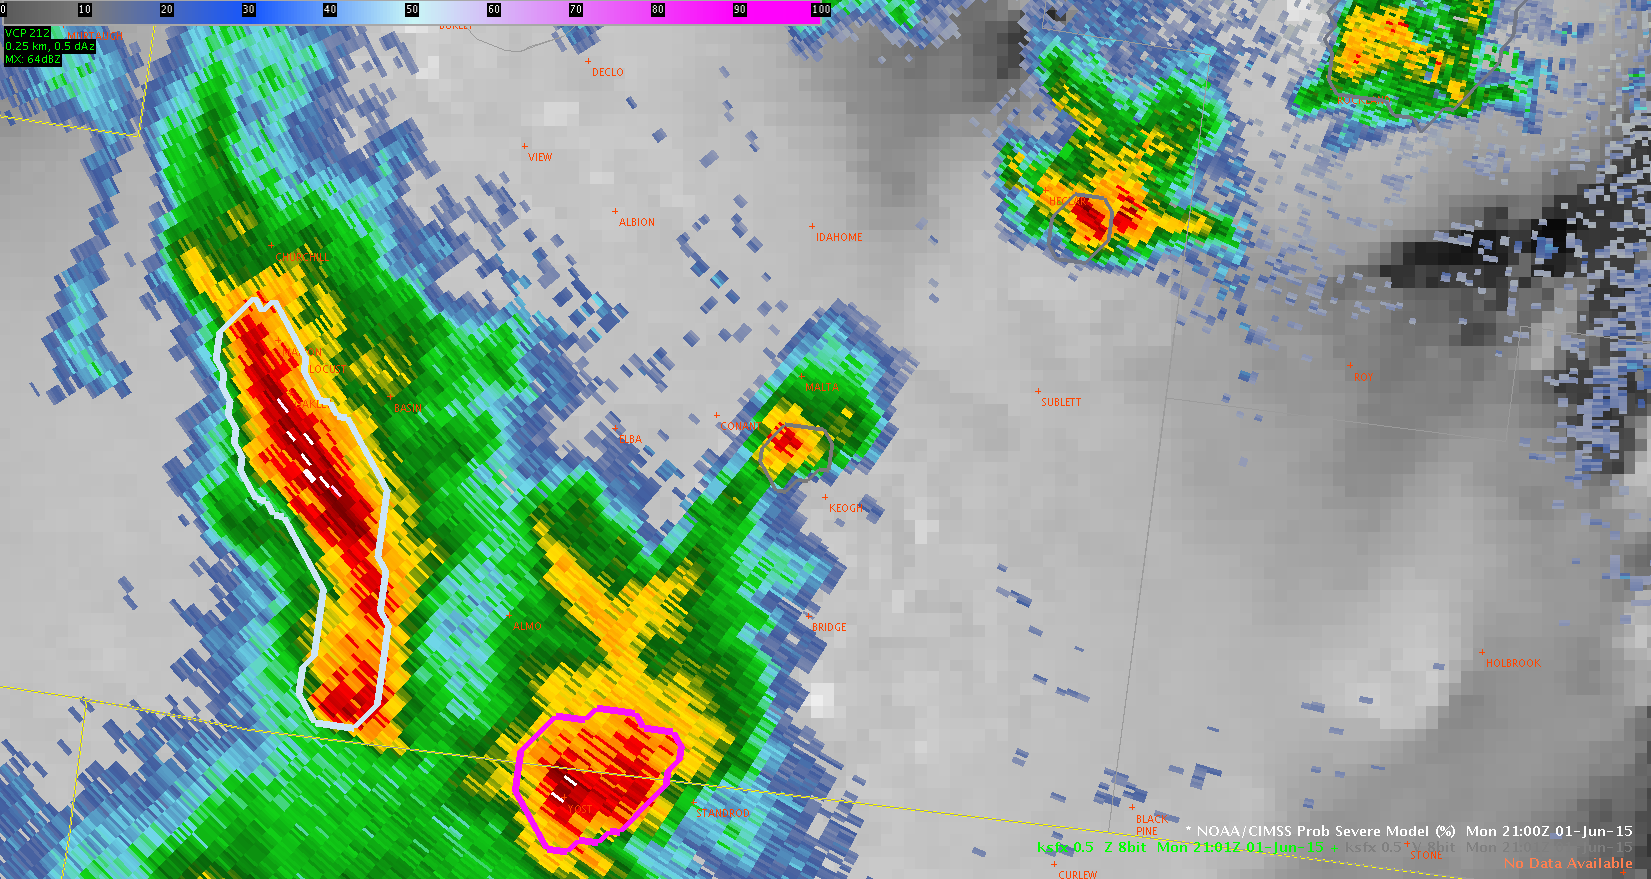
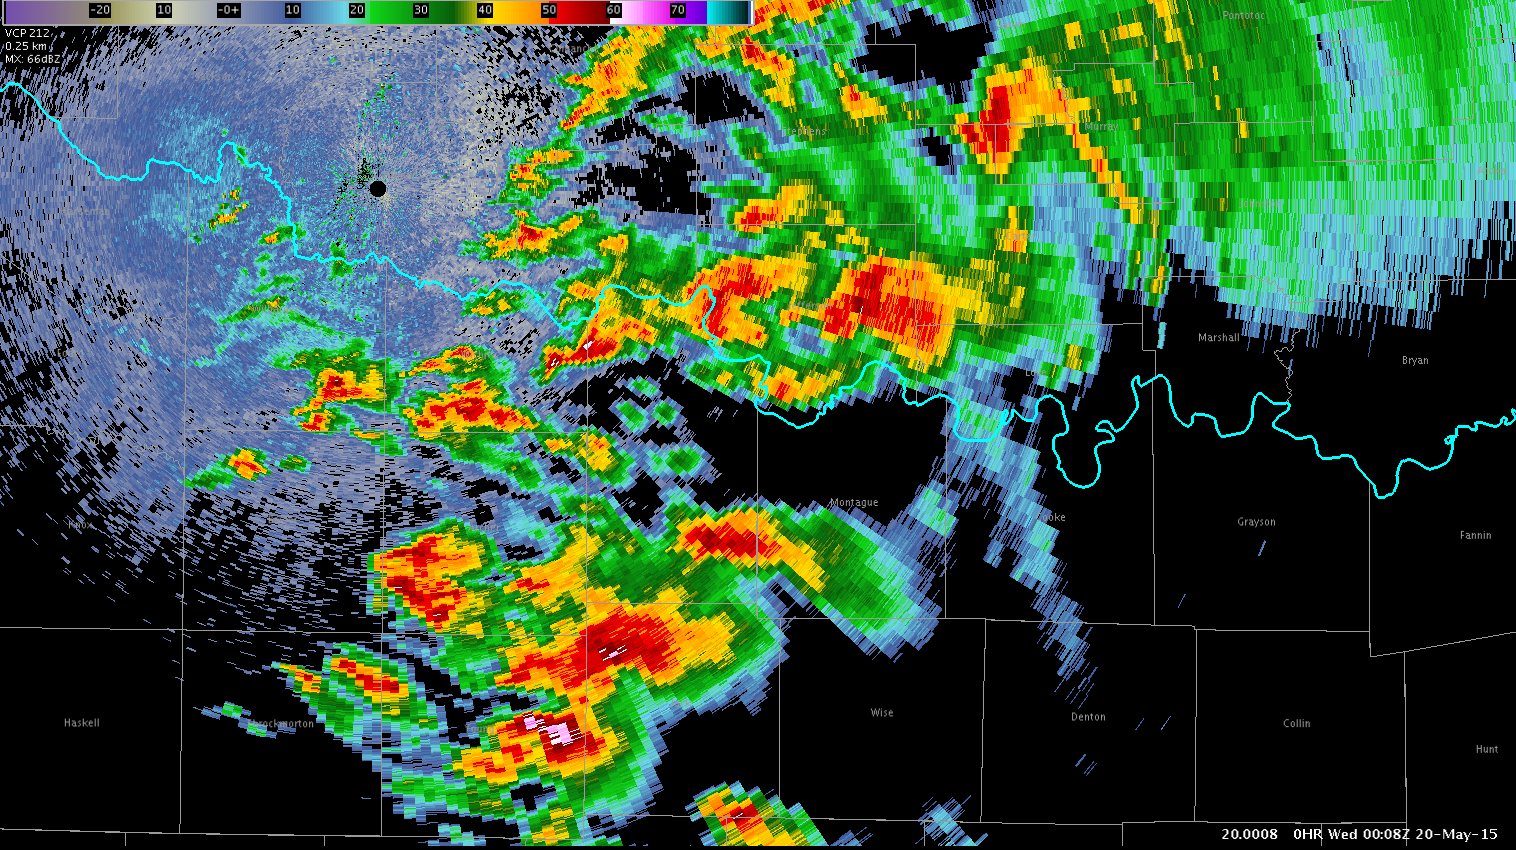
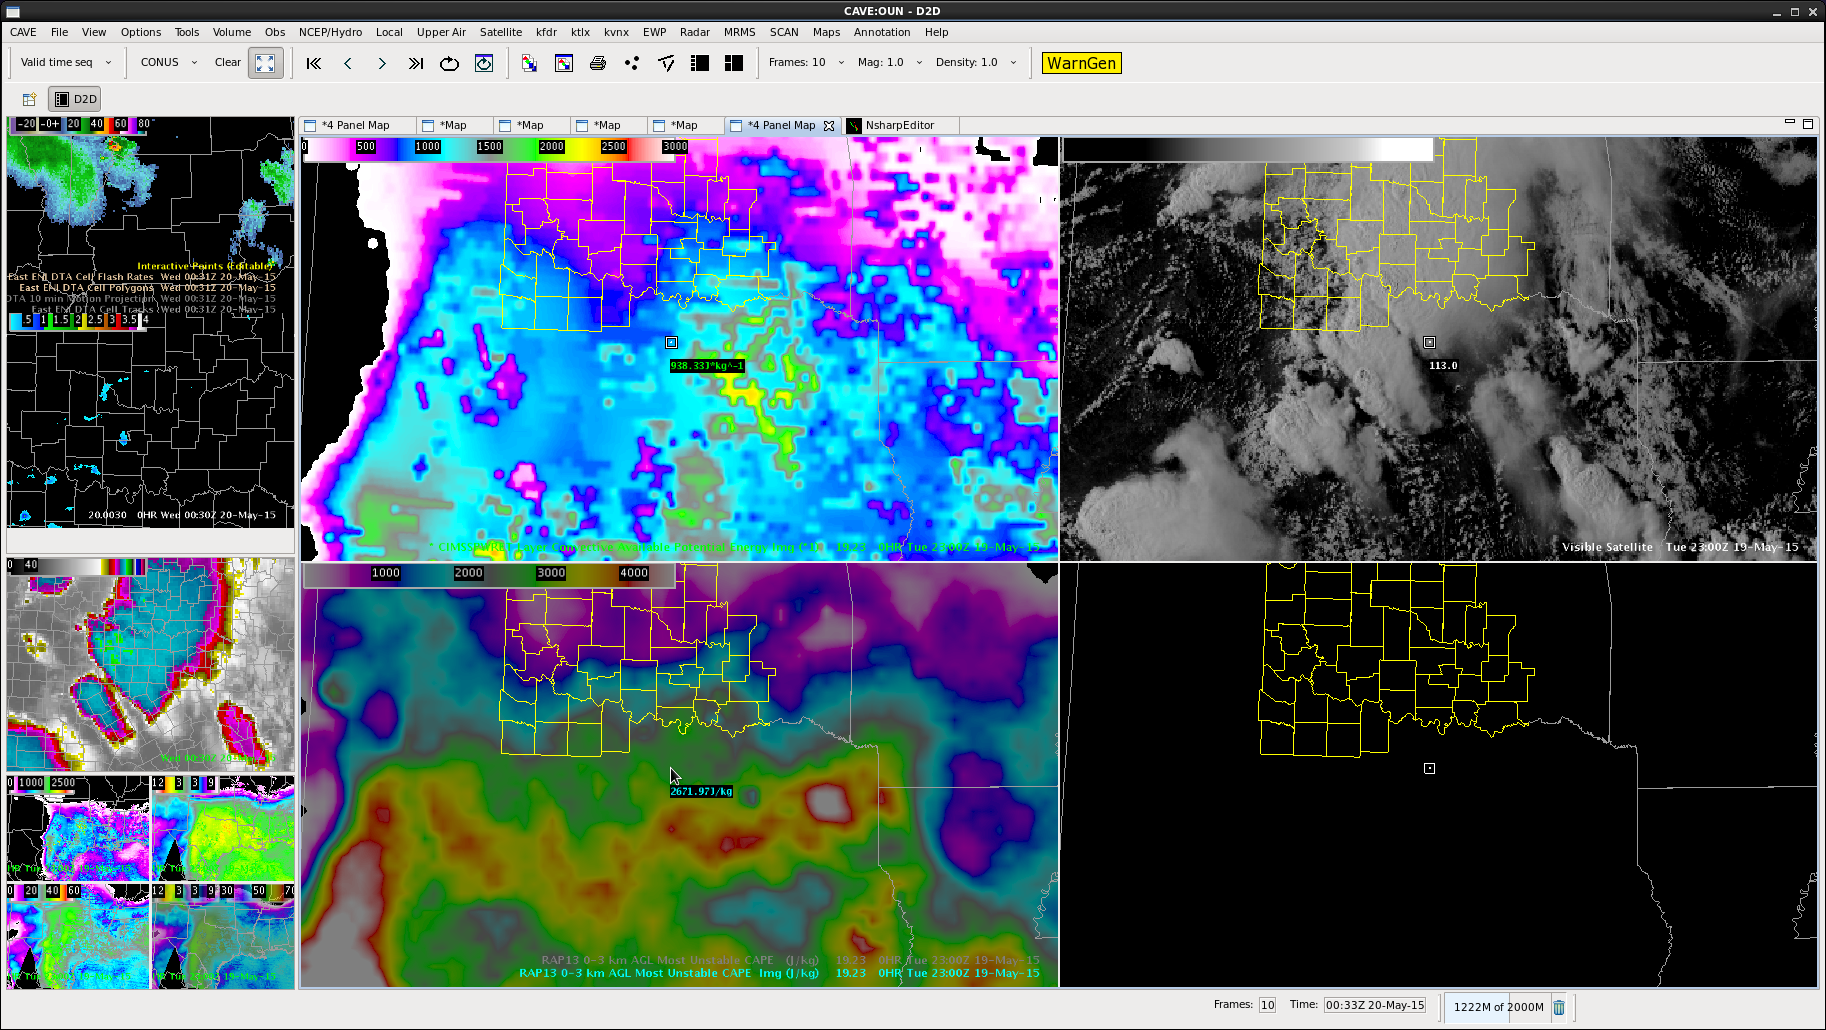
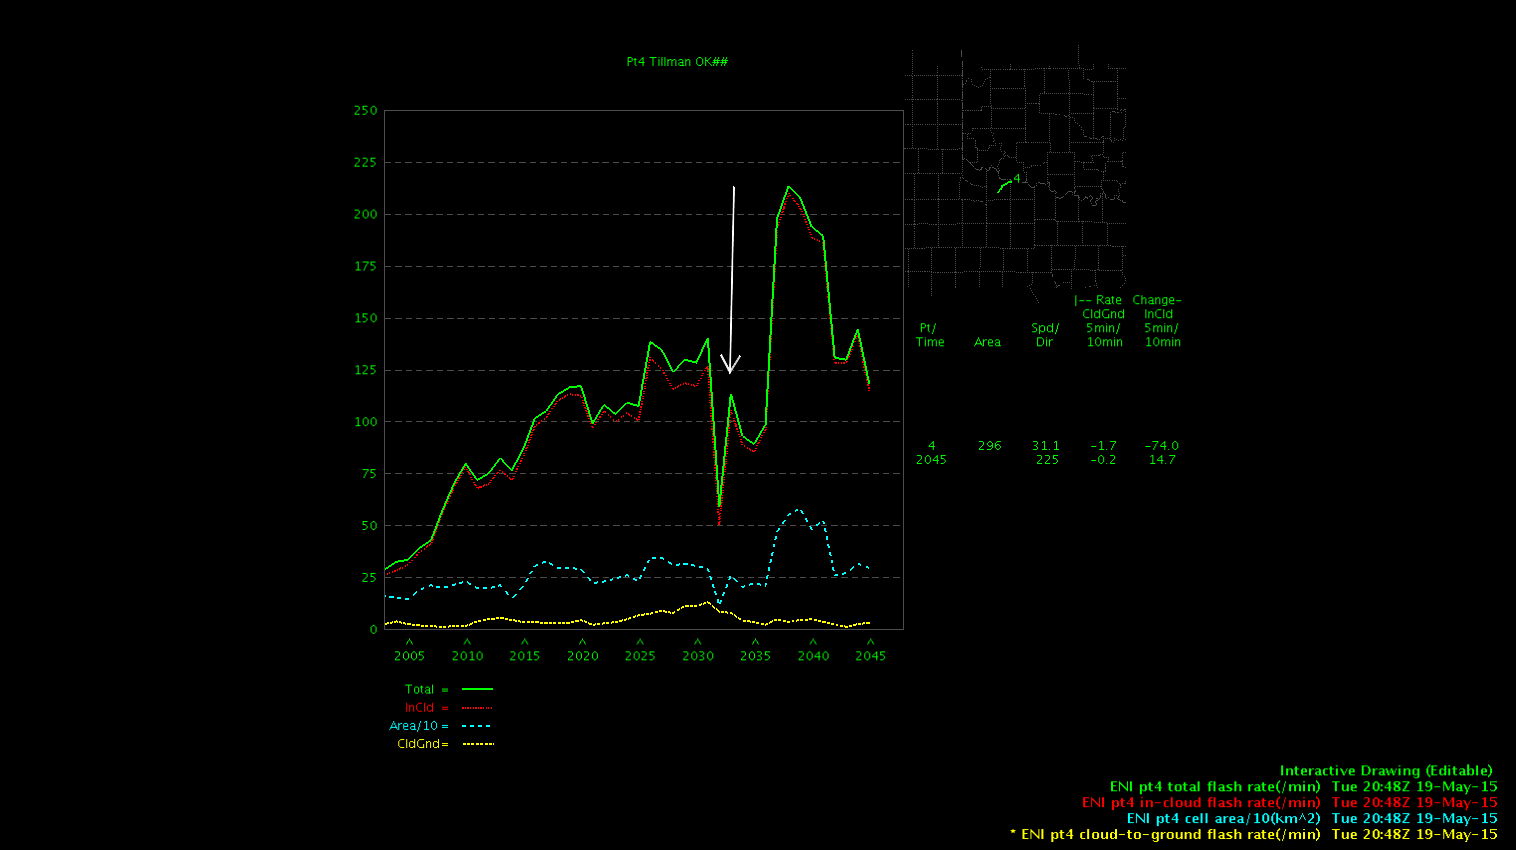
In the example below, the lightning jump algorithm shows a value of 6 sigma at 2301Z whereas the ENI time series shows only a relatively small increase in lightning activity at this time.

LJumpENIflashENItimeseries-Helen Hunt

Tags: None

Thoughts on Overshooting Tops and 1 min imagery

I was trying to think of how to use the overshooting top algorithm in warning ops.  The current 15 minute data it is useless to me.  I would be interested in the trend and the duration of the overshooting top for issuing warnings.  The longer the overshooting top, the more likely it will have severe weather.  As a result, the only data that would work for me is 1 min data.  I can compare this to the radar data as I get it.  I do not think that the 5 min data will work as it will wash out trends and the true nature of the atmosphere.

This made me think of QLCS and HSLC tornadoes.  If I had near real time one minute satellite data, I could find the strongest updraft in the line.  This could have a huge impact on these warnings, the FAR and POD for these storms.  The other thing that would help this would be a local maximum cloud top algorithm.  For example, make a 200 km x 200 km grid.  Use some nearest neighbour algorithm and find a local max in cloud tops.  This could lead to lead time with QLCS and HSLC storms.

Williams and MacGyver

Tags: None

Lightning Jump to 8 sigma

Click on the animated gif below to see how the lightning jump algorithm increased from 0 sigma at 2210Z to 4 sigma at 2211Z to 8 sigma at 2212Z. This was a great clue that the updraft of the storm was strengthening and that a warning may be necessary. We used this information in conjunction with the Prob Severe which was showing an increasing trend to go ahead and pull the trigger on a severe thunderstorm warning. It was interesting that although Prob Severe was showing an increasing trend, it was not over the 80% threshold. In this case, the lightning jump algorithm alerted us more than Prob Severe whereas we’ve seen other cases today where Prob Severe has been high and the lightning jump algorithm has been lower than expected.

LJA-Helen Hunt

Tags: None

ENI, LJA & ProbSevere Used in Warning Decision

Overlaying point ’20’ with the West ENI DTA cell flash rate polygon showed significant increases in lightning activity in the time series product at at 2100Z and 2115Z. This was a good indicator that we needed to keep an eye on the storms and consider a warning due to a strengthening updraft. We probably should have issued the warning when we saw the first significant increase around 2100Z instead of waiting until 2115Z. ENIflashratesENIThe lightning jump algorithm product shown below displayed a value of 2 sigma at 2113Z on the same storm. I would have expected a higher sigma value, but the algorithm takes into account the big dip that we see at 2110Z, which averages out to an overall lower sigma value.

LJThe NOAA/CIMSS prob severe model percent increased to 87% (shown in magenta) at 2102Z. We did not issue the warning until 2115Z, but probably could have gotten a longer lead time had we issued it when the prob severe first increased at 2102Z.

ProbSevereThe warning has not verified yet, but it is in a very rural area.

Warning

-Helen Hunt

Tags: None

GOES-R Products Aid in Mesoscale Analysis over Pocatello CWA

The GOES-R LAP products show an area of elevated CAPE values up to 1500 J/kg in the south-western portion of the Pocatello CWA. The GOES-R LAP PWAT product also shows the highest values (up to 1 inch) over the same area. Looking at some of the LAP products over the past few hours, the instability has increased and the environment has become increasingly more favorable for storm activity. Most of the convection is currently located further west, so expect storm activity to intensify as it moves east into this more favorable environment. The GOES-14-1-Minute visible satellite imagery shows increasing cumulus development over much of the CWA. There is also an area of thicker cloud cover across the northern and western parts of the CWA which may create a differential heating boundary.

LAPCAPE-Helen Hunt

Tags: None

ENI Flash Rates and Cell Track Show RM Supercell Change

A right-moving supercell with a tornadic history in srn OK experienced rapidly decreasing flash rates, followed by a sharp turn left. Flash rates dropped from 150, to 50% of their previous values, into the 70-80/min range. Having the Cell DTA rate tracking, the turn to the left, and out of the warning polygon, was clearly seen.

RightMoverChangesDirectionRocky


Phi1 Phi2

Tags: None

ENI Flash Rate Values and Track Help In Tornado Warning

A tornado warning was issued on a strong storm which was intensifying with a slow ramp up in lightning flash rate from around 100 to ~200. The storm appeared to be bending its track to the east more (right mover) and this was confirmed with the use of the history DTA rate track of >50/min. This assisted me in drawing my warning polygon downstream (bent it more east [like Beckham]). The loop provides a summary of my thoughts and the tornado warning referenced is the second tornado warning issued at 2255Z.

Continue to find alerts are not useful and are more of a distraction – prefer the raw data displays. Feel the loop below is a very useful display for ETN data in the warning process. The cell tracking did struggle with expansion and contraction as the northern storm provided a larger polygon (merger). But, I was still able to gain useful trend data even with the bouncing cell polygon due to the merging.

RedRiver_CellFlashRates_DTARocky

Tags: None

ENI Cell Definitions Critical To Effective Use

Using ENI cell polygons and cell flash rates to monitor for severe storms can be challenging if the cell definitions change to many times during a storms lifecycle. The loop below is a nice example of a supercell storm with a tornado confirmed where the cell definitions kept changing from one to two. Cell trend time v height plots would stop plotting and the user would have to reset the display. Possibly allowing a larger areal extent to a cell would allow isolated storms to remain as one defined cell, making the algorithm data easier to use. The loop below illustrates this well for the storm in question.

Further, I seem to be drawn to the cell flash rate plots for lightning interrogation.

2033Z_CellPoly_Rates


Tags: None

ENI Lightning Dip With Tornado

Two tornado reports were received with a storm northeast of Electra, TX near the Red River and around the same time, a drop in the total lightning data was observed. Although the ENI polygons converted to two polygons for the storm at 2020Z, the total lightning drop looks appropriate.

Display: The lightning drop was best seen in the trend box time v height display.

2033Z_CellPoly_Rates 2033Z_TorReport_LightningTrend

Tags: None