ENI 300% Flash Increase, To Warn or Not To Warn?

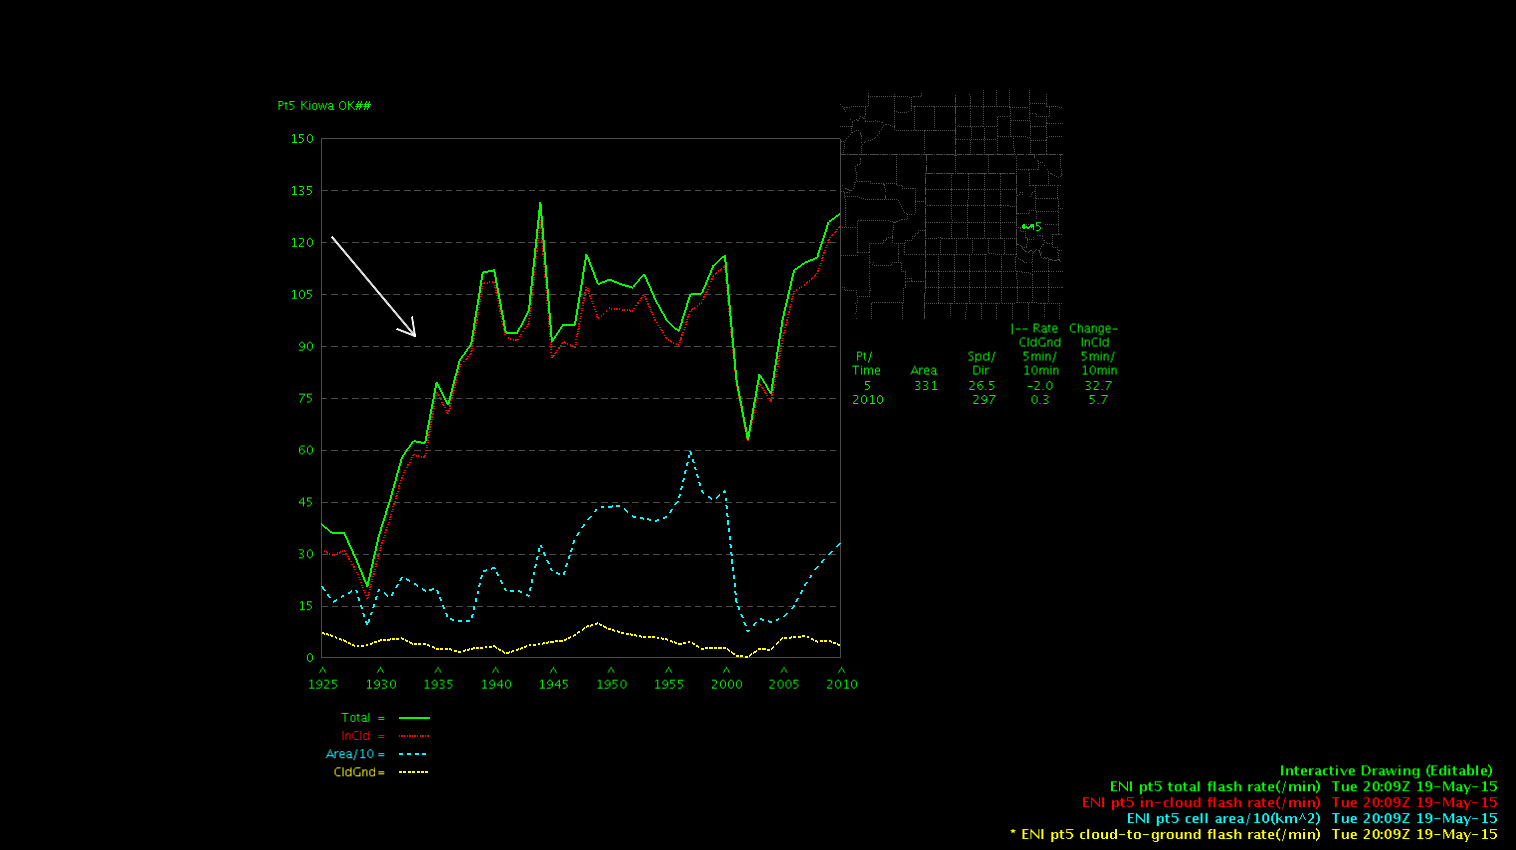
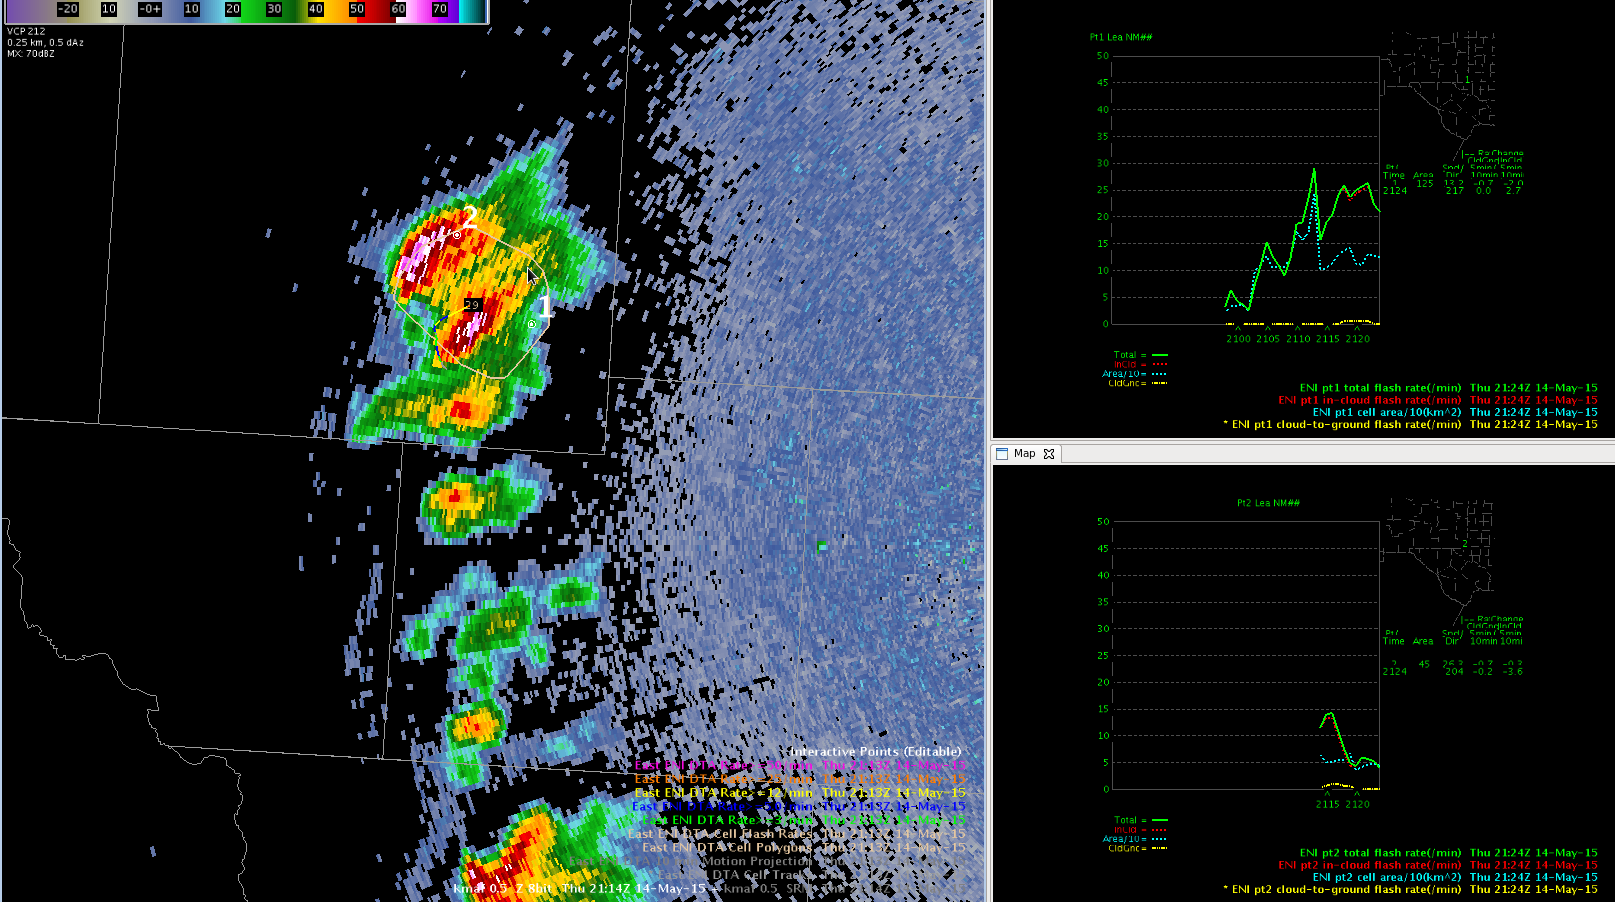
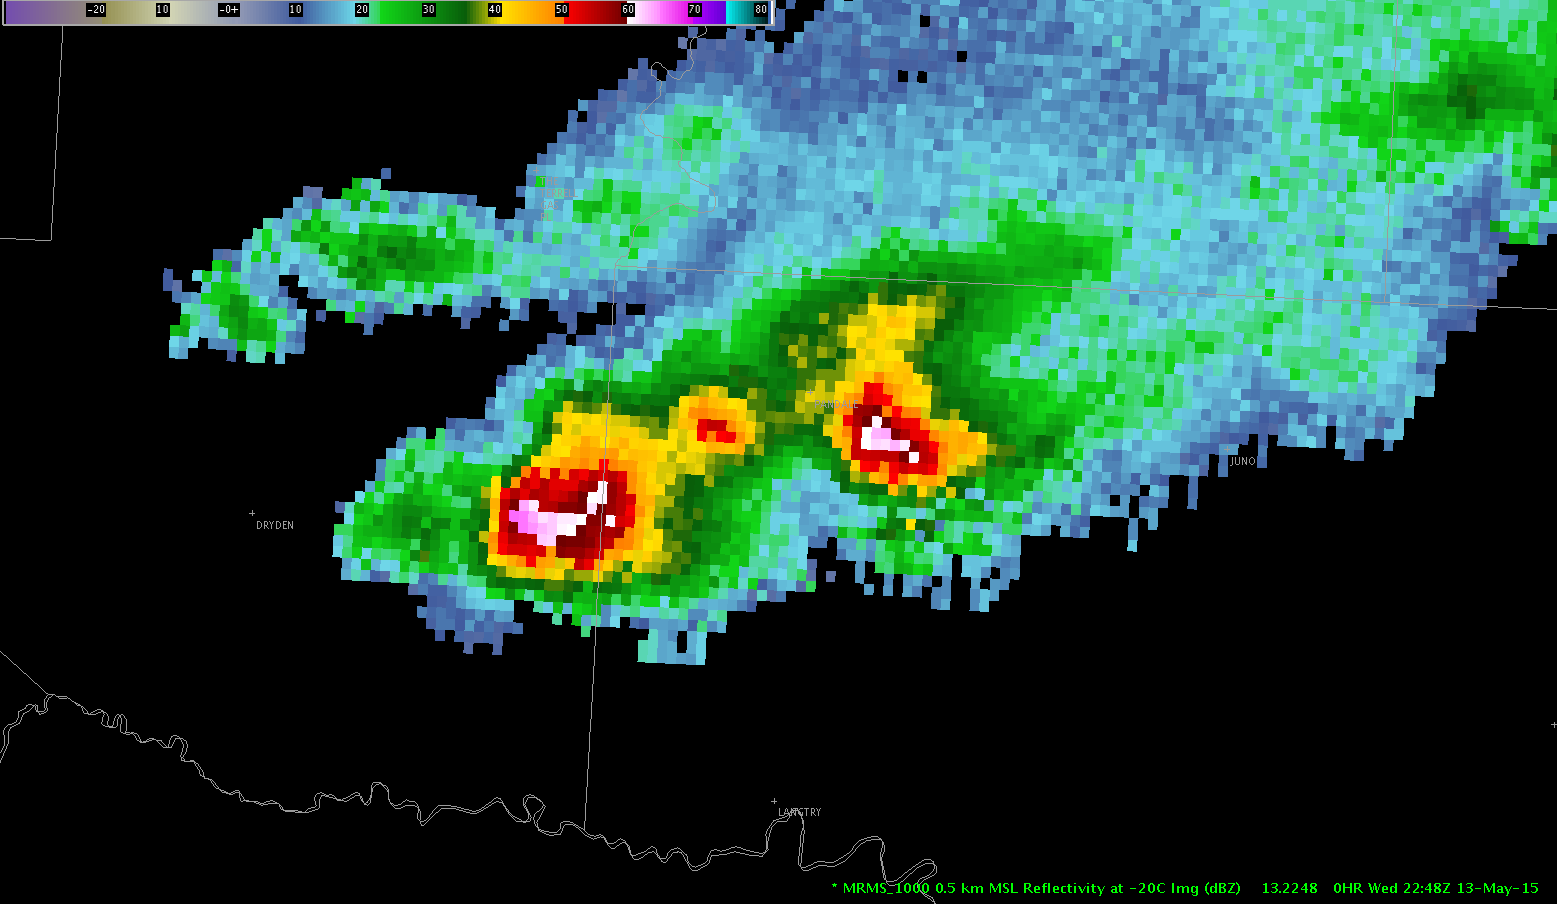
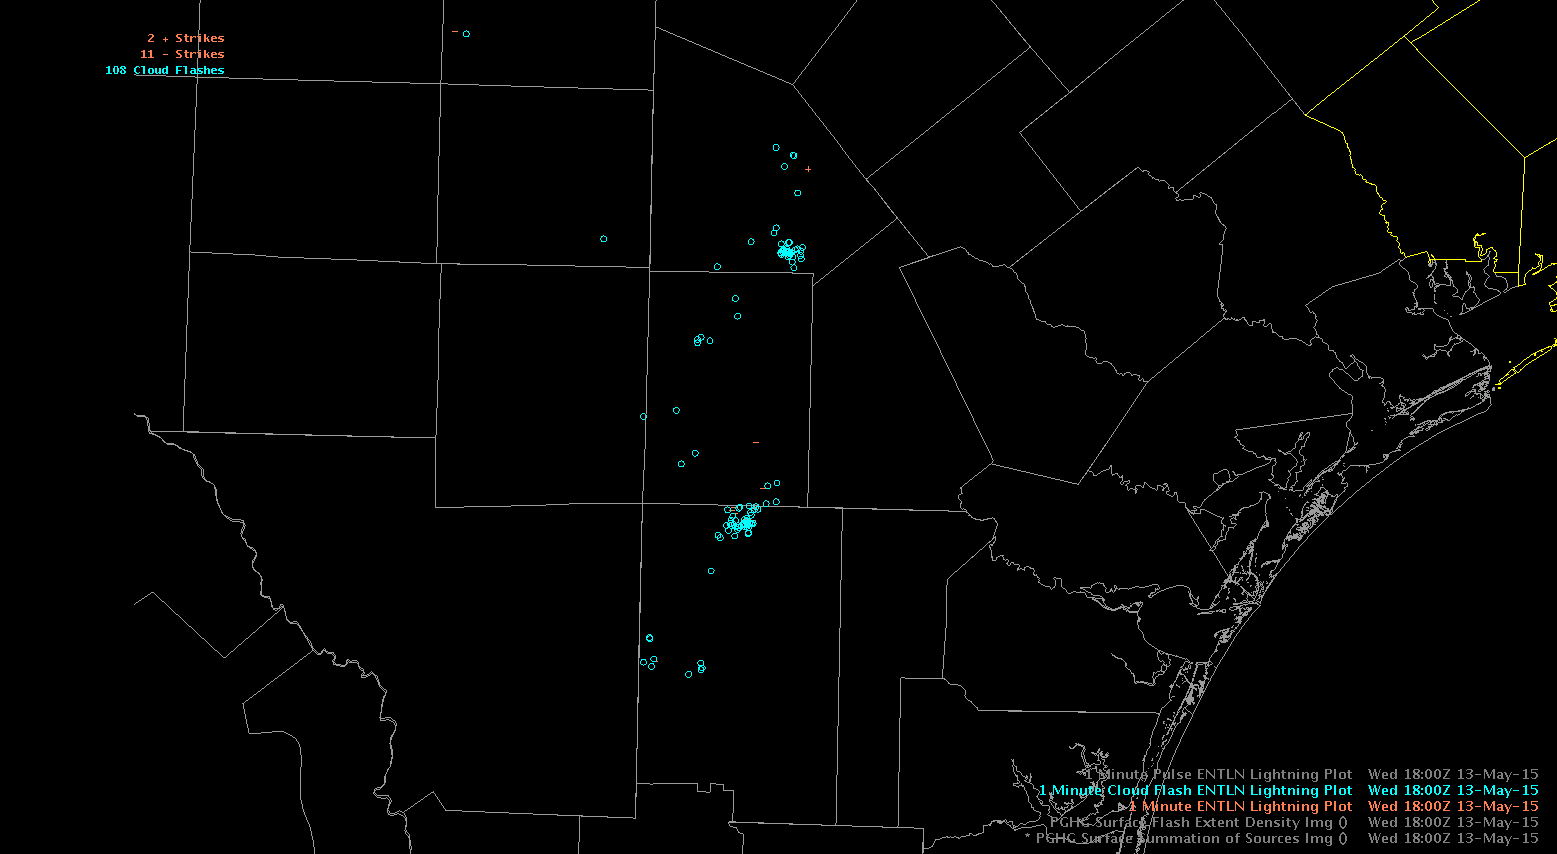
As a warning forecaster, trying to weigh a large total flash rate increase with the near-storm environment and radar data can be a challenge. The lightning trend jumped from about 30 flashes to around 120 in 15 mins (see trend box graphic with cyan arrow) for a line segment along a stationary front and CAPE gradient.  From a warning perspective, the jump in lightning increased my SA for that storm cluster and I awaited for signs of increase in the radar signals. However, knowing the storm was in a modest CAPE pool and on the frontal/CAPE gradient, I did not have the confidence to warn on the lightning jump alone. The jump began at 1930Z, as of 2025Z there have been no reports or further severe indications in the radar data.

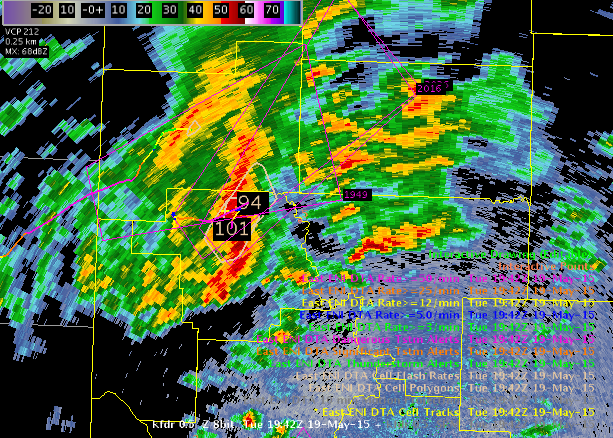
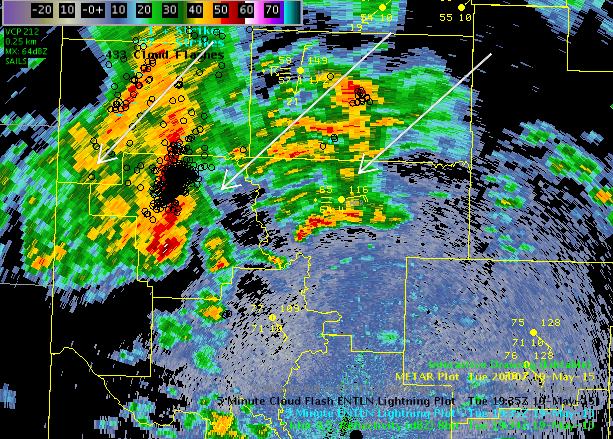
Display: I find the ENI Cell Polygon rate numeric plots (inside the black box) and polys most useful to draw me in, in concert with a trend box for the cell in another pane. I found myself looking beyond or over the alert polygons, not taking the information into my processing.

Data QC: The trend information box plots matched the plan view flash data well.

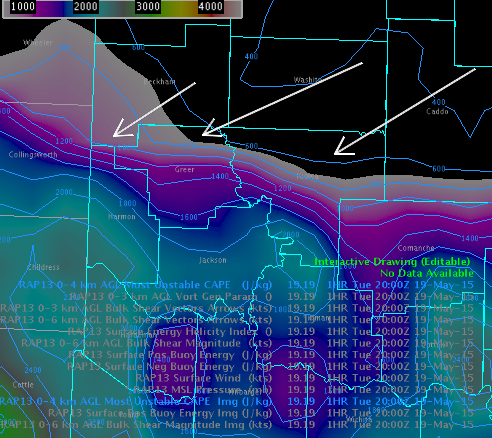
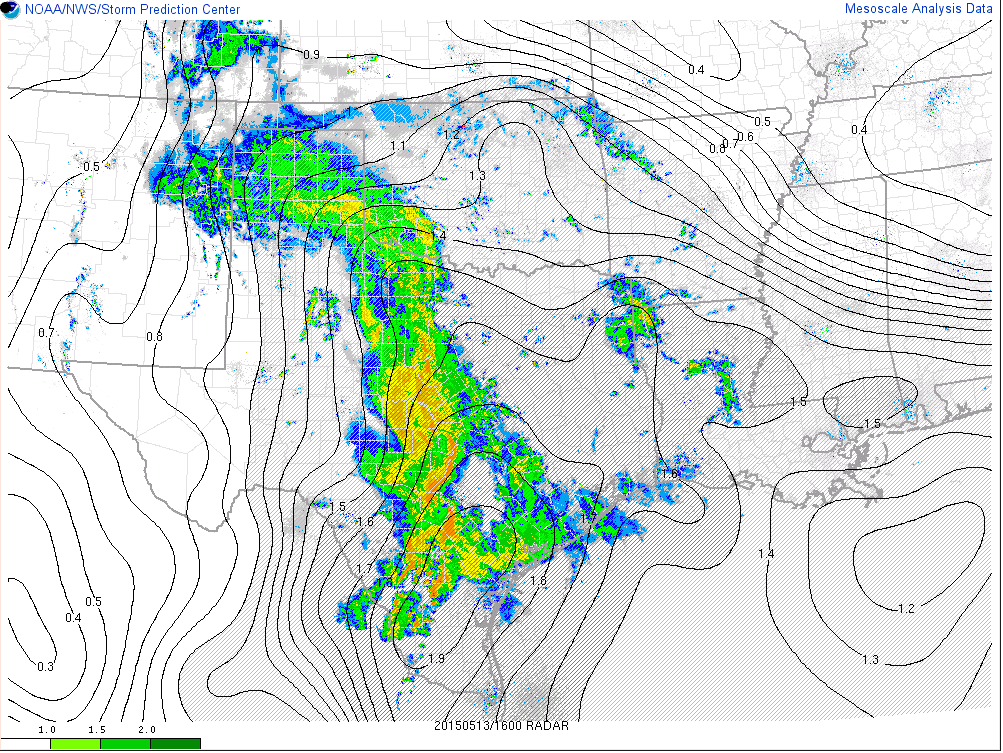
Images: Cyan arrow indicate the frontal boundary. The storm of interest was in northern Greer county.

capeGradientGreer CellFlashRates CellRateTrneds refl_ltg_plan

Tags: None

Splitting Lightning Cell Tracking

Here is an example with Earth Networks Cell Lightning Cell tracking where a single cell split into two.

In the image below, there is a single cell detected by the tracking algorithm:

beforesplit_croppedA few minutes later, the single cell splits into two:

aftersplit_croppedThe top right panel is the time series of lightning at point 1; the bottom right panel is the time series of lightning at point 2.

Note the lightning and area of point 1 decreases substantially around 2115 UTC. This is coincident with data coming into point 2. This shows the importance of taking into consideration the area when seeing trends in lightning. In this case, the decrease of lightning was because the cell at point 1 decreased in size and split into a second cell at point 2. This is why a time series began appearing for point 2 at the same time there was a decrease at point 1.

Polarimetric Researcher

Tags: None

Circle in a Circle with Lightning Cell Tracking

Here is an example with Earth Networks Cell Lightning Cell tracking where there was a circle within a circle:

doublecircle2In this example, point 1 is in the interior circle and point 2 is in the outside circle. Note that the time series are the exact same for both circles. This situation would be confusing to a warning forecaster.

Polarimetric Researcher

Tags: None

Missed CI

Cirrus clouds may have impacted the CI algorithm (click to animate):

CI_failureNote that the developing convection is evident on the visible satellite.

This convection is associated with >35 dBZ echoes (click to animate):

CI_Failure2There is a possibility that the infrared satellite may be weighted too heavily during the day time because it is clear on the visible data there was convective initiation.

Here is what the infrared satellite observed (click to animate):

CI_Figure3 Note the dense cirrus across the area, which likely impacted the CI algorithm.

Polarimetric Researcher

Tags: None

ProbSevere in Warning Decision Making…Part 2

Here is another example where ProbSevere rapidly increased form 18% to 94% (click image to animate):

ProbSevere2The normalized vertical growth rate and the glaciation rate were both strong. In this case, I was confident enough to use the ProbSevere by itself to issue a severe thunderstorm warning. I started drawing the warning polygon prior to the highest percentage coming from ProbSevere. In the end, my polygon was issued nearly coincident with the highest probabilities.

Polarimetric Researcher

Tags: None

ProbSevere in Warning Decision Making

Here is an example where ProbSevere increased from 20% to 97% within 18 minutes (2218 to 2240 UTC) (click image to animate):

ProbSevereWarningA three-body scatter signature (TBSS) developed at the end of this time frame, indicating the presence of hail aloft.

By 2248 UTC, MRMS indicated 65.5 dBZ at -20C:

MRMS_ProbSevereThis is another example where the rapidly increasing ProbSevere indicated an intensifying storm. A severe thunderstorm warning was issued for the storm.

Polarimetric Researcher

Tags: None

CI in a Different Environmental Conditions

Here is an example where the convective initiation algorithm performed poorly (click to animate):

CILOOPIn this example, both instability and shear were very weak:mucpeshr

In contrast, here is an example where the convective initiation algorithm performed well (click to animate):

CLILOOP2In this example, there was moderate instability, but shear was still weak:

mucp2 eshr2From these examples, it appears the convective initiation algorithm (which uses environmental parameters) doesn’t do as good a job in poor environmental conditions. The algorithm especially seems sensitive to instability.

Polarimetric Researcher

Tags: None

SPC Mesoanalysis vs. GOES-R LAP Algorithm Precipitable Water

Here is an example of precipitable water (PW) from the SPC Mesoanalysis and observed from the GOES-R LAP Algorithm:SPC_PWGOES_PW-1While there are slight discrepancies between the two data sets (and obvious noise in the GOES-R data), they are actually fairly similar with respect to trends and location of the highest PW values. The gradients of PW match very closely. This tool will be very useful to track increasing precipitable water.

Polarimetric Researcher

Tags: None

ENTLN Lightning vs. -20C Reflectivity

Here is an example of ENTLN Lightning Plot compared to -20C reflectivity from MRMS:

ENTLN_Lightning -20C_refThere appears to be nice correlation between lightning and reflectivity aloft (which makes physical sense). In this example, the highest concentration of lightning is associated with >40 dBZ at -20C. A ramp up in lightning could be indicative of larger reflectivity aloft, which would suggest an intensifying updraft.

Polarimetric Researcher

Tags: None

NUCAPS Soundings ahead of and behind CF

The NUCAPS soundings available in AWIPS-II are generated from the CrIS and ATMS instruments aboard the Suomi NPP polar-orbiting satellite. A swath of soundings are available over generally the same locations at roughly the same times each day. On Tuesday, the swath over the east coast with a timestamp of 1815Z was available in AWIPS-II around 1930Z. This is great timing, as it falls between the 12Z and 00Z RAOB launches, providing an update on the thermodynamic environment.

Today, one group was operating in the Sterling CWA where the threat for severe weather was quite low, but a cold front was quickly making its way through the region. The 1815Z NUCAPS pass was timely as participants were able to view atmospheric profiles on both sides of the front (Fig 1).

20150512_NUCAPS_points-DC_edit
Fig 1: NUCAPS sounding points with surface obs and visible satellite imagery overlayed. Centered over Sterling CWA.

Selecting a sounding ahead of the front, the surface conditions (temperature and DP) needed to be adjusted to match actual surface conditions (Fig. 2). Additionally, the bottom few points of the sounding were smoothed out to make a more realistic profile LL profile. Upon making these changes, instability was still present ahead of the front given decent MUCAPE and SBCAPE. However, MLCAPE was virtually nonexistent, and a possible inversion was apparent between 700 and 850 mb, perhaps the reason for a lack of robust convective activity.

20150512_NUCAPS_points-DC_east_1_crop
Fig 2: Modified NUCAPS sounding ahead of CF.

Selecting a profile behind the front and making the necessary changes to the lowest parts, one can certainly tell that the front had passed through the area (Fig 3). With significantly cooler and drier air aloft (in addition to at the surface) the atmosphere is now completely stable.

20150512_NUCAPS_points-DC_east_2_crop
Fig 3: Modified NUCAPS sounding behind CF

This was a good example of how a forecaster can use the timely NUCAPS soundings to identify the existence and locations of boundaries when they might not be so obvious from other guidance.

– Bill Line, SPC/HWT Satellite Liaison

Tags: None