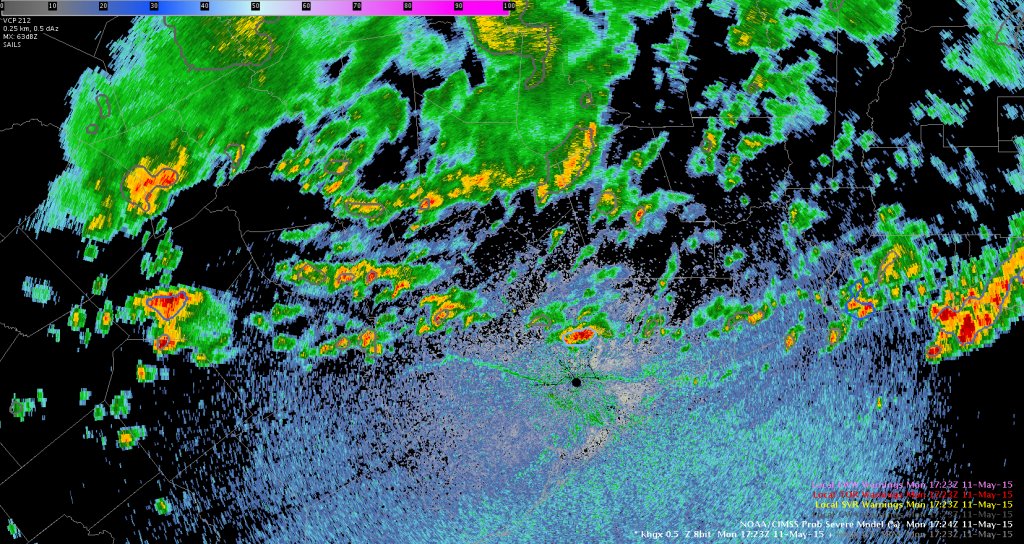
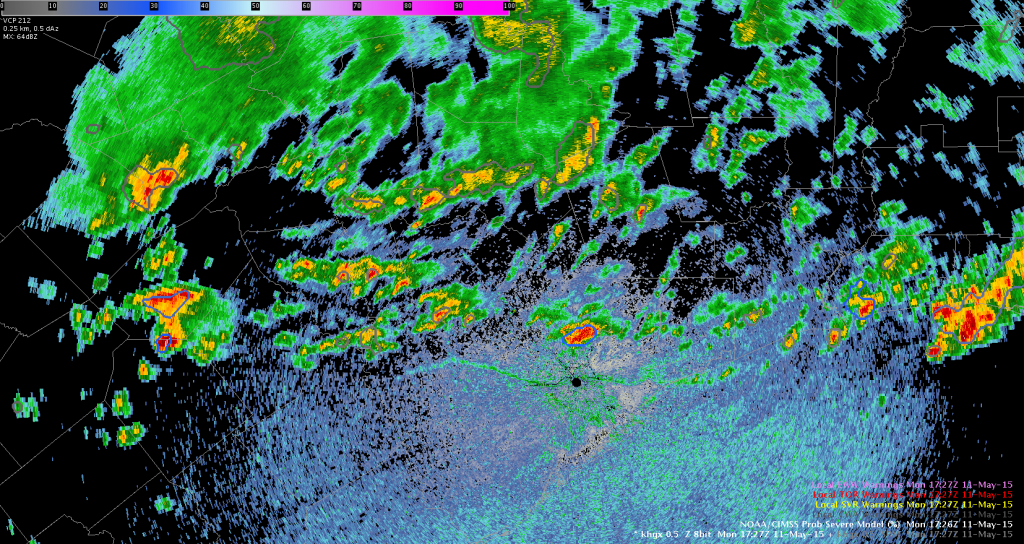
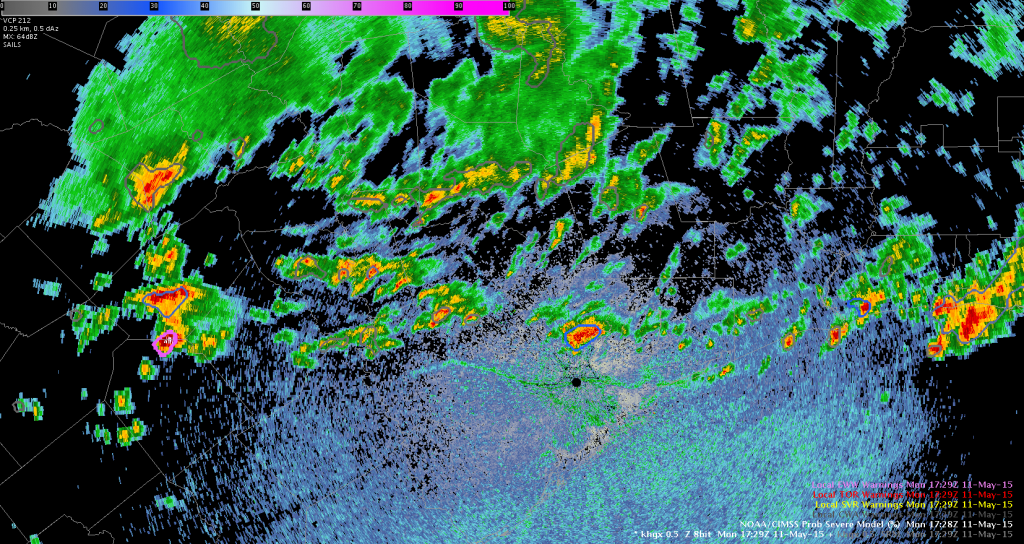
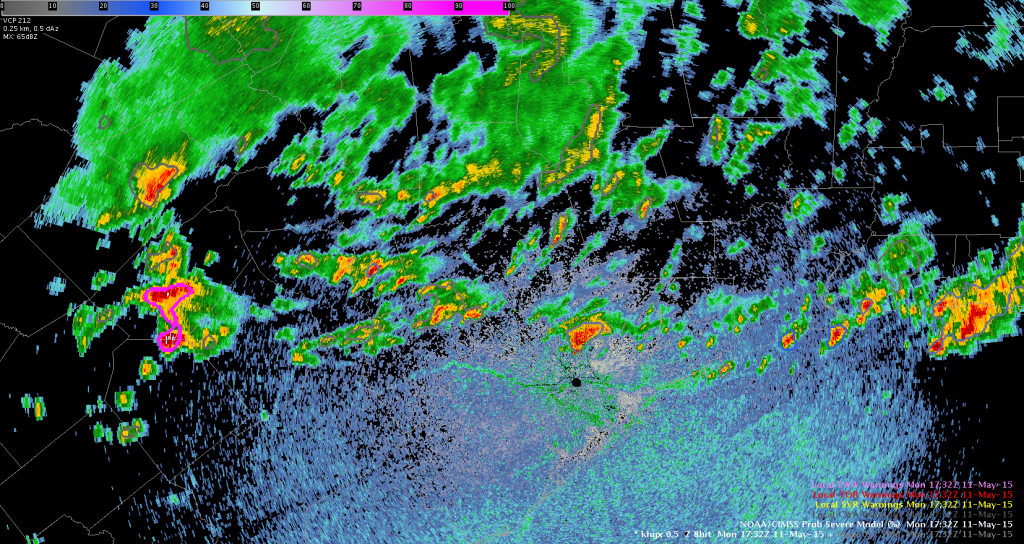
Prob Severe Model color map

The default color map for the Prob Severe (the blue/pink) is not useful or intuitive for a quick glance. I set off to find something more representative and clicked on one at random, the NCWF Convective Grid. The color bar is divided up into four colors: green (0-30%), yellow (30-60%), orange (60-80%) and red (80-100%), respectively as % probability increases.

I found this quite good for a quick glance to see which areas have the greatest potential for severe development. The “traffic light” color scheme is very intuitive for threat levels, so it works well for this product.

Note to self: when viewing the Prob Severe with a visible satellite image, time match to the Prob Severe since it updates more often.

~ Regina Phalange

Tags: None

Sterling, VA Initial Environment

Overall, a large area of high pressure dominates the central United States with a surface cold front draped across the Appalachian Mountains through Pennsylvania, West Virginia and eastern Kentucky and Tennessee. A small trough was also centered over Virginia  and North Carolina. A decent cu field accompanied the cold front with GOES CI values mostly 30% or less as of 1830Z.

All the CAPE was concentrated over eastern North Carolina, with values of 500 J/kg or less over Maryland and eastern Virginia. A fairly steep PW gradient cut through central Maryland with .75-1 inch in the northeast part of the state, up to just over 1.5 inches in the southeast portion.

Any storms that do form over the CWA will be in the next few hours as the cold front moves through , but likely not severe.

~ Regina Phalange

Tags: None

Consider Lightning for Special Marine Warnings?

Currently, lightning is not considered for special marine warnings. However, lightning on the open waters can be deadly to boaters.

Here is an example (from the Texas coastline) of  5 minute cloud-to-ground lightning from the ENI Total Lightning Grid density at 5 km resolution:

lightningWith the addition of this data set into AWIPS2, the special marine warning criteria could be modified to use the density of cloud-to-ground lighting.  In the end, this will better meet the National Weather Service’s mission to protect life and property with regard to marine interests.

Polarimetric Researcher

Tags: None

Observed Radiosonde Data/NUCAPS Comparison

A special 18Z radiosonde launch was done at Wilmington, Ohio. The special launch allows for direct comparison to a dervived NUCAPS sounding.

Here is the observed radiosonde data:

soundingHere is a NUCAPS sounding from nearby:

NUCAPS_1Note that the NUCAPS sounding is not representative, especially near the surface. The surface temperature is 77F and the dew point is 55F on the derived sounding. A nearby METAR close by the NUCAPS sounding was 85F/61F.

However, if the boundary layer temperature and dew point profile is modified using nearby METAR observations (85/61), the SBCAPE is more representative to the observed sounding (1761 vs. 1688 J/kg):

NUCAPS_2Therefore, it is critical to look at the near-surface temperature and dew point profile when using NUCAPS derived soundings.

Polarimetric Researcher

Tags: None

Best Practices for the use of the NOAA/CIMSS ProbSevere Model

The NOAA/CIMSS ProbSevere Model is an excellent tool for situational awareness–especially in situations with widespread convection. The tool essentially allows for a quick all-tilts view without looking at all the radar tilts because it integrates data from the entire radar volume (and assimilates other non-radar data as well). For example, overlaying the tool on the lowest radar elevation (e.g., 0.5 degrees), you can monitor trends and areas of interest by the rate of change of the probability of severe. Rapidly increasing probability of severe gives the warning forecaster insight that the storm is rapidly intensifying aloft. At this point, a forecaster can do further interrogation on the storm of interest.

Here’s an example where there is widespread convection in southeast Texas:

Probsevere-1 Probsevere-2 Probsevere-3Probsevere-4Note the probability of severe rapidly increases (10% to 86% in 8 minutes on one storm) across the western storms. This immediately signals to the warning forecaster that these storms need further interrogation and are the storms of interest.

Polarimetric Researcher

Tags: None

EWP Week 1 Summary (May 4-7, 2015)

During the first week of the 2015 EWP Spring Experiment, we had forecasters from the Newport, Columbia, Roanoke, Marquette, and San Diego WFO’s, as well as a broadcast meteorologist from KETV Omaha, NE participate in the Spring Warning Project. With most of the active weather confined to the Southern Plains throughout the week, our CWA’s of operations included: Topeka, Omaha, Wichita, Midland, Lubbock, Amarillo, Albuquerque, San Angelo, Norman and Hastings. We had a good mix of marginal and very busy severe weather days, with Wednesday being the most active weather day as severe weather broke out across central Oklahoma.

Participants were able to use all of the demonstration products this week, which included GOES-R and ENI total lightning products. There were many good blog posts written throughout the week highlighting the use of all of these products in various forecast/nowcast/warning situations. Below is some end-of-the-week feedback on each product from this weeks participants:

PGLM

– It was useful yesterday in the Lubbock CWA.
– I have a marine responsibility in my CWA, so the lightning data would be useful for issuing sub-severe forecast products for storms moving towards the coast.
– This lightning information would be useful in my CWA on days when the fire danger is heightened.

Lightning Jump

– I was not so sure if a 1 or 2 sigma jump was significant, or if I should wait for a 5 or 6 jump.
– At one point when things were active, I was ignoring the 1 sigma jumps. The 4 and 5 sigma jumps really drew my attention.
– 3-sigma was when I really started paying attention to the storm.
– 1-sigma is probably not even worth a color, I made it transparent.

ProbSevere

– It did a good job with discrete cells, but when the mode became more linear, it suffered
– It really drew my attentions to the storms that I should interrogate further
– For me, MESH in the readout does not need to read to hundredths of an inch.
– Color/highlight values in the text display as they become more significant. Make the actual probability stand out more too.
– For the color contour, I made it neon on the higher end, and got rid of the lower end. The low end looked almost the same as the higher end.

CI

– Overall it did a pretty good job throughout the week of highlighting where CI would occur
– It really works best in a clear environment (no cirrus contamination)
– When you had a cu field developing, it did a nice job of depicting where stuff would go
– I liked using it when we had a lot of boundaries, it did a good job of depicting where along the boundaries stuff would go. Especially today when there were a lot of different boundaries in play, it gave me confidence where convection would develop and where I should look.
– Having a higher threshold for CI would be more relevant in WFO operations, and less messy
– With the colortable, the lowest probs (deep blues) stood out the most, which is not what you want to see. The higher end colors against the light background were more difficult to see. Reduce the appearance of the lower probs make the higher probs stand out more.
– Perhaps you could start out with white to light gray at the low end, and transition to colors at the higher end.

GOES-R LAP
– I use the GOES PW field the most
– I would like to know what data are from the retrievals and what are from the GFS.
– The pixelation in certain areas was an issue, with sharp, unnatural transitions present between adjacent values.

NUCAPS

– It might be a good idea to merge this product with something like LAPS to improve the lower levels.
– I want to set this up as soon as I return to my office.
– I can see myself using this a lot in the winter.
– I esepcially like the observation-based nature of it
– I would like to look at this over Lake Superiror
– Anything that gives us a temperature profile will be helpful, especially in the winter.
– In San Diego, it will benefit us during the summer monsoon. Also, the San Diego RAOB is not representative of the mountains in our CWA
– QC flags would give me more confidence in the soundings, as it is difficult to judge with just the cloud data.
– The RAOBS in my area are not representative of most of my counties, so I often use forecast soundings.

– Bill Line, Week 1 EWP Coordinator and SPC/HWT Satellite Liaison


Tags: None

Daily Summary: Week 1, Day 4

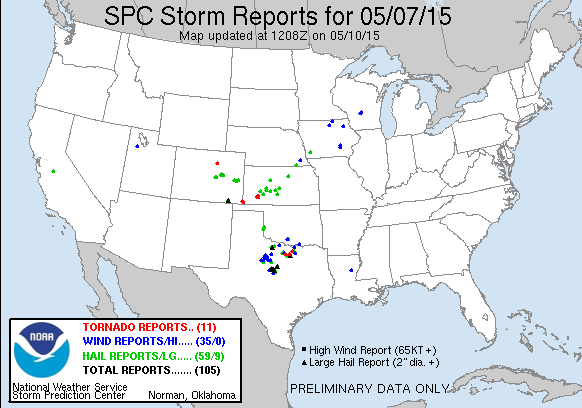
Today’s operations were in the Norman, Amarillo and Lubbock CWA’s. Compared to yesterday, it was a much quieter day, and convection took a little longer to get going. This allowed forecasters more opportunity to evaluate environmental analysis tools such as the GOES-R LAP algorithm and JPSS NUCAPS soundings. The GOES-R CI algorithm was also utilized by participants in the pre-convective environment. The Lubbock pair had the opportunity to evaluate the PGLM total lightning, especially late in the day when convective activity amped up in intensity and coverage. With the Frederick, OK radar down for most of the day, the Norman group had increased reliance on the Earth Networks lightning tools.

Tomorrow we will have our weekly debrief, and participants will complete their end of the week surveys and present the Tales from the Testbed webinar.

150507_rpts

– Bill Line, SPC/HWT Satellite Liaison and Week 1 EWP Coordinator
Tags: None

Daily Summary: Week 1, Day 3

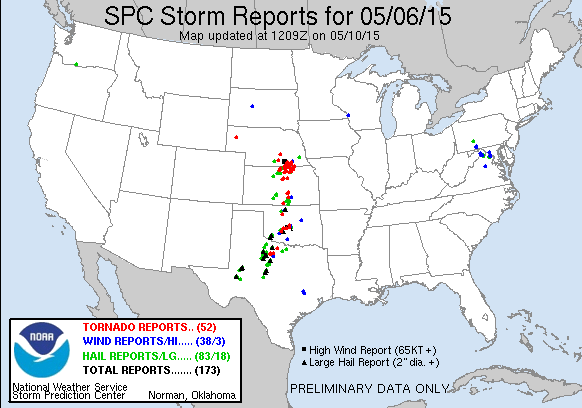
Convective activity began today earlier than was expected across the southern Great Plains. We placed groups in CWA’s where the greatest severe threat was expected for the day: Norman, Wichita, and Hastings. As convection was already ongoing when we began operations, attention was focused on warning activities from the start, with the Earth Networks lightning products, Lightning Jump, and ProbSevere Model having a lot of utility.

Tomorrow, we will start activities at 12:00 pm in the Dev Lab for the daily debrief before moving to the HWT for the EFP briefing. Activities will likely shift back to West Texas.

150506_rpts

– Bill Line, SPC/HWT Satellite Liaison and Week 1 EWP Coordinator

Tags: None

Daily Summary: Week 1, Day 2

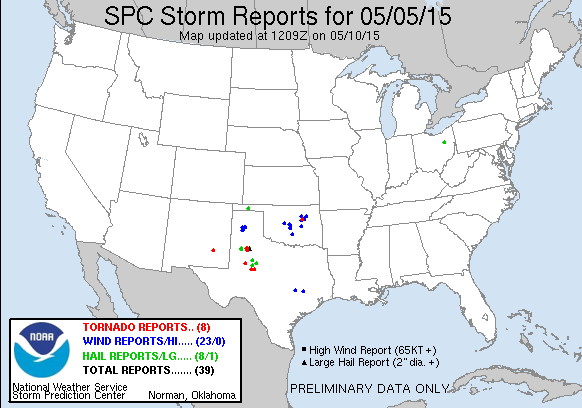
Today we had groups operating in  the Lubbock, Amarillo and Albuquerque CWA’s, where the most active weather was expected to occur. The Lubbock crew had the opportunity to evaluate the PGLM total lightning products which utilizes total lightning information from Lightning Mapping Array’s, one of which is centralized in the Lubbock area. The Albuquerque pair moved to San Angelo as convection advanced eastward through the late afternoon hours. The special, 18z Amarillo sounding provided participants with an opportunity to compare raob data with nearby NUCAPS soundings, which are available over the central US every day at ~19Z.

Tomorrow, we will start activities at 1:30 in the Dev Lab for the daily debrief before moving to the HWT to immediately begin operations. It looks to be an active severe weather day from Texas to Nebraska.

150505_rpts

– Bill Line, SPC/HWT Satellite Liaison and Week 1 EWP Coordinator

Tags: None

Lightning Jump and Flash Density…then a Tornadic Supercell Develops

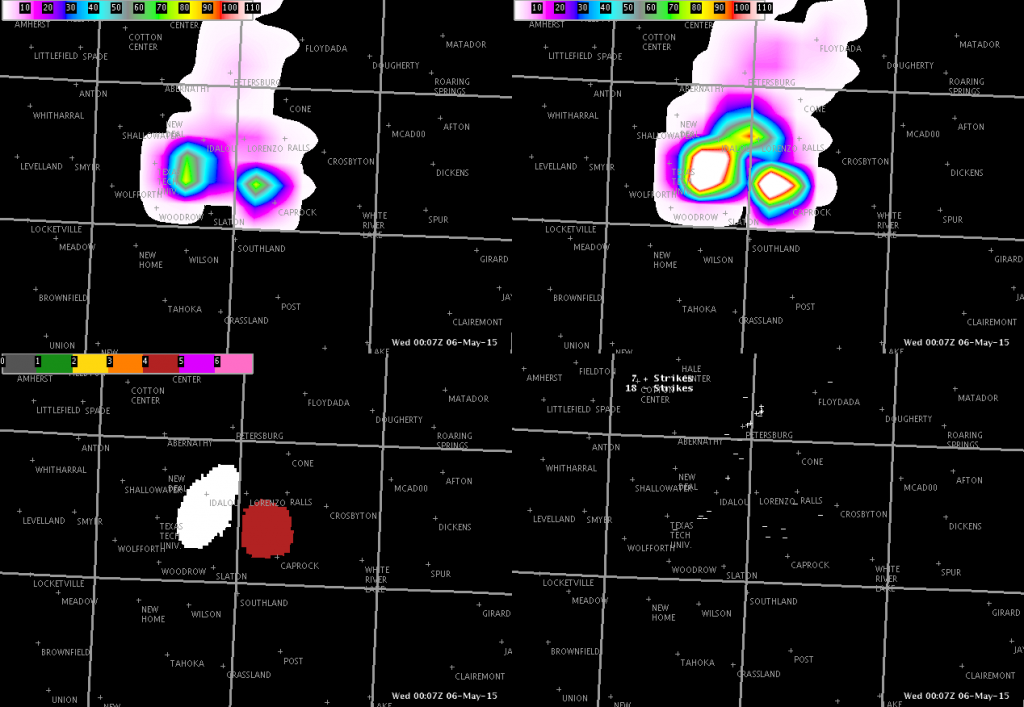
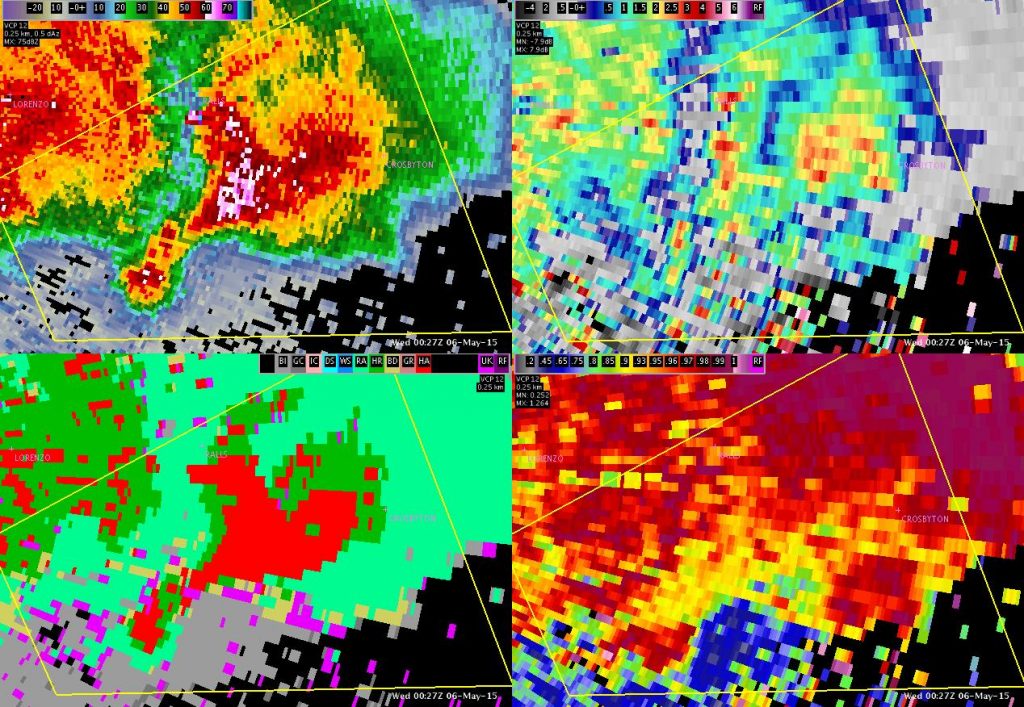
At 2353 UTC, a developing thunderstorm was seen on radar southeast of Lubbock.  At 0007 UTC, lightning jump data increased to 4 sigma.  At this same time, flash density increased to 70-80 flashes.  A warning was issued at 0011 UTC, based off the lightning data and radar data (50 dBz core at 33000 ft per MAF and low Zdr values per LUB).  ProbSevere increased to 87% at 0007 UTC also, and remained above 84%.  The storm took on a classic supercell structure and later produced a tornado.

LBBlightning LBBtornadopng

Tags: None