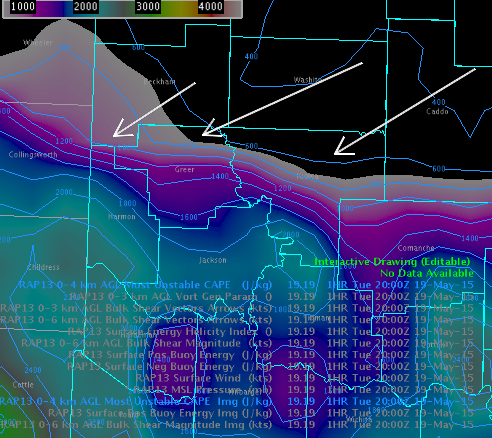
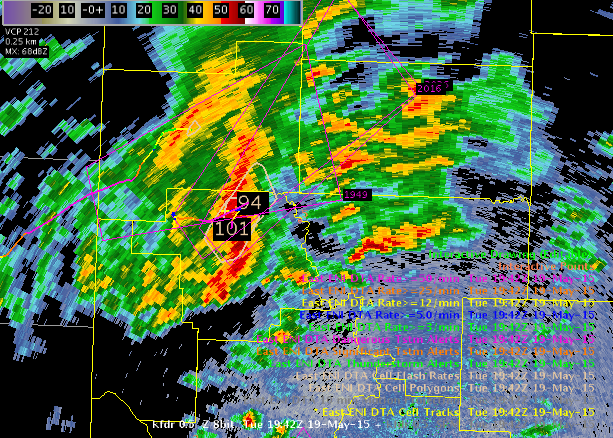
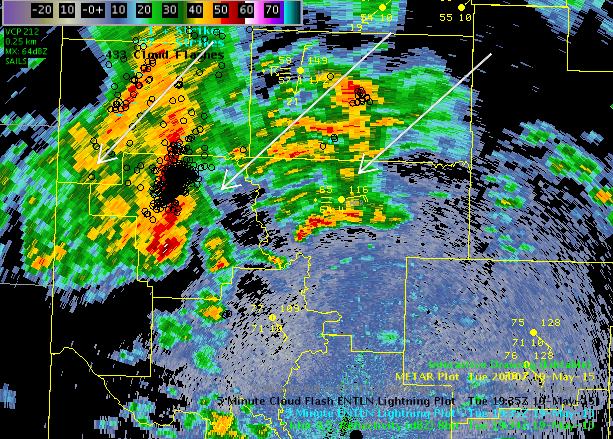
As a warning forecaster, trying to weigh a large total flash rate increase with the near-storm environment and radar data can be a challenge. The lightning trend jumped from about 30 flashes to around 120 in 15 mins (see trend box graphic with cyan arrow) for a line segment along a stationary front and CAPE gradient. From a warning perspective, the jump in lightning increased my SA for that storm cluster and I awaited for signs of increase in the radar signals. However, knowing the storm was in a modest CAPE pool and on the frontal/CAPE gradient, I did not have the confidence to warn on the lightning jump alone. The jump began at 1930Z, as of 2025Z there have been no reports or further severe indications in the radar data.
Display: I find the ENI Cell Polygon rate numeric plots (inside the black box) and polys most useful to draw me in, in concert with a trend box for the cell in another pane. I found myself looking beyond or over the alert polygons, not taking the information into my processing.
Data QC: The trend information box plots matched the plan view flash data well.
Images: Cyan arrow indicate the frontal boundary. The storm of interest was in northern Greer county.


