An official website of the United States government
Here’s how you know
Official websites use .gov A
.gov website belongs to an official government
organization in the United States.
Secure .gov websites use HTTPS A
lock (
) or https:// means you’ve safely connected to
the .gov website. Share sensitive information only on official,
secure websites.
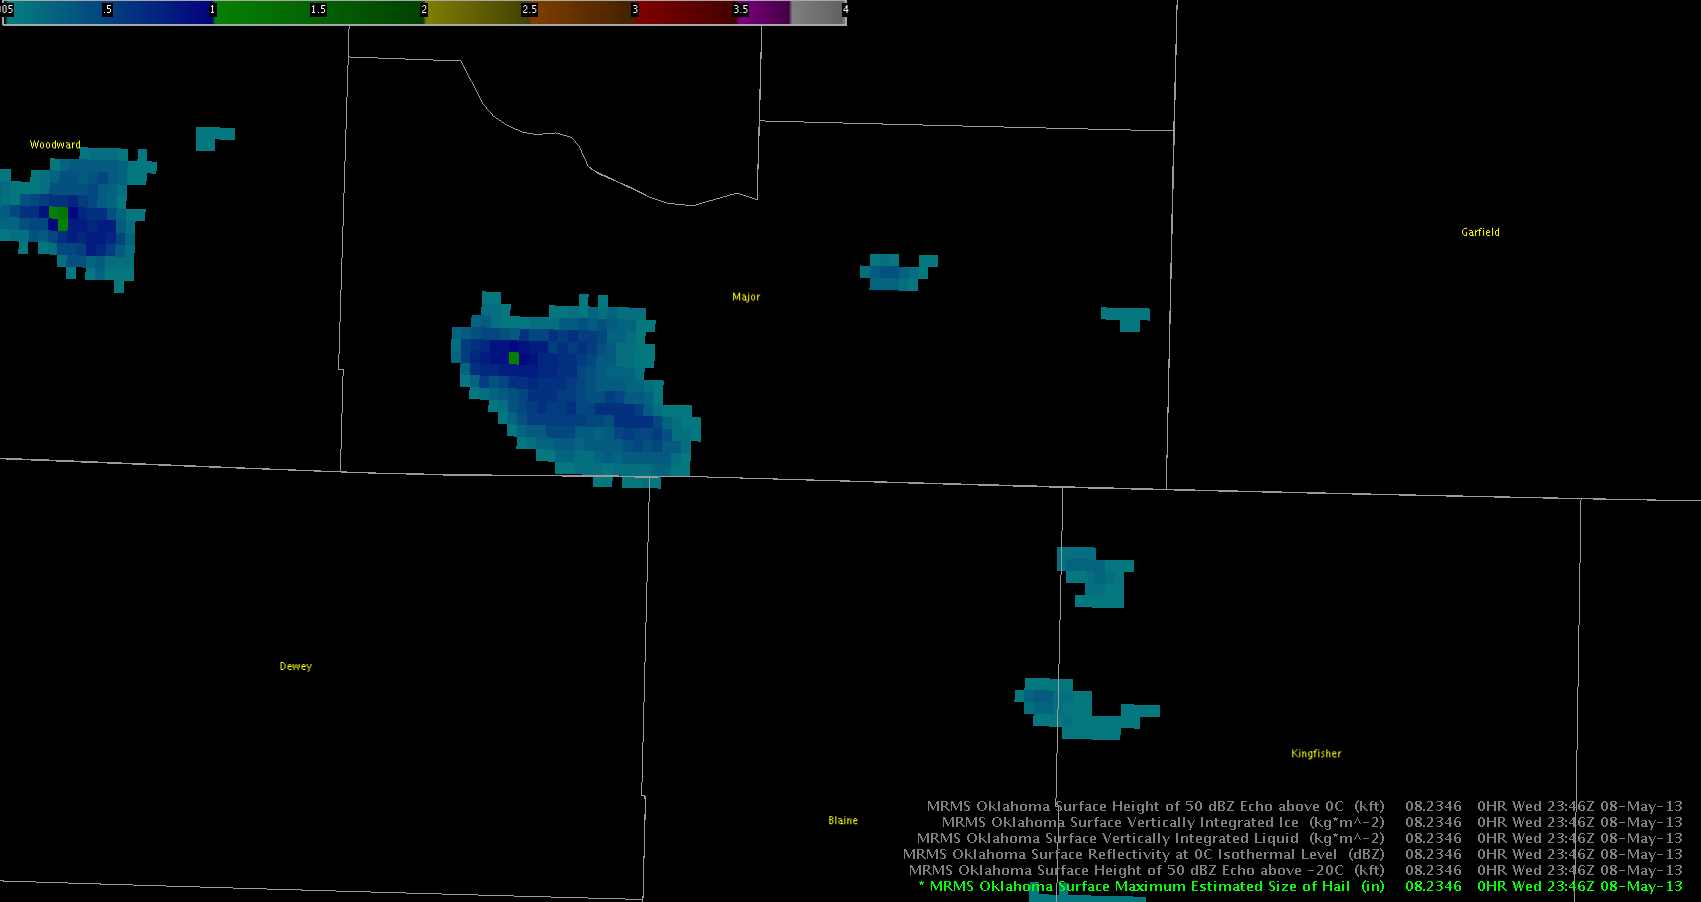
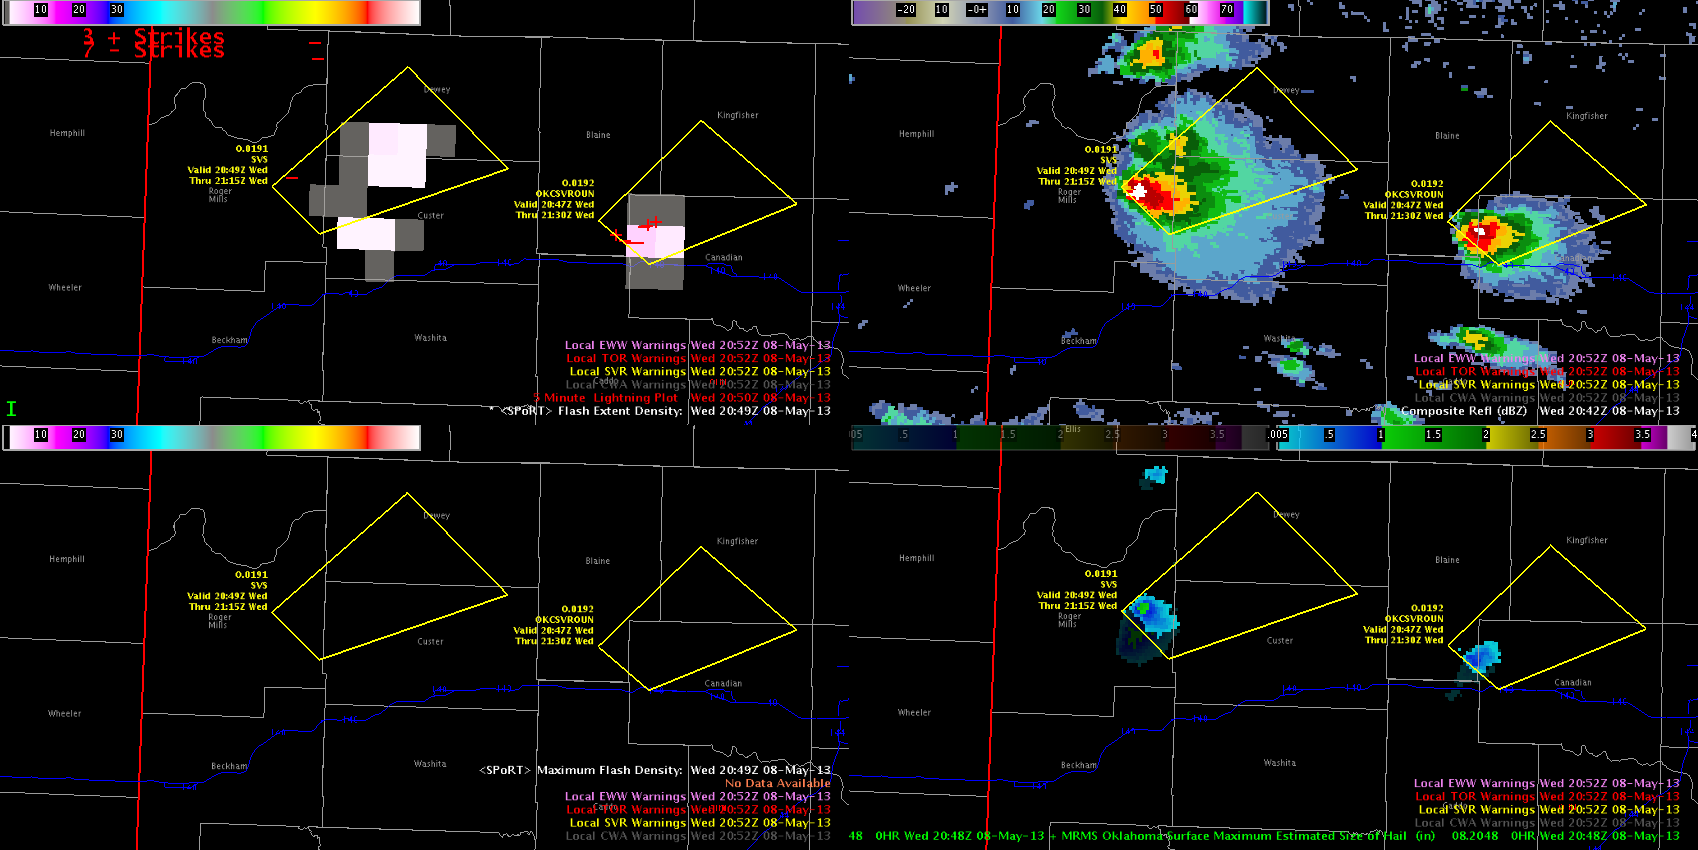
A storm producing reported 2.75 inch hail was estimated by the MRMS MESH product to be dropping only 1 inch hail. This storm was moving right as it continued to develop.
MESH product underestimating hail size by 1.75 inches this evening.
The HSDA algorithm did a good job of keeping a large to giant hail tag on this storm as it became severe and maintained its intensity.
HSDA algorithm diagnosing large to giant size hail for a storm reporting 2.75 inch hail.
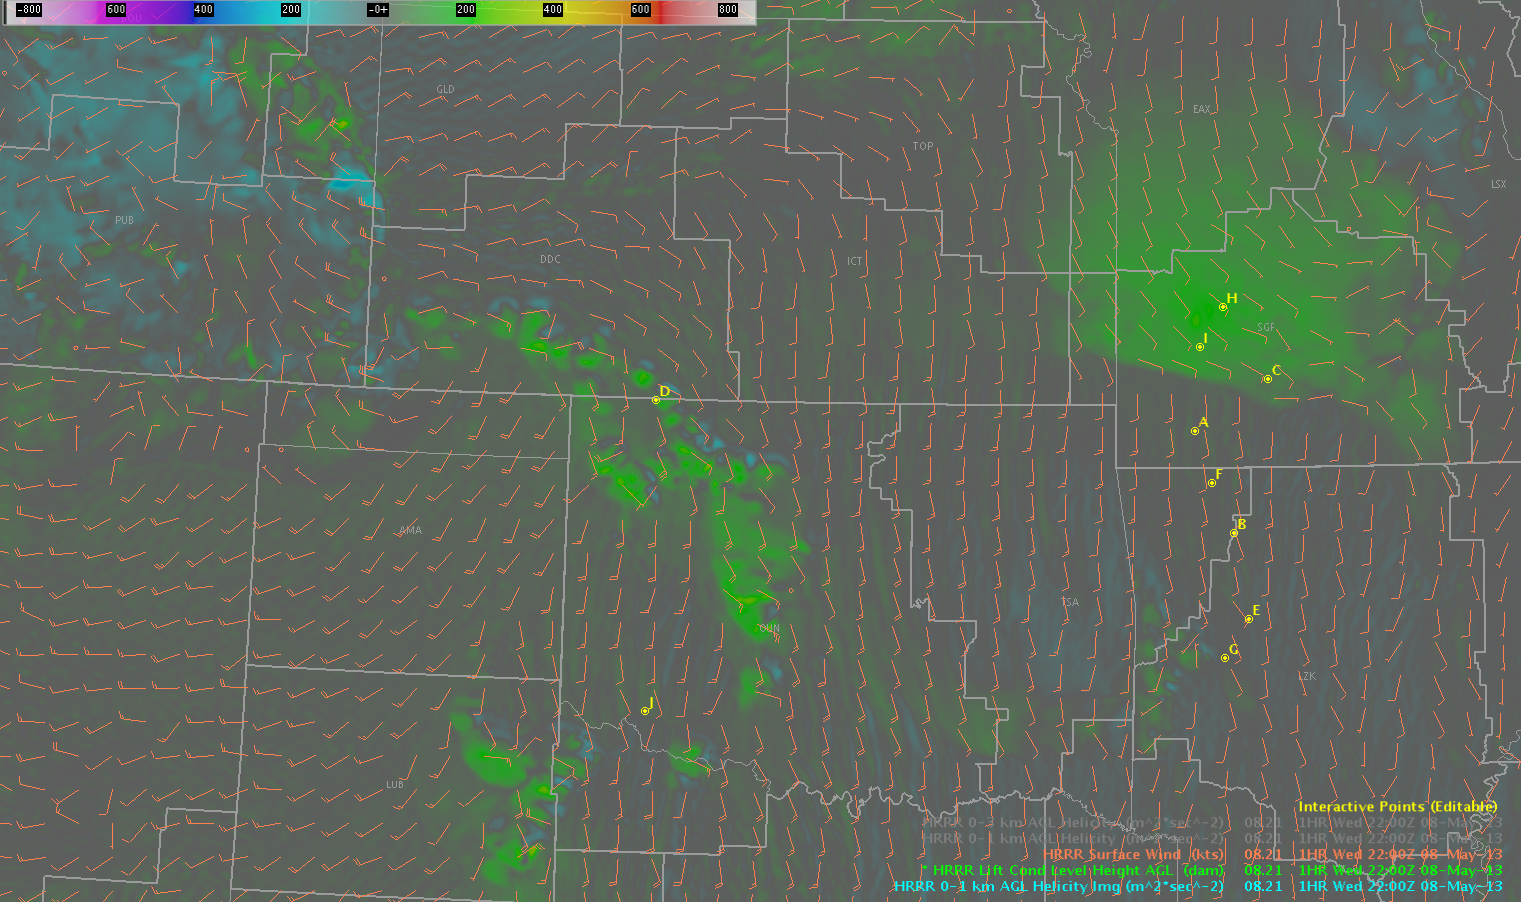
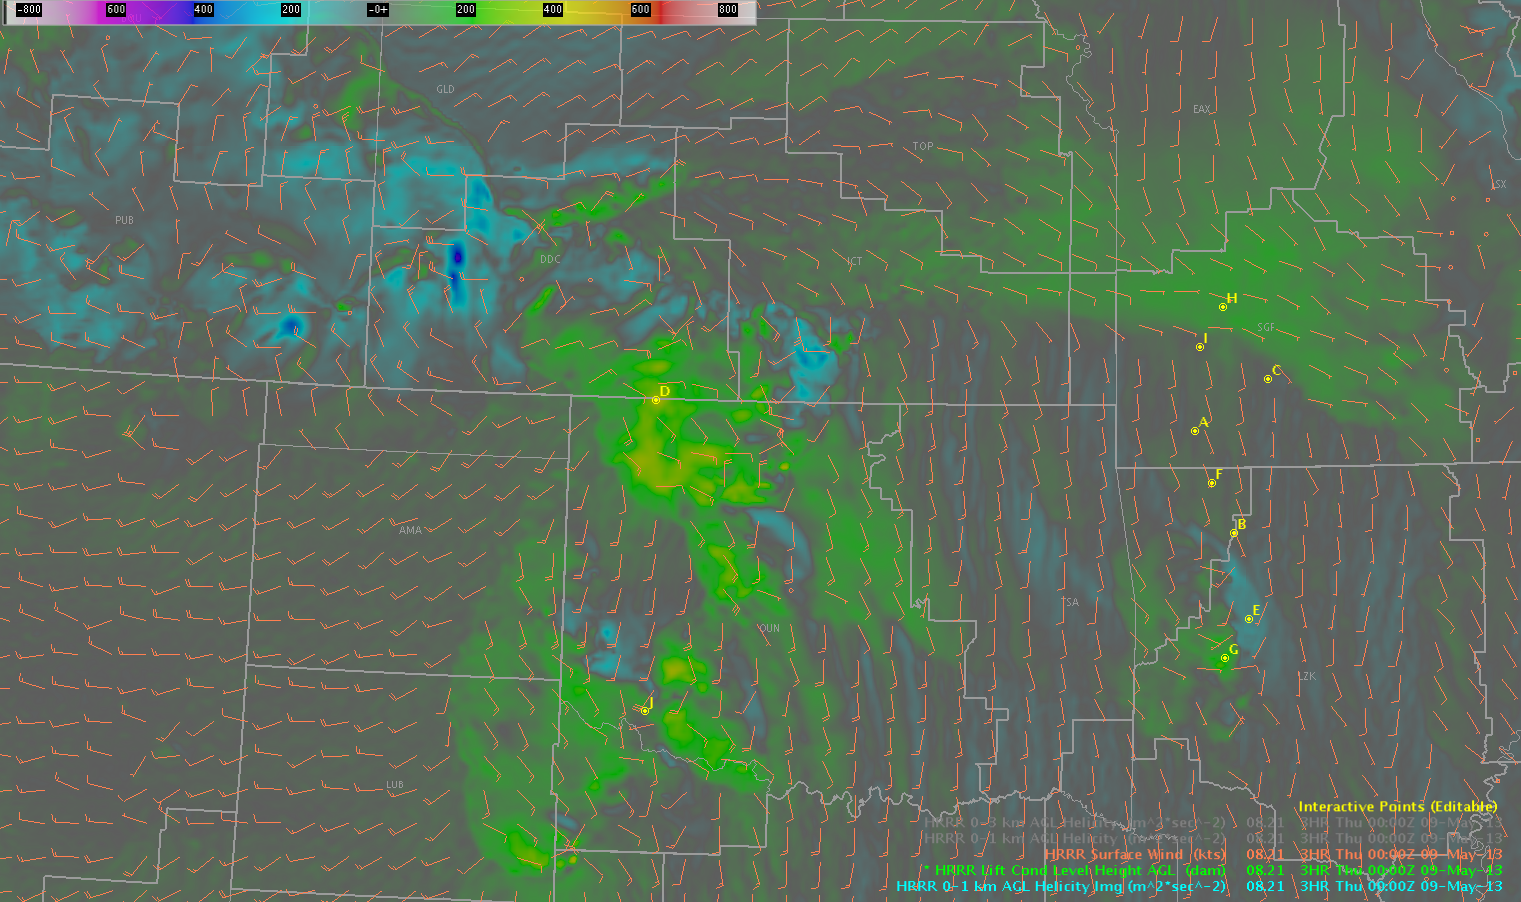
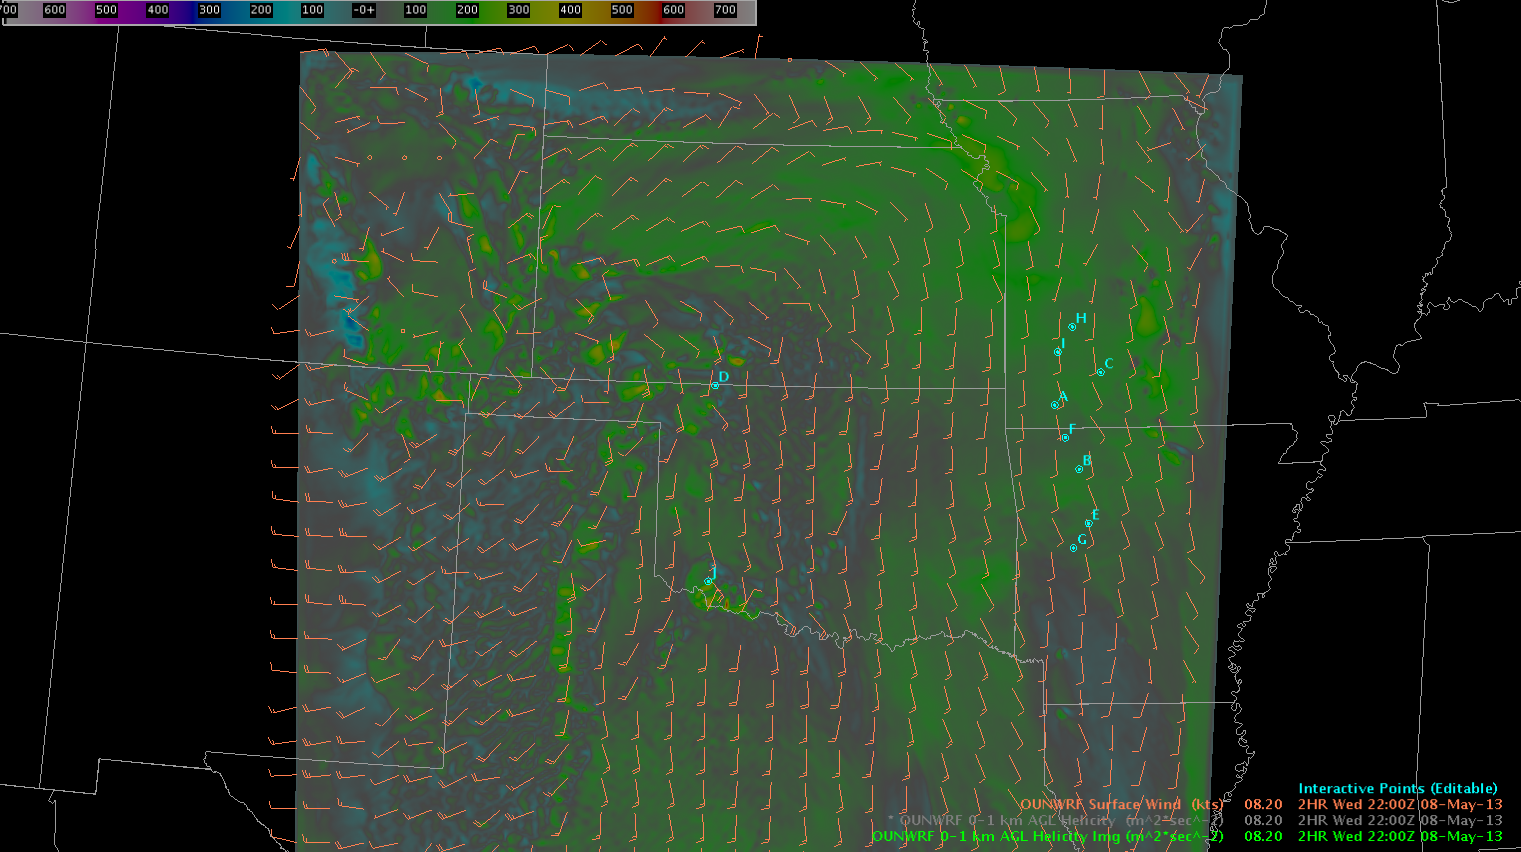
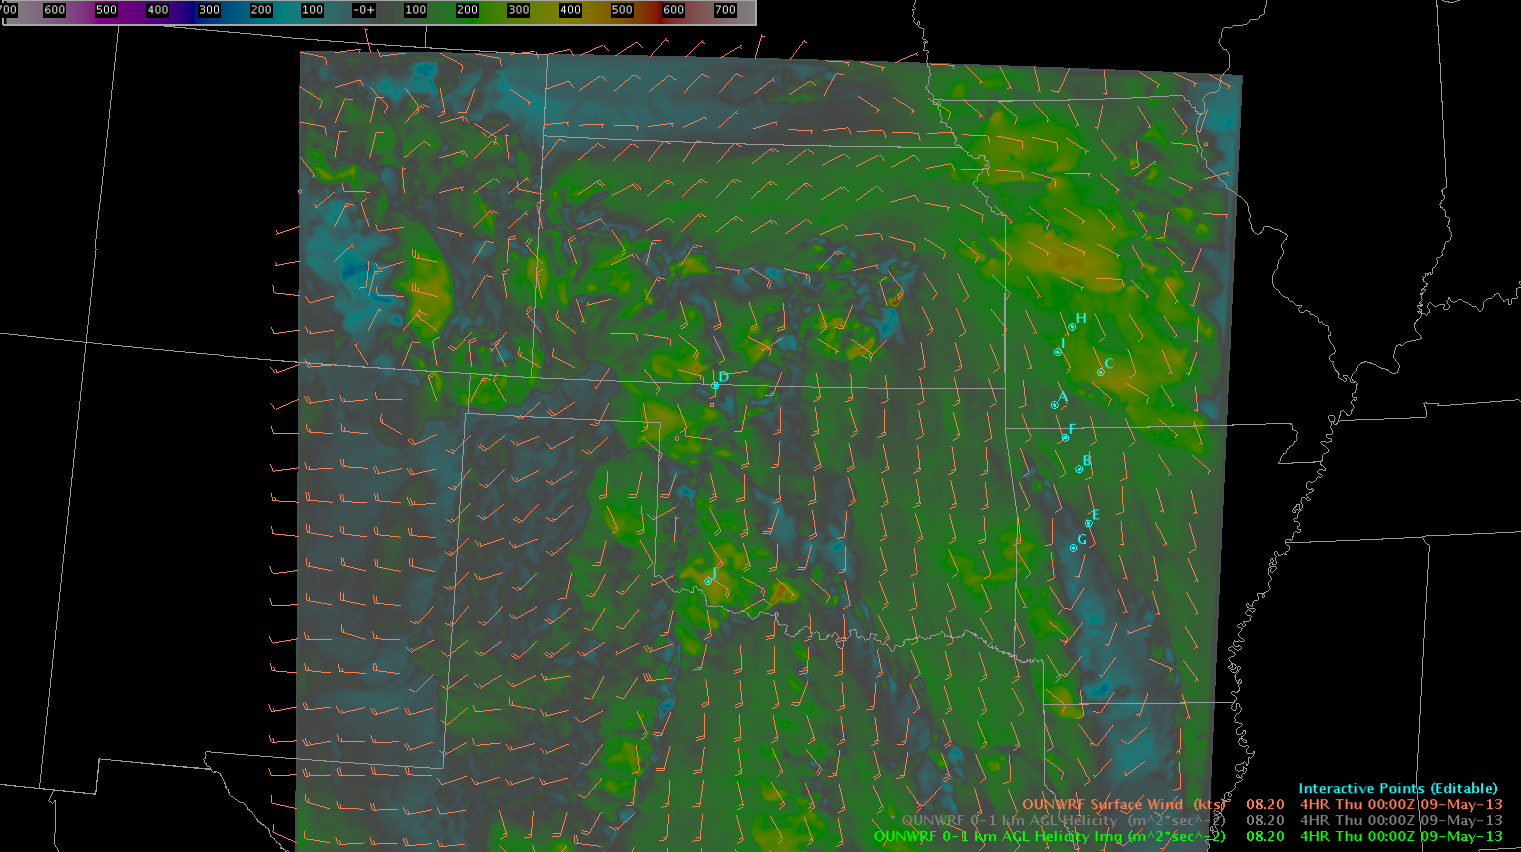
Winds are backing in two sections of the area that we are concerned about today. Both the OUNWRF and HRRR data indicate that 0-1km helicity is continuing to increase in two locations.
HRRR 0-1km SRH at 2200Z.HRRR 0-1km SRH at 0000Z.OUNWRF 0-1km SRH at 2200Z.OUNWRF 0-1km SRH at 0000Z.
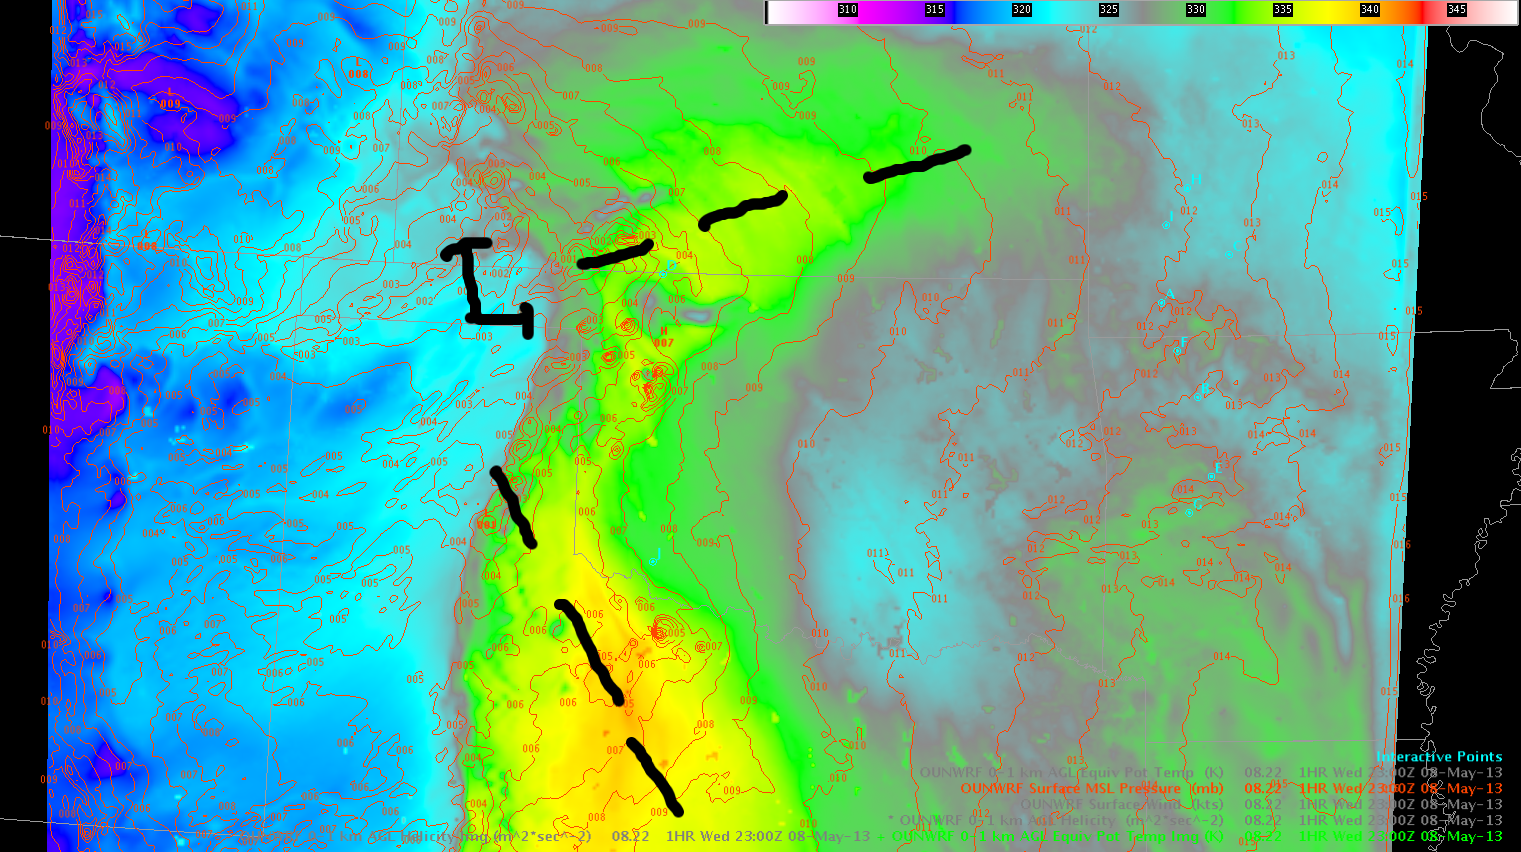
Near points D (OK/KS border) and J (OK/TX border), winds are backing at the surface. Looking at an OUNWRF MSLP, the front over southern Kansas is evident (as well as a change in air mass, as indicated by theta-e). Ahead of the dryline, there is another trough that digs south-southeast into Texas, with winds backing well ahead of the dryline.
OUNWRF Theta-e and surface MSLP at 2300Z.
RAP/HRRR/OUNWRF data indicates that LCL values will decrease with time over the next few hours. However, dewpoint depressions on surface obs remain quite large in both of these focused locations (about 20F in SW Oklahoma, and about 10-15 degrees ahead of the storms in southern Kansas).
We do not currently have the 1km LAPS forecast data available in AWIPS. However, what we are seeing on the internet appears to show that the line of supercells moving into the SW OUN CWA will continue to strengthen. This will be as it moves into the southern area highlighted above — perhaps an area that will be potentially favorable for a bit of an enhanced tornado threat.
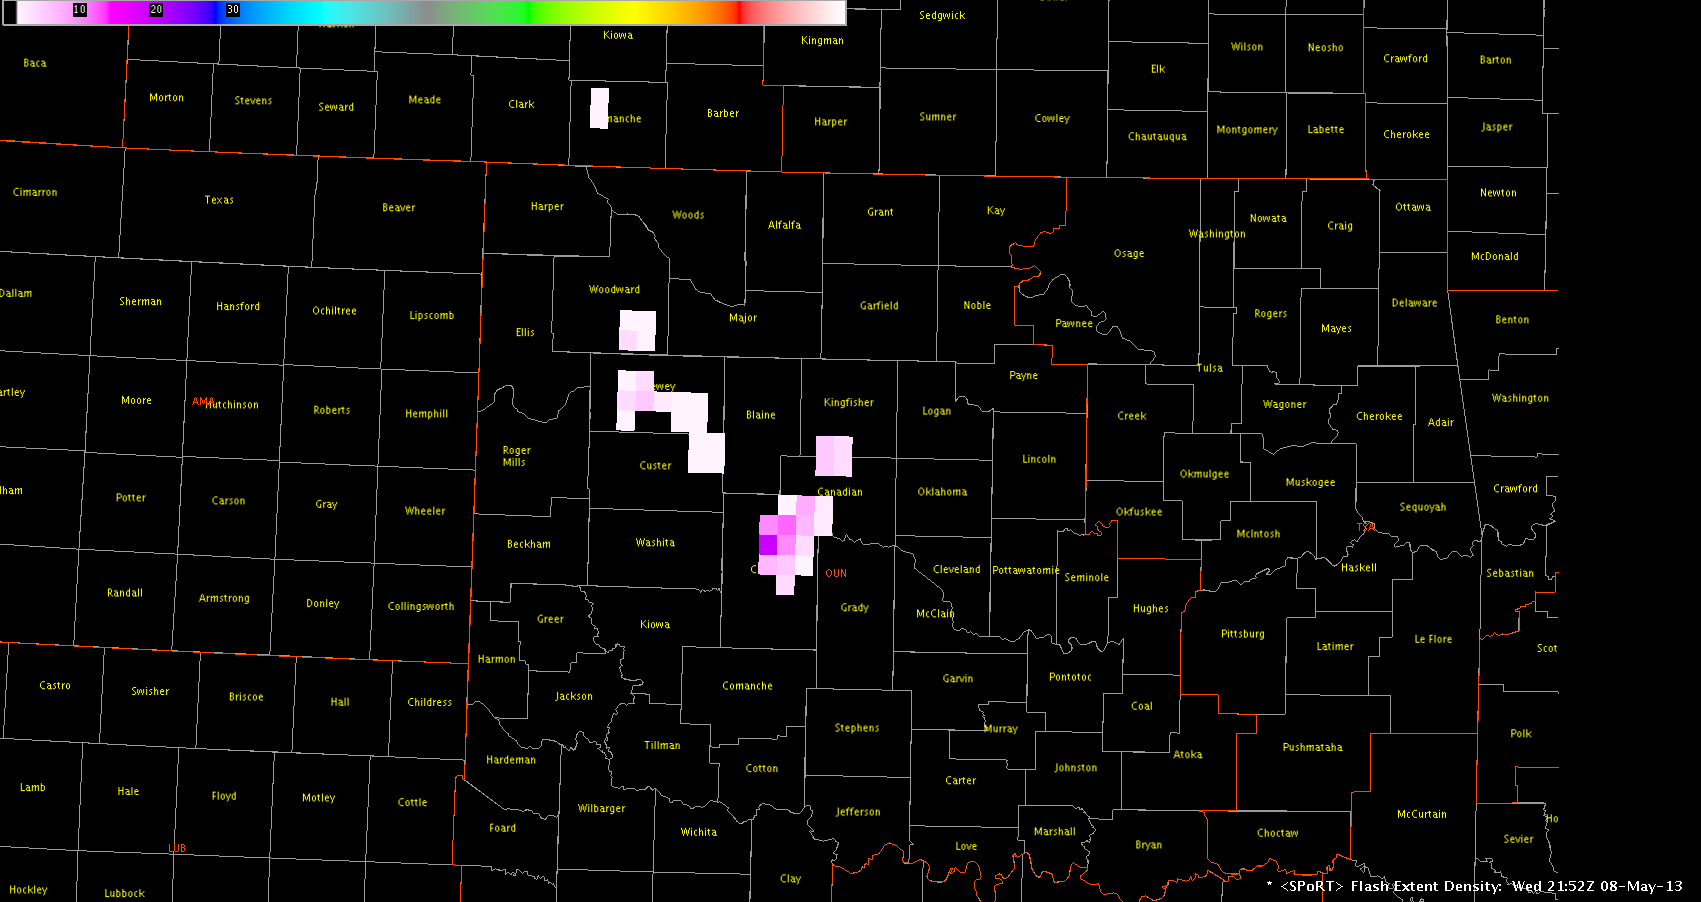
A rapid ramp up in total lightning data led to increased lead time for a Severe Thunderstorm Warning this afternoon. The Flash Extent Density product increased to 19 flashes per minute prior to warning issuance.
Flash Extent Density product showing an increase to 19 flashes per minute prior to warning issuance.
Flash Extent Density further increased following the warning as severe hail was reported.
Flash Extent Density product increased to 32 flashes per minute as severe hail was reported.
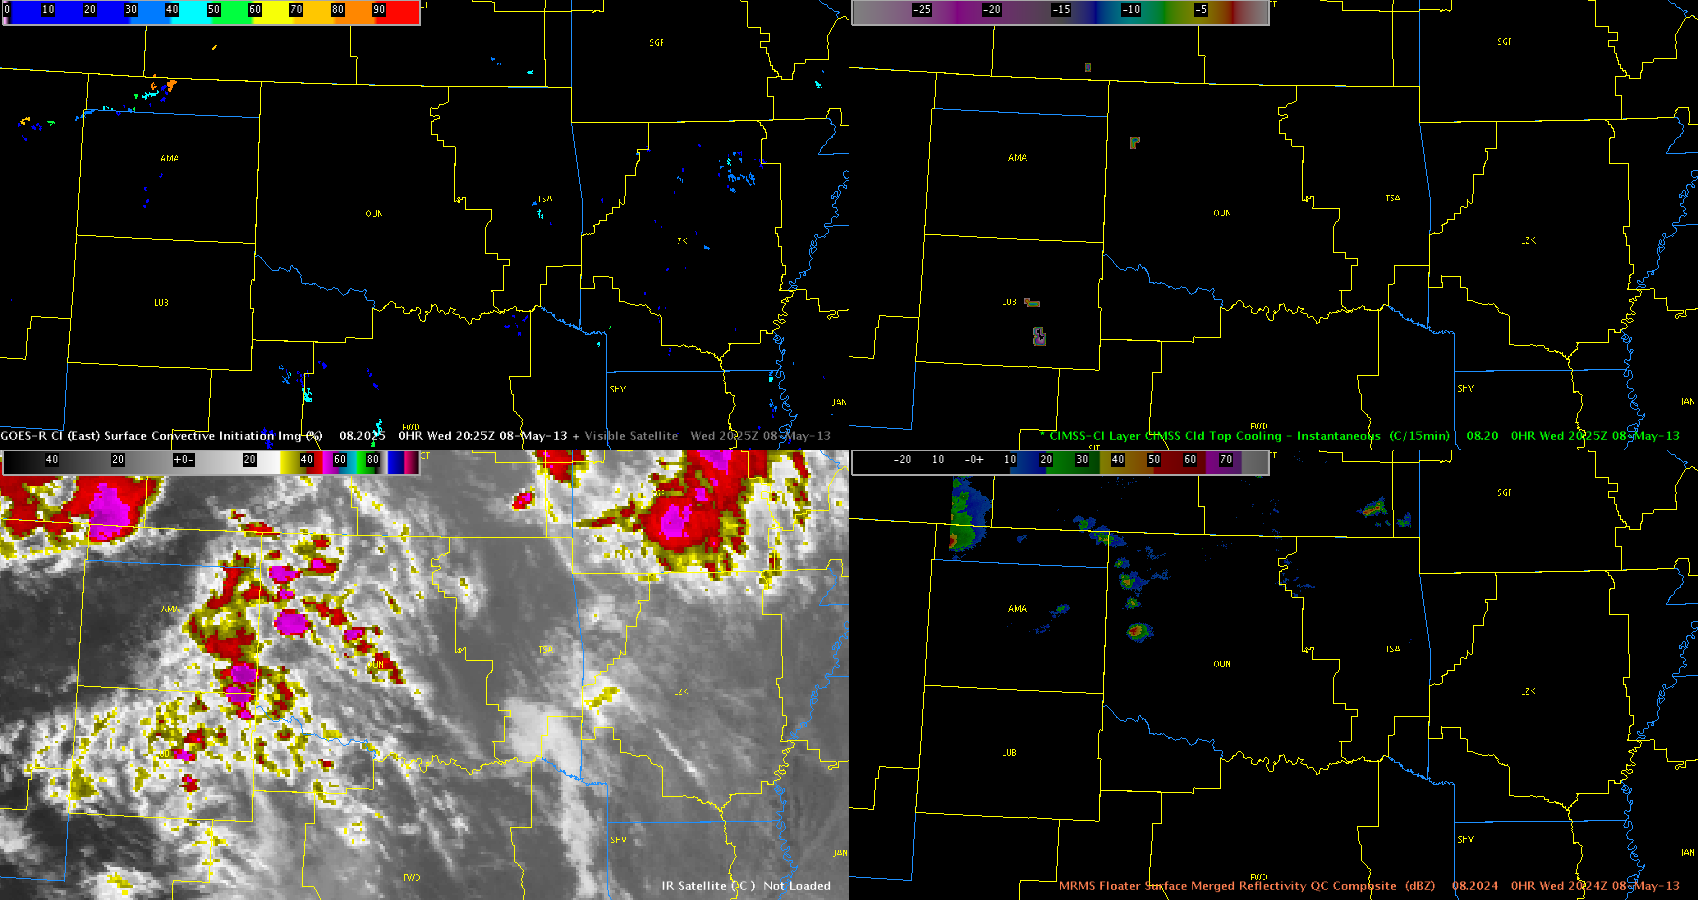
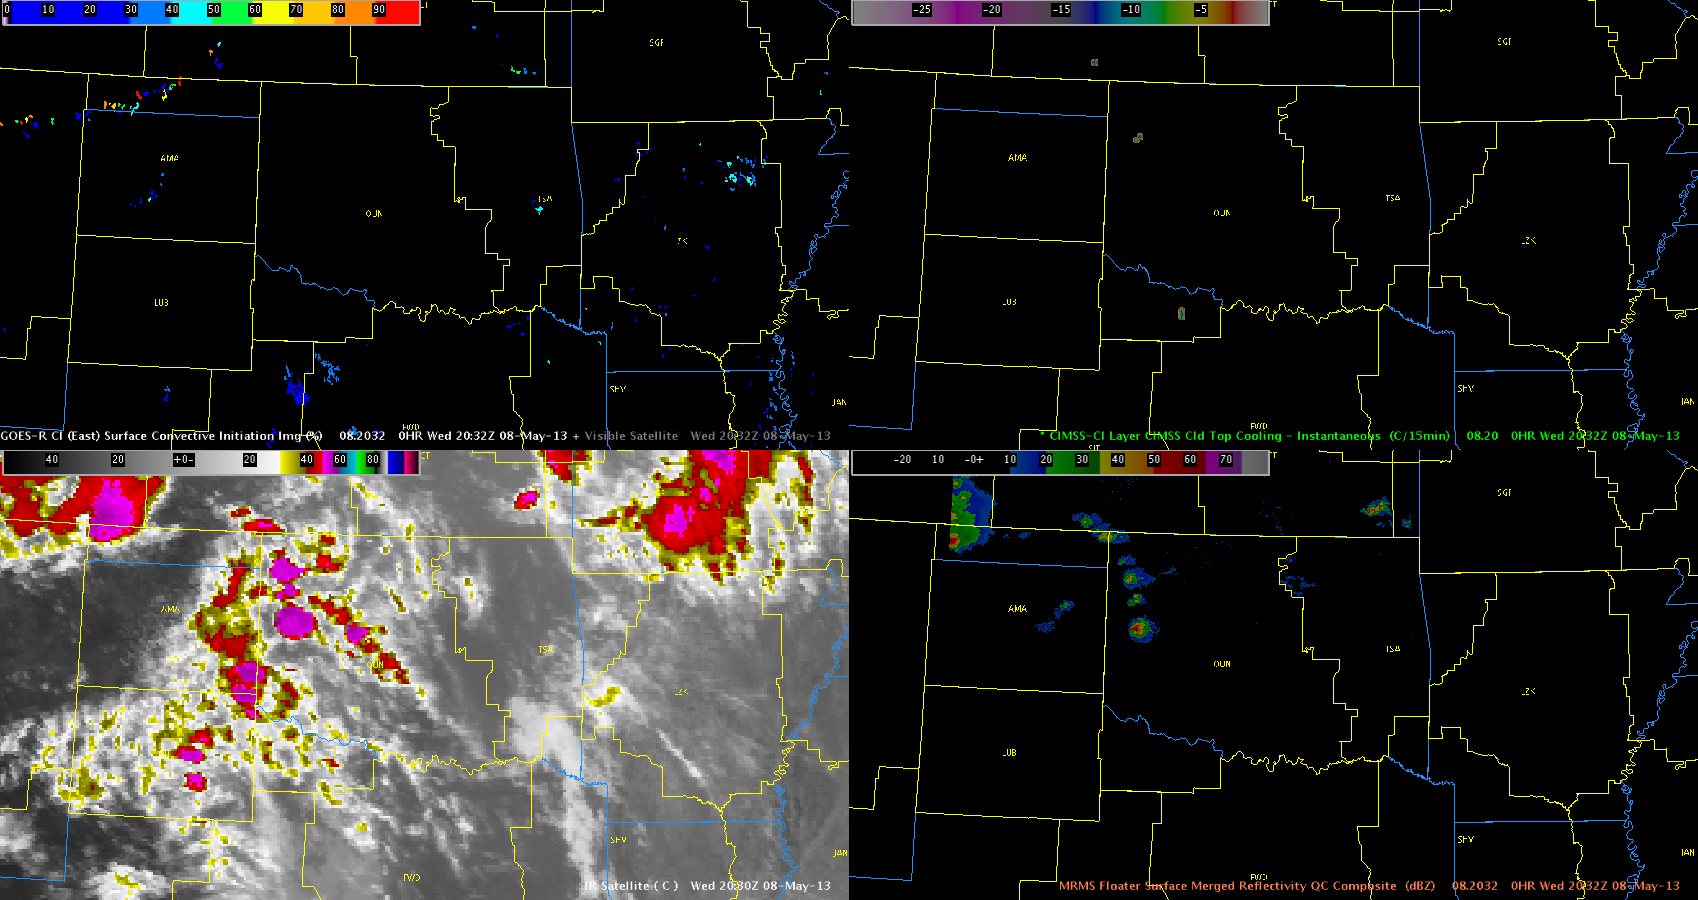
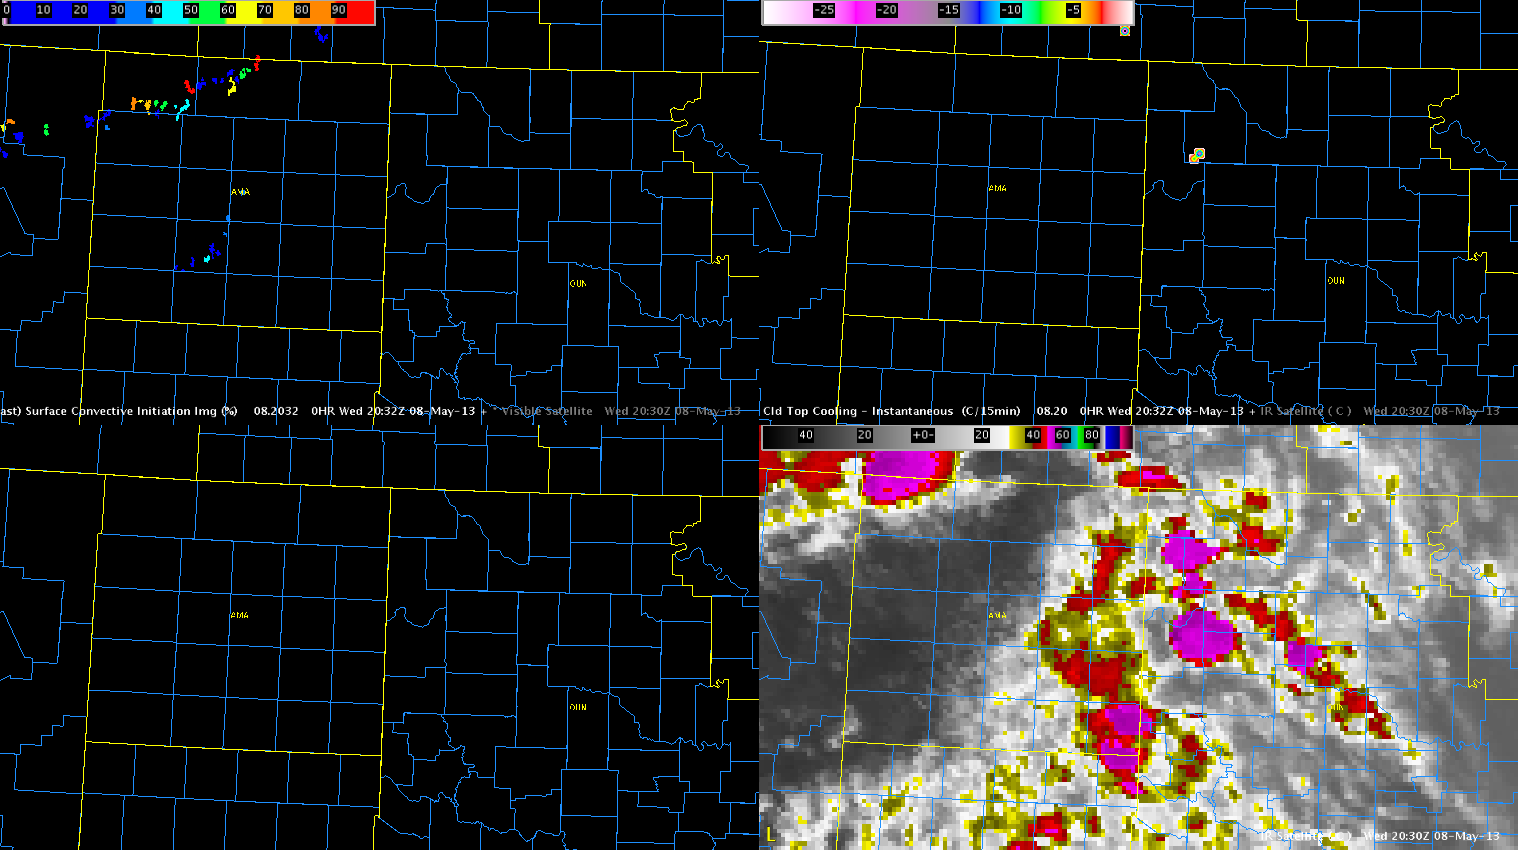
Early high and mid cloud contamination from an approaching upper-level jet limited use of both the UAH CI and UW CTC products across northwestern Oklahoma this afternoon. Storms initiated around 3 pm with the first Severe Thunderstorm Warning issued around 345 pm. The UAH CI product never showed any signs of CI due to this cloud contamination, but the UW CTC product did briefly show some signs of severe storm development as it provided an approximate 20 minute lead time on the first warning issuance. Previous shifts had found longer lead times utilizing the CTC product, but the extent of upper and middle cloud contamination was not as pronounced during those cases.
4 panel imagery showing nothing from the CI product. The CTC product did briefly pick up on cooling rates near 15 C/15 min at 2025Z.Same as above at 2032Z, with CTC showing cloud top cooling rates greater than 20 C/15 min.CTC product continued increasing to greater than 25 C/15 min with storm motion toward the northeast at 2040Z.Both the UAH CI and UW CTC products show nothing as mid and high clouds continue streaming in with mature storms at 2045Z.
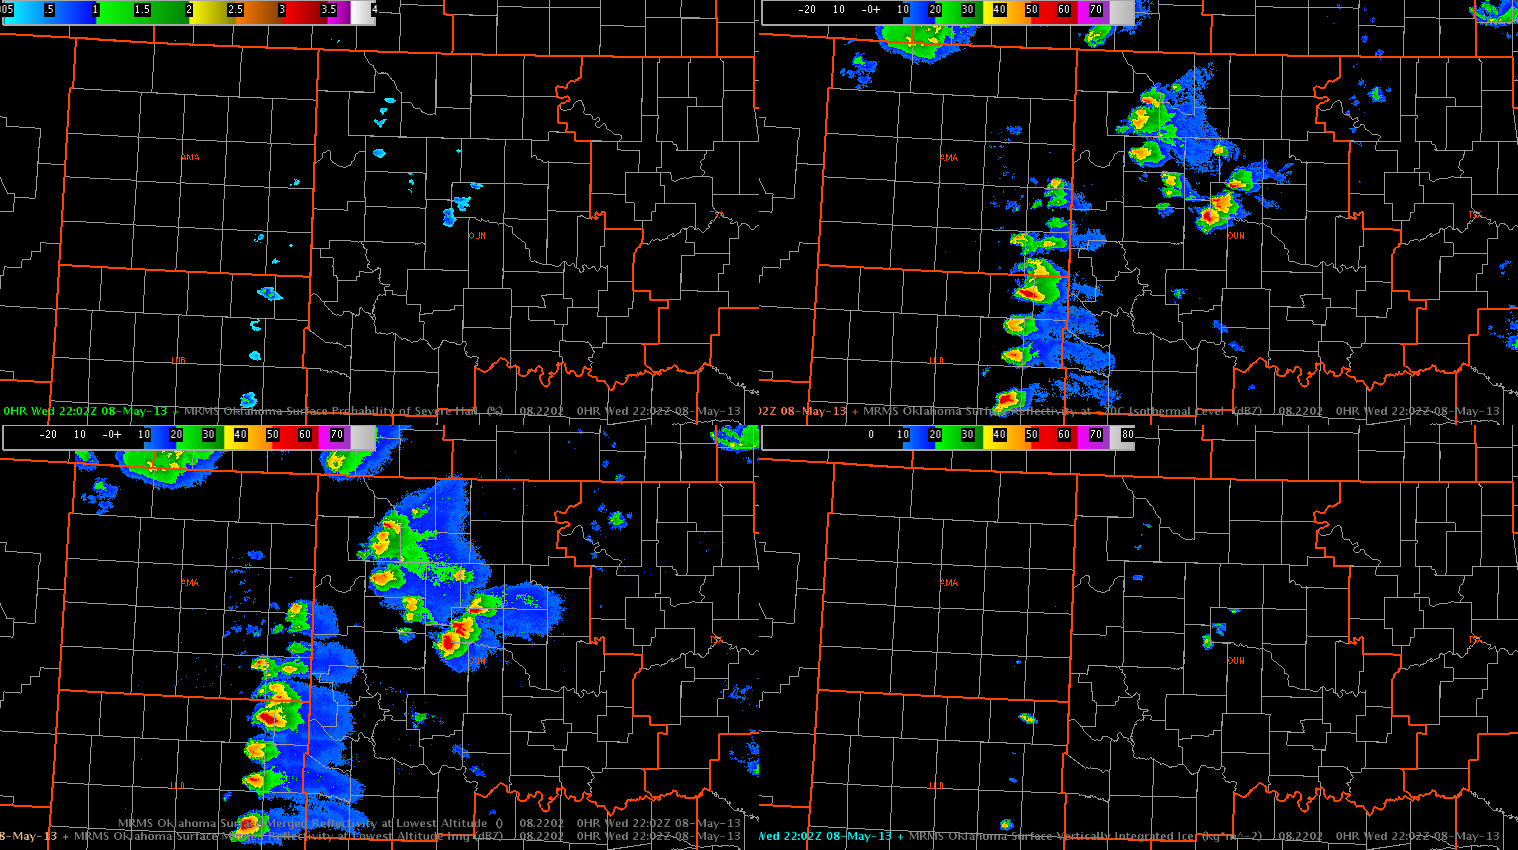
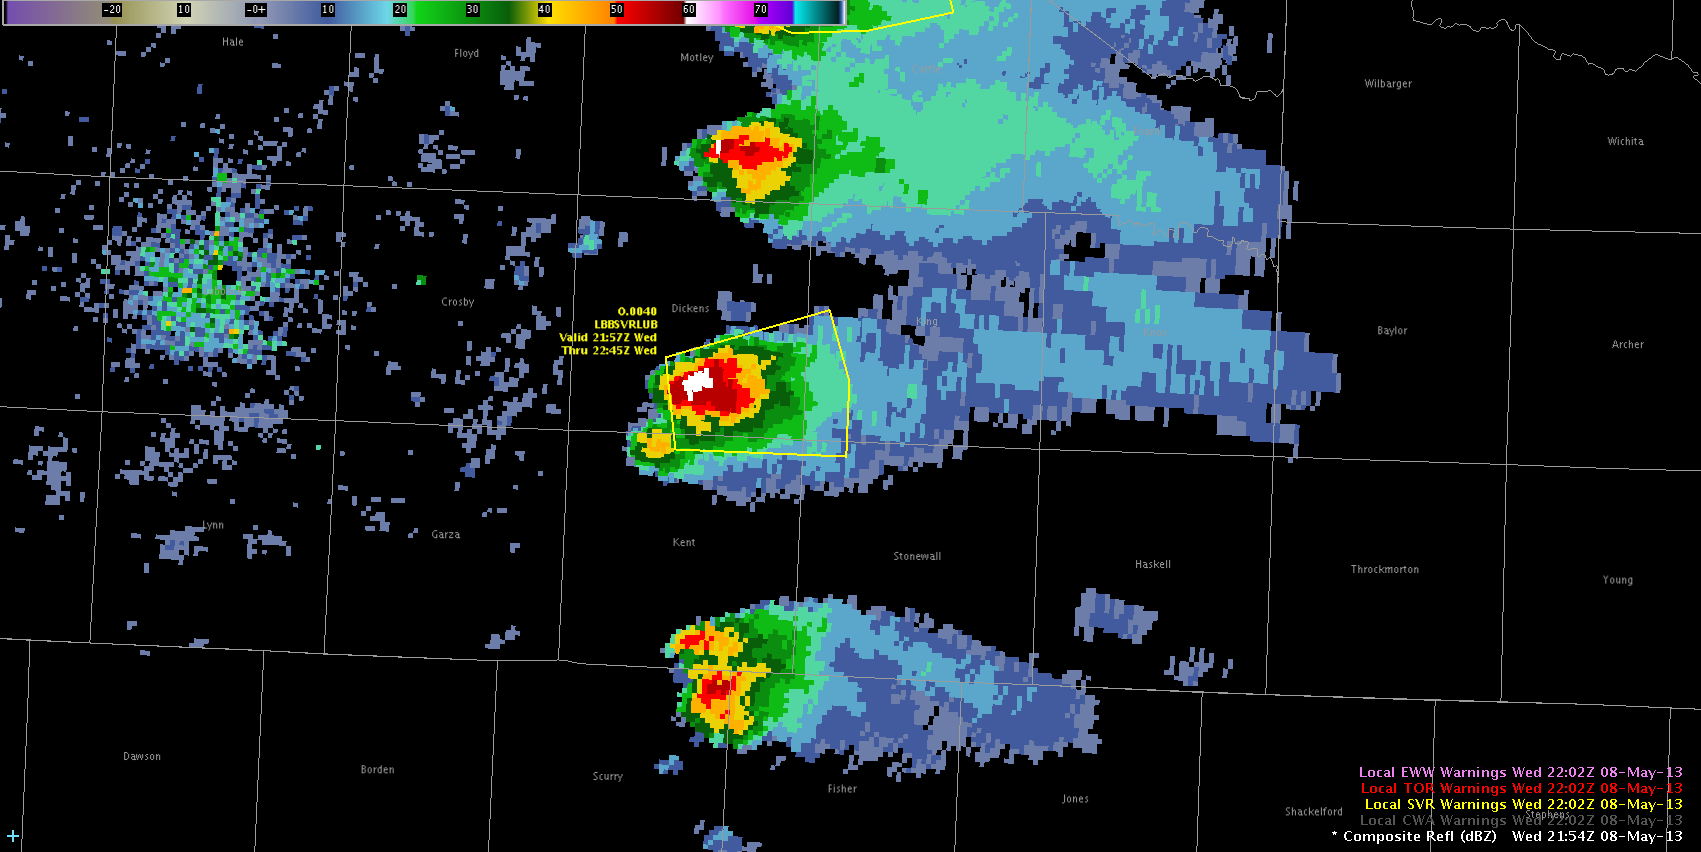
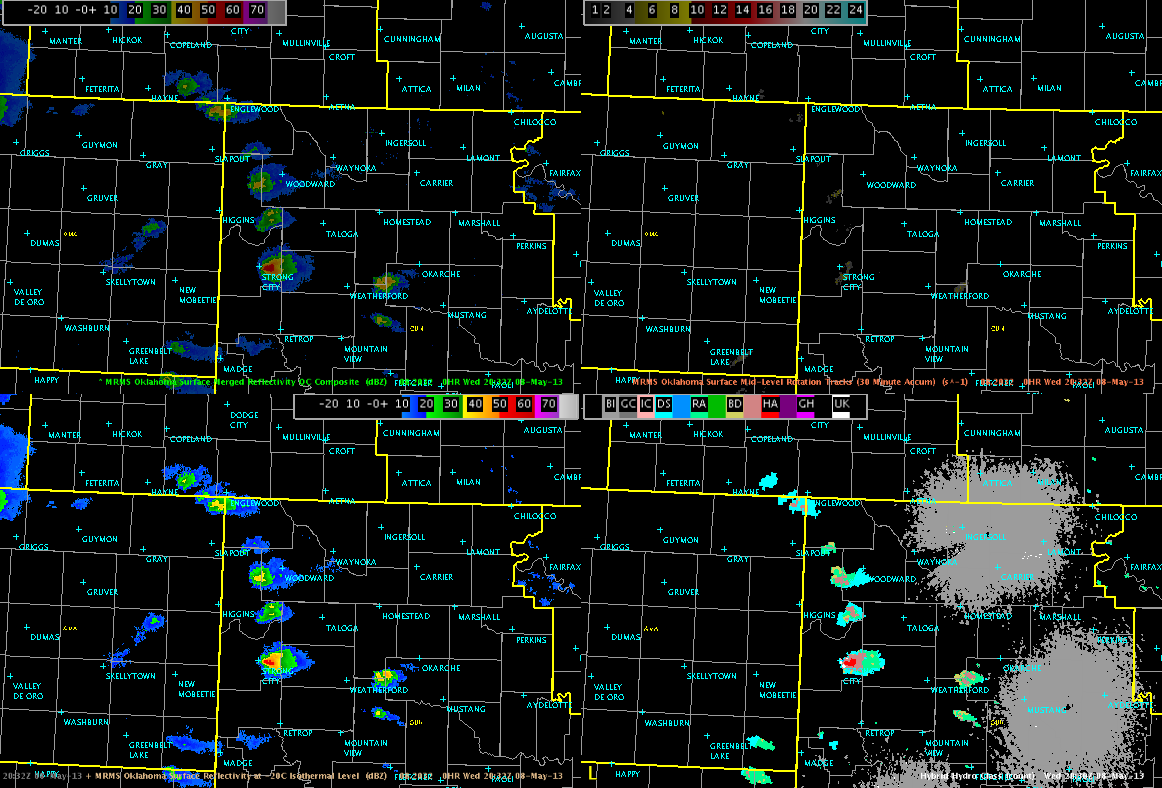
First, here is a look at the current MRMS data, which shows a line of very strong discrete cells along the dryline near and SW of southwestern Oklahoma. Additional convection (some cellular, some multi-cellular) curves up along the warm front and back toward the triple point into Kansas.
MRMS and MESH data, indicating the mode of storm development at around 22Z.
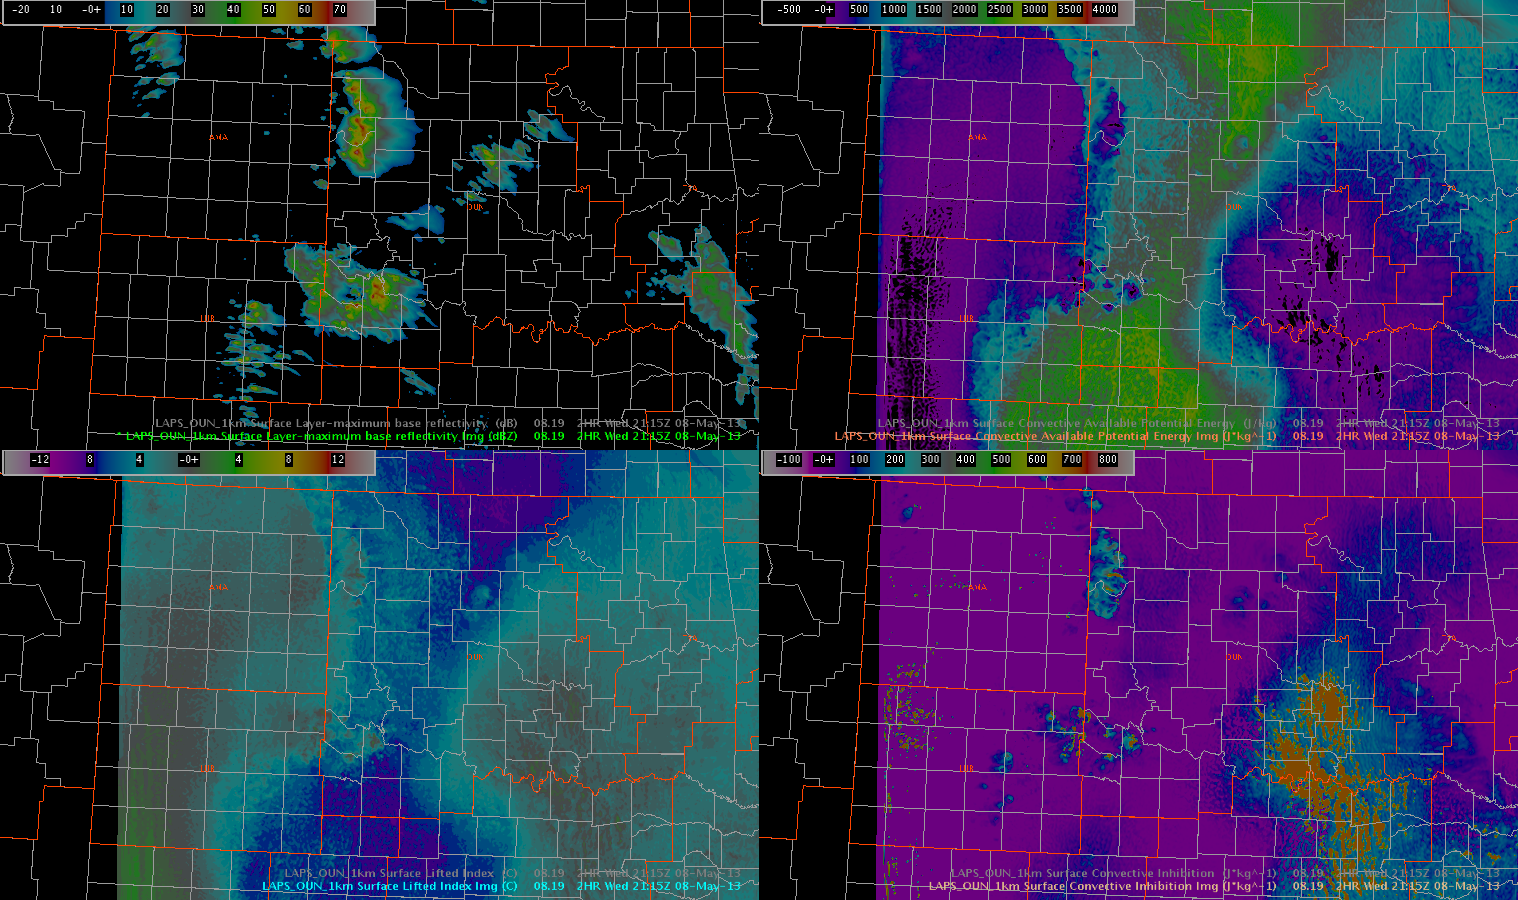
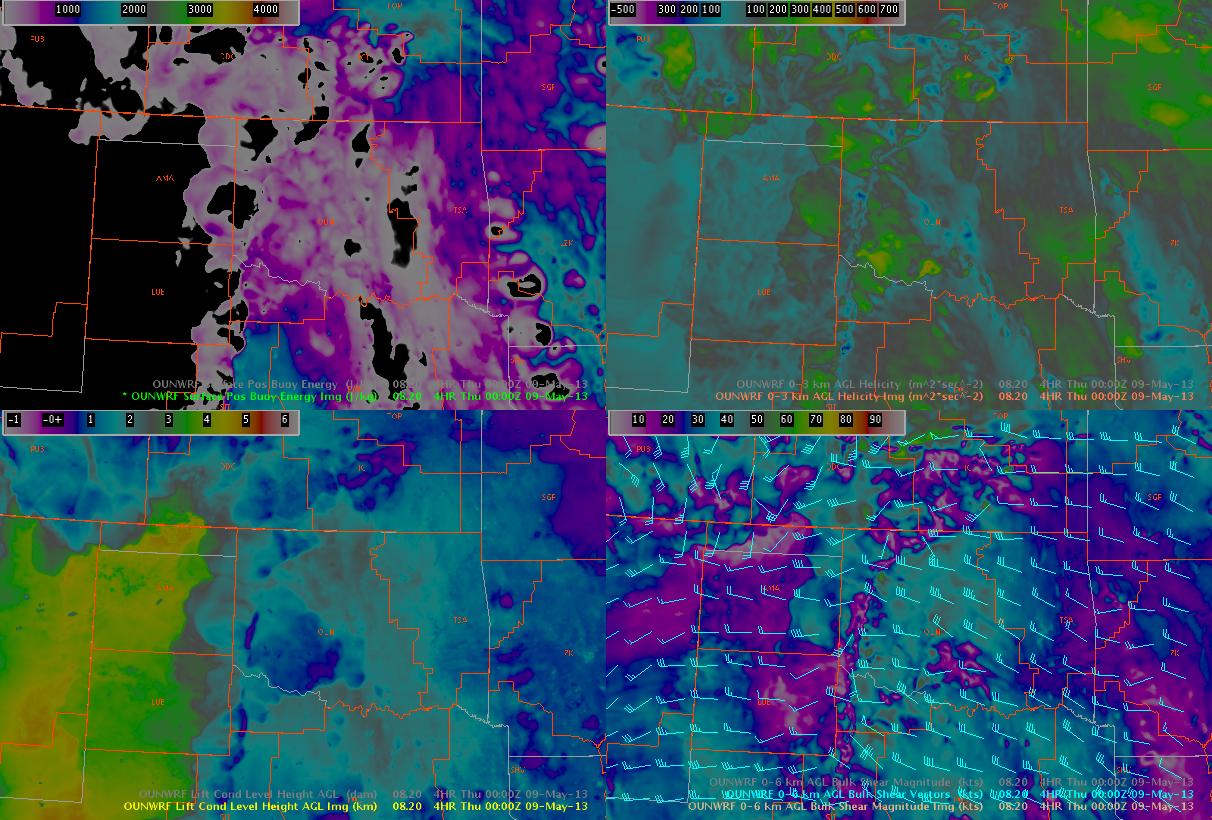
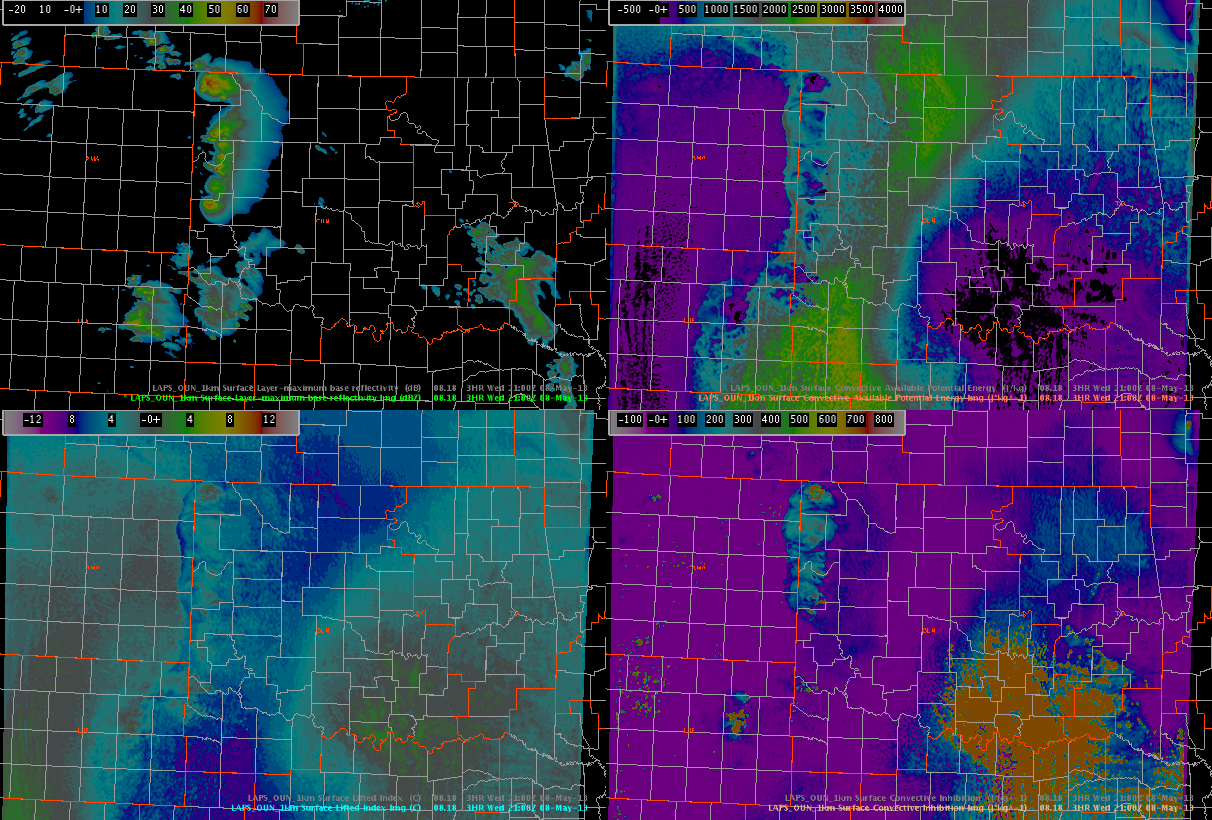
The 19Z LAPS forecast (1km OUN domain) appears to correctly capture some of the convection in Oklahoma and up into Kansas, but it did not accurately depict the mode of convection along the dryline. While the LAPS forecast shows several areas of convective clusters, the radar analysis shows a line of discrete supercells.
LAPS forecast data, with the top left showing simulated reflectivity. The other panes seem to correctly indicate the areas of significant instability with little-to-no inhibition.
Obs from the Oklahoma Mesonet show that a bulge on the dryline has developed in NW Oklahoma near the panhandle, with a wind shift (SE to SW) also evident on several mesonet stations.
22Z Oklahoma Mesonet surface data.
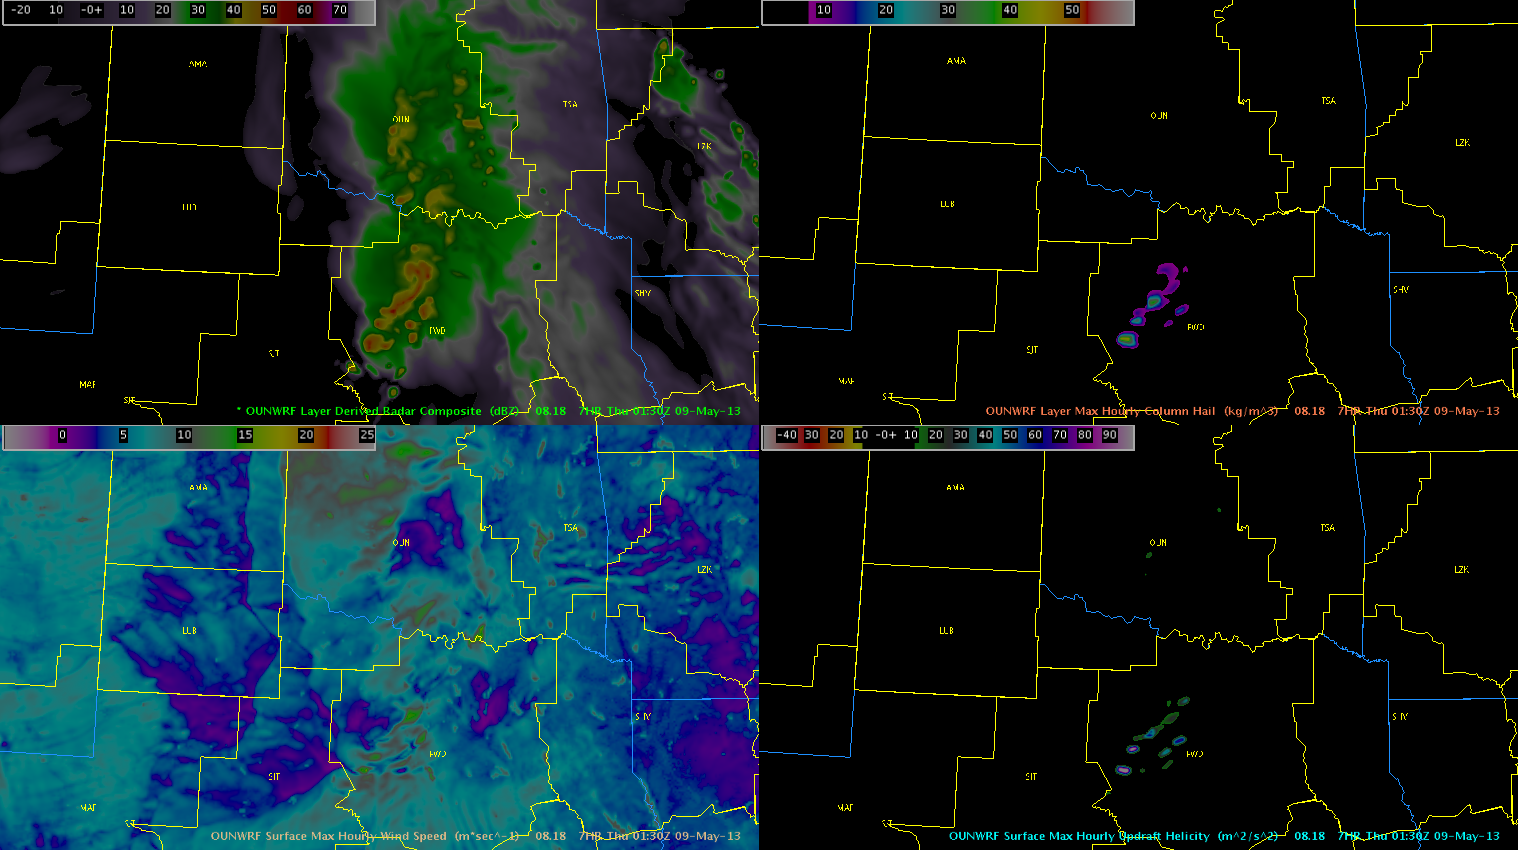
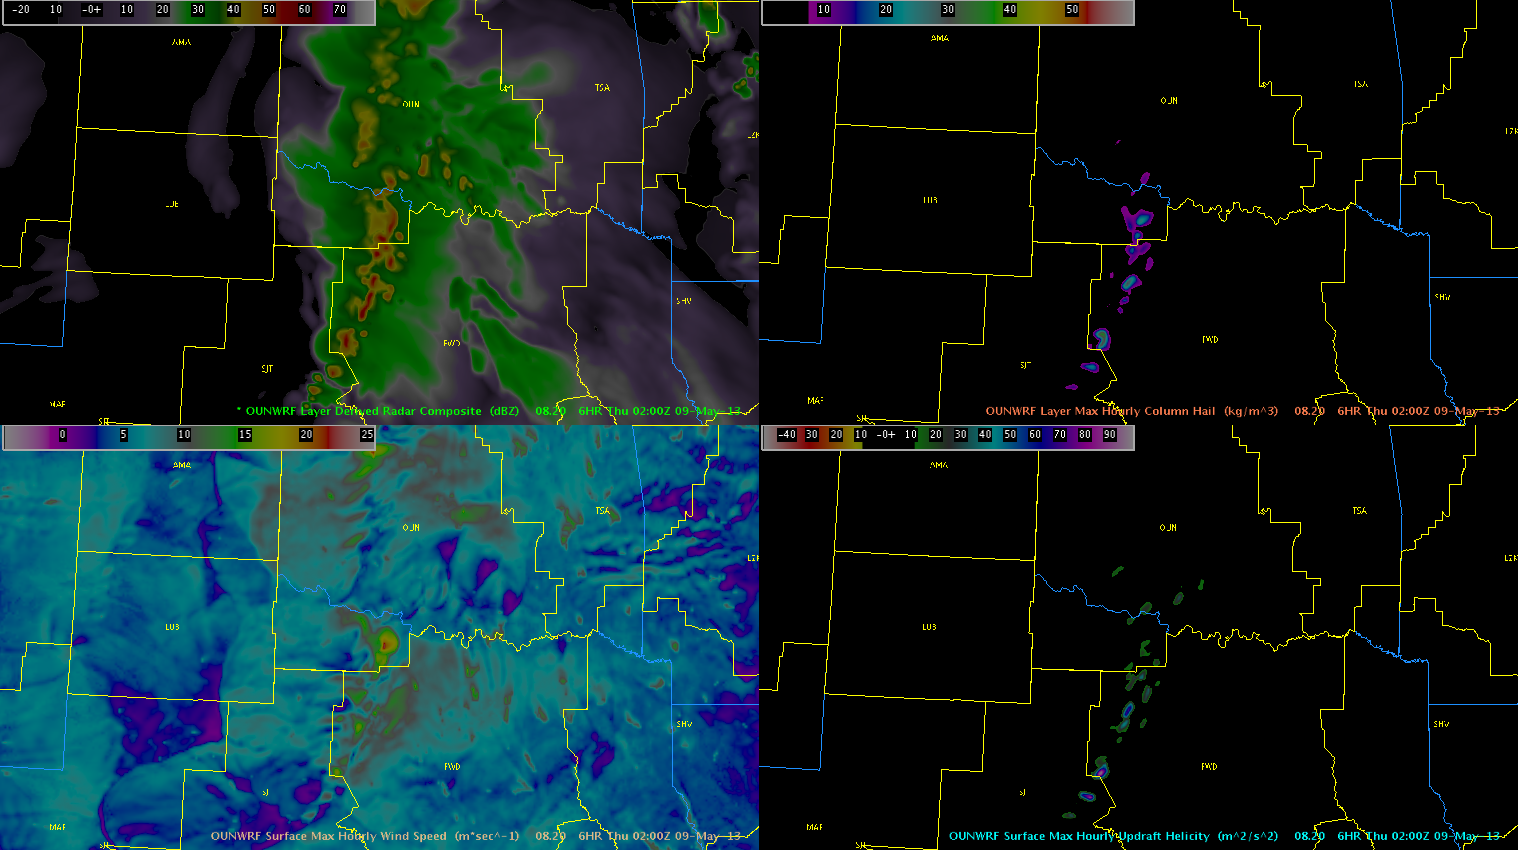
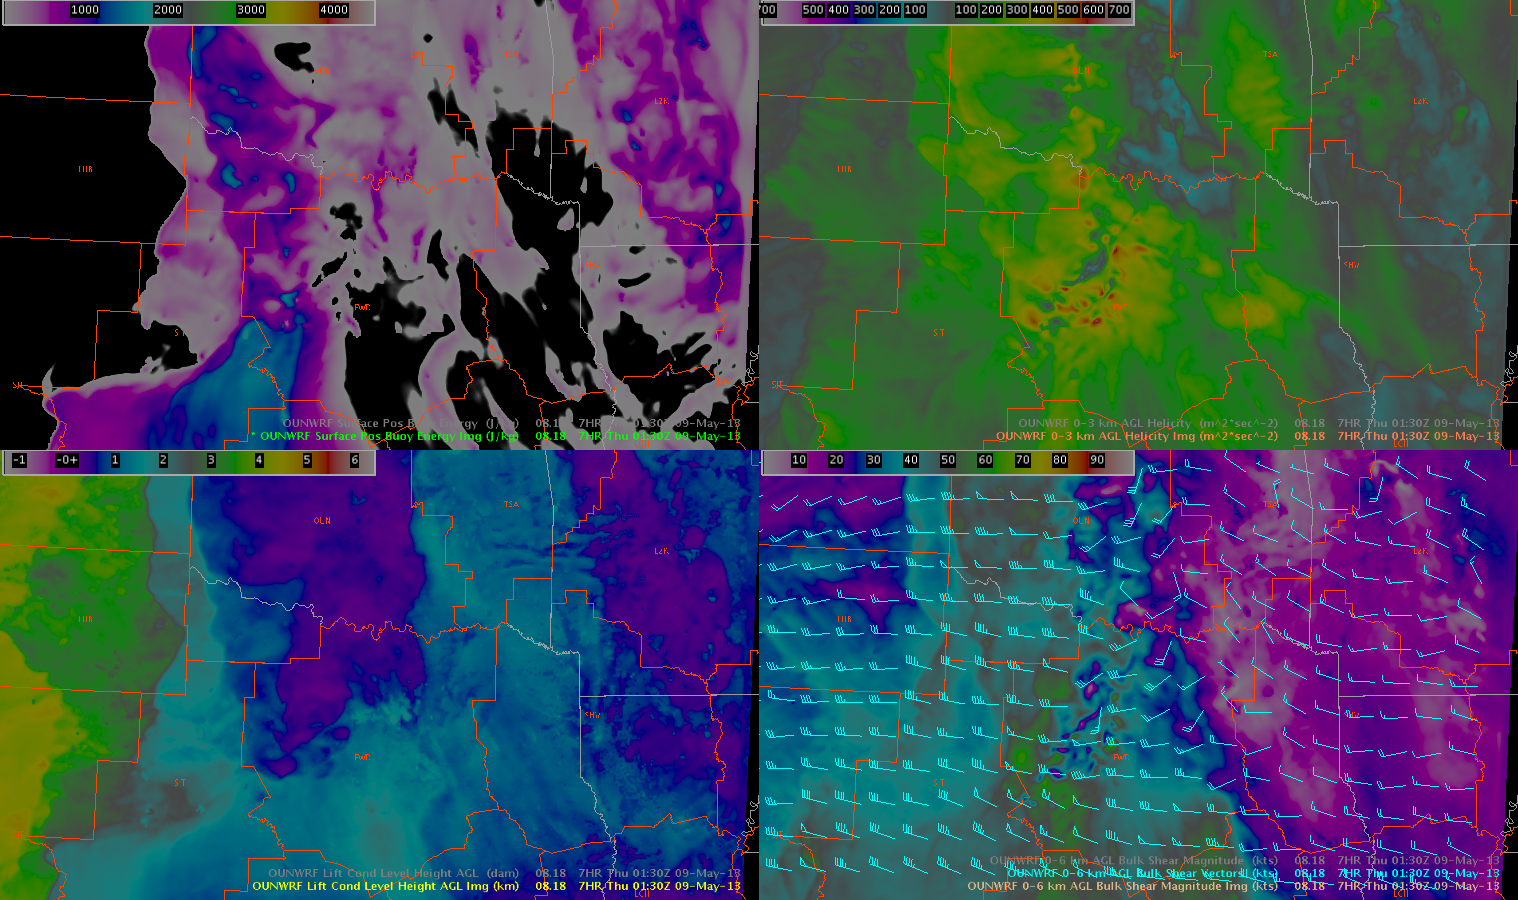
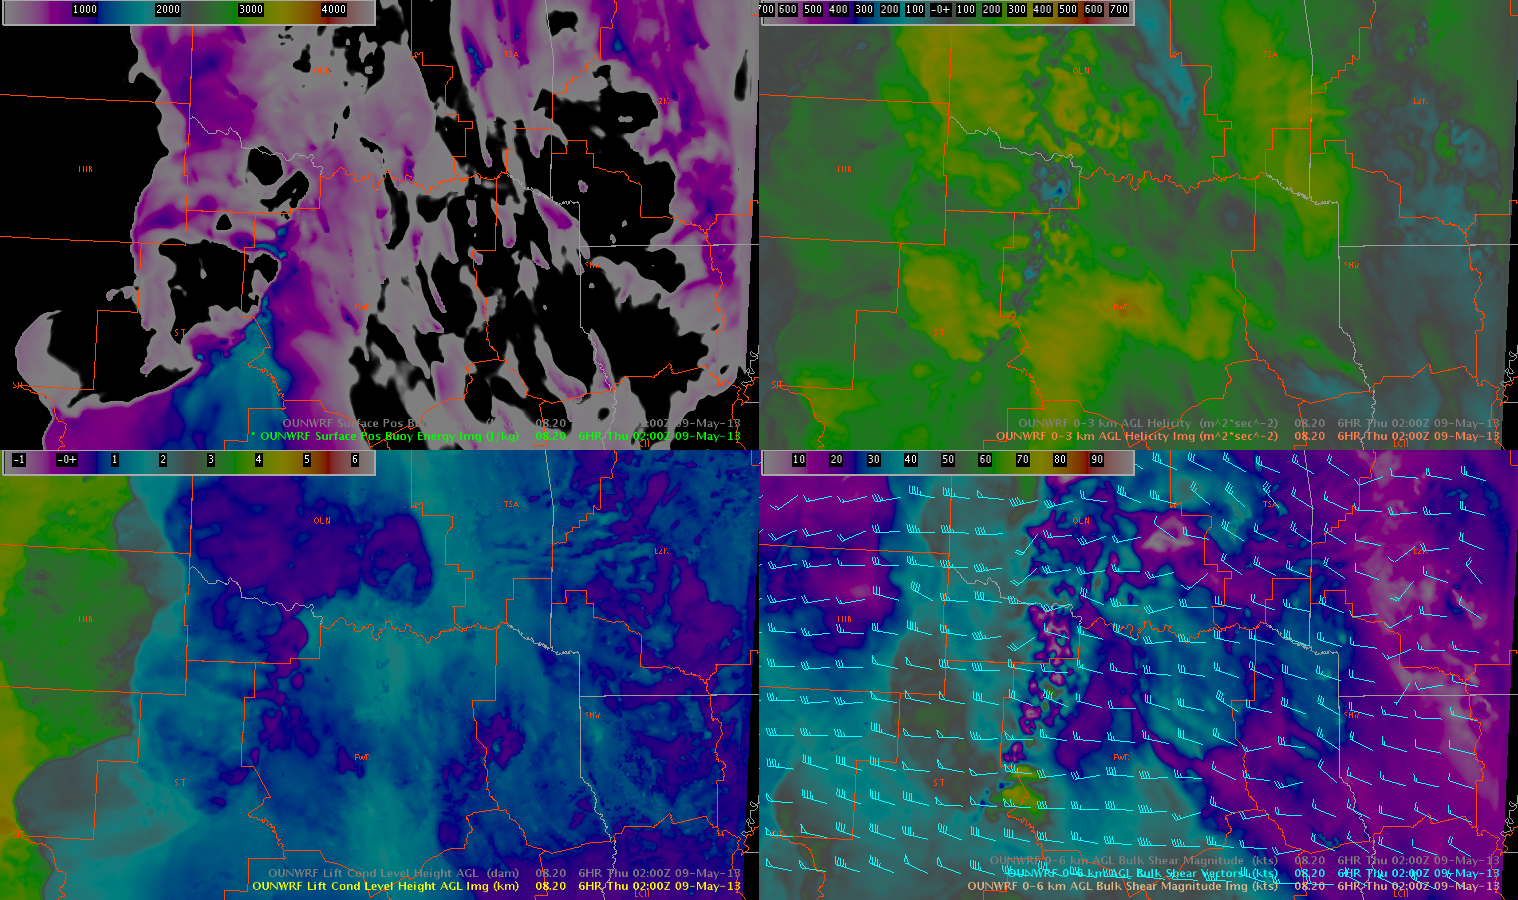
The 18Z and 20Z OUNWRF runs were examined to determine how the convection is expected to evolve tonight. Here are screen captures from 0130Z on the 18Z run, and 0200Z on the 20Z run.
18Z OUNWRF at 0130Z.20Z OUNWRF at 0200Z.
Although most of the intense convection is currently moving into the OUN forecast area, both runs of the OUNWRF show that by this evening, the storms in Oklahoma will weaken. While both runs show an intensification in the Dallas/Fort Worth CWA, with concentrated areas of max column hail and max updraft helicity, the timing is quite a bit different. The 18Z run was much faster, while the 20Z run has the storms just getting into the CWA by 02Z. The storm mode appears to be somewhat of a congealing of the discrete cells, perhaps into an MCS or several clusters.
Here are some of the convective parameters in the same two model runs.
OUNWRF 18Z run at 0130Z.OUNWRF 20Z run at 0200Z.’
As the storms strengthen as they move through northern Texas, they will be in an environment with low LCLs (under 1km) and perhaps some enhanced -03km helicity (though this signal was a bit stronger on the 18Z run than the 20Z run). However, SBCAPE will be very low by this time of day. In general, these parameters do not look as favorable (by later in the evening) in Oklahoma as they do in Texas.
As mentioned above, as the environment continues to evolve through the evening, it was noted that surface winds have shown signs and will start to back along/ahead of the dryline, and especially along and north of the KS/OK border, as the sfc low track north/northeast. This has resulted in an increased signal in the 0-3 Helicities, evident on both the 21z run of the RAP and the 20z run of the OUNWRF. Forecast soundings from central and western/southwestern OK and southern KS continue to support modest LCLs, with dry/stable boundary layers. However with 0-3km helicities increasing from the 60s and 70s into pockets of 200-300 m^2/s^2 by 00z. We believe that if LCLs continue to lower with increasing moisture, we could see our environment become slightly more conducive to tornadic development. Especially across northern OK/southern KS and into central and southern OK.
Two persistent supercells across the TX Panhandle region have shown signs of strong mid level rotation, but spotters and local observations suggest cloud bases are much too high for tornado formation. Therefore, these MRMS TDS signatures appear to be false alarms. The images below show examples from two storms.
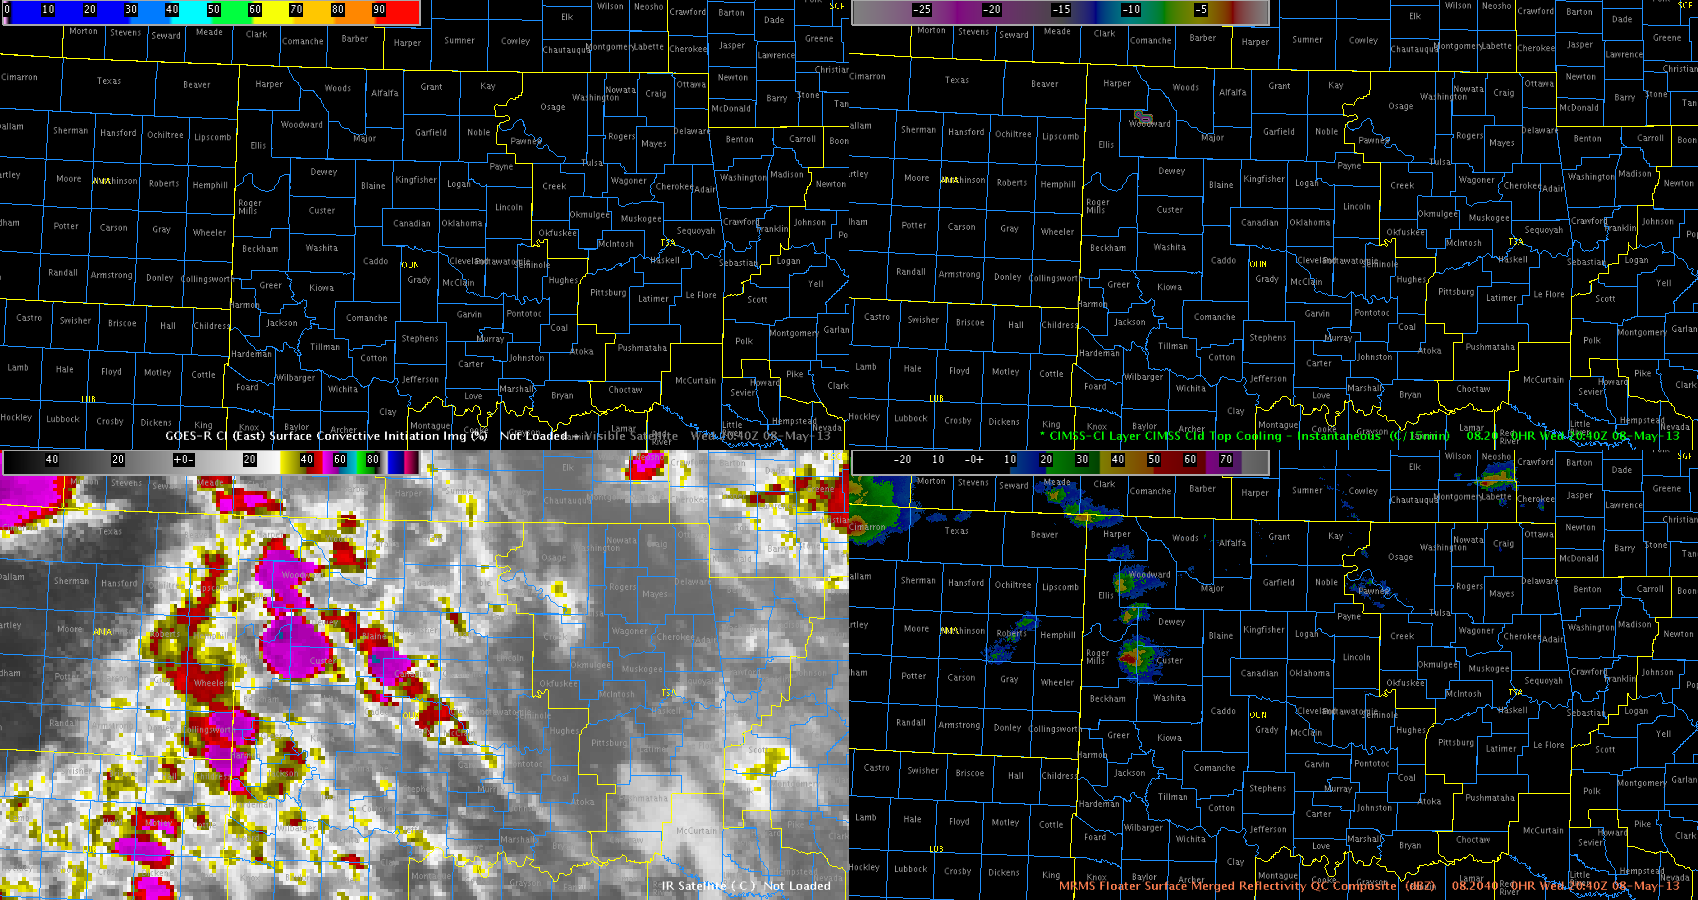
Developing supercells over the TX panhandle became severe appox 30 to 45 min after a significant CTC signal. This signal is shown below in the upper left corner of the 4 panel. 30 to 45 min. after the minimum CTC value of -33, MESH indicated 1 inch or larger hail. This is displayed in the second image below. Of note is how well the CTC algorithm is performing despite a modest cirrus shield.
High 50s/low 60s dew points are continuing to pool across western OK as observed on the OK mesonet.
2035z Mesonet
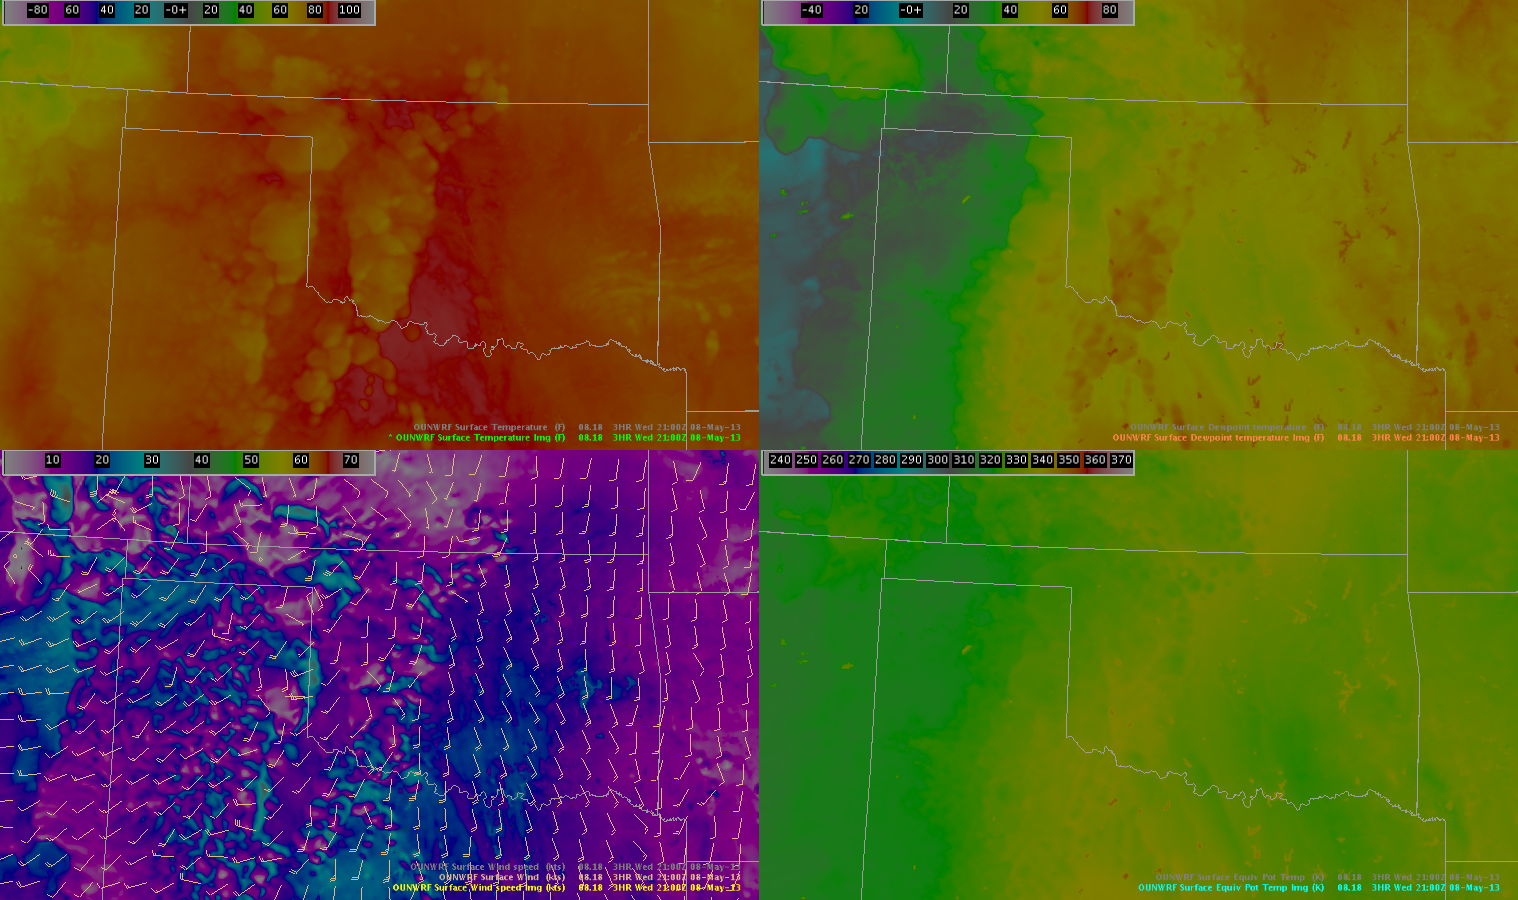
The OUNWRF appears to be capturing the current dewpoints correctly over Oklahoma, especially in the area where convection is developing. However, the temps ahead of the convection appear to be too high on the OUNWRF. It is possible that this is contributing to the over-development of convection on the OUNWRF (as seen spatially on the simulated reflectivity products).
LAPS analysis from the 1 km OUN domain continues to do a decent job with the placement of the composite reflectivity across western OK. Interestingly enought the 21z LAPS shows a clean swath of 2200 to 2600 J/Kg SBCAPE spreading northward across western north Texas, with another pocket of 2000 to 2500 J/Kg SBCAPE near the OK/KS border, which would be nearer the sfc low which continues to churn E/NE across the TX panhandle.
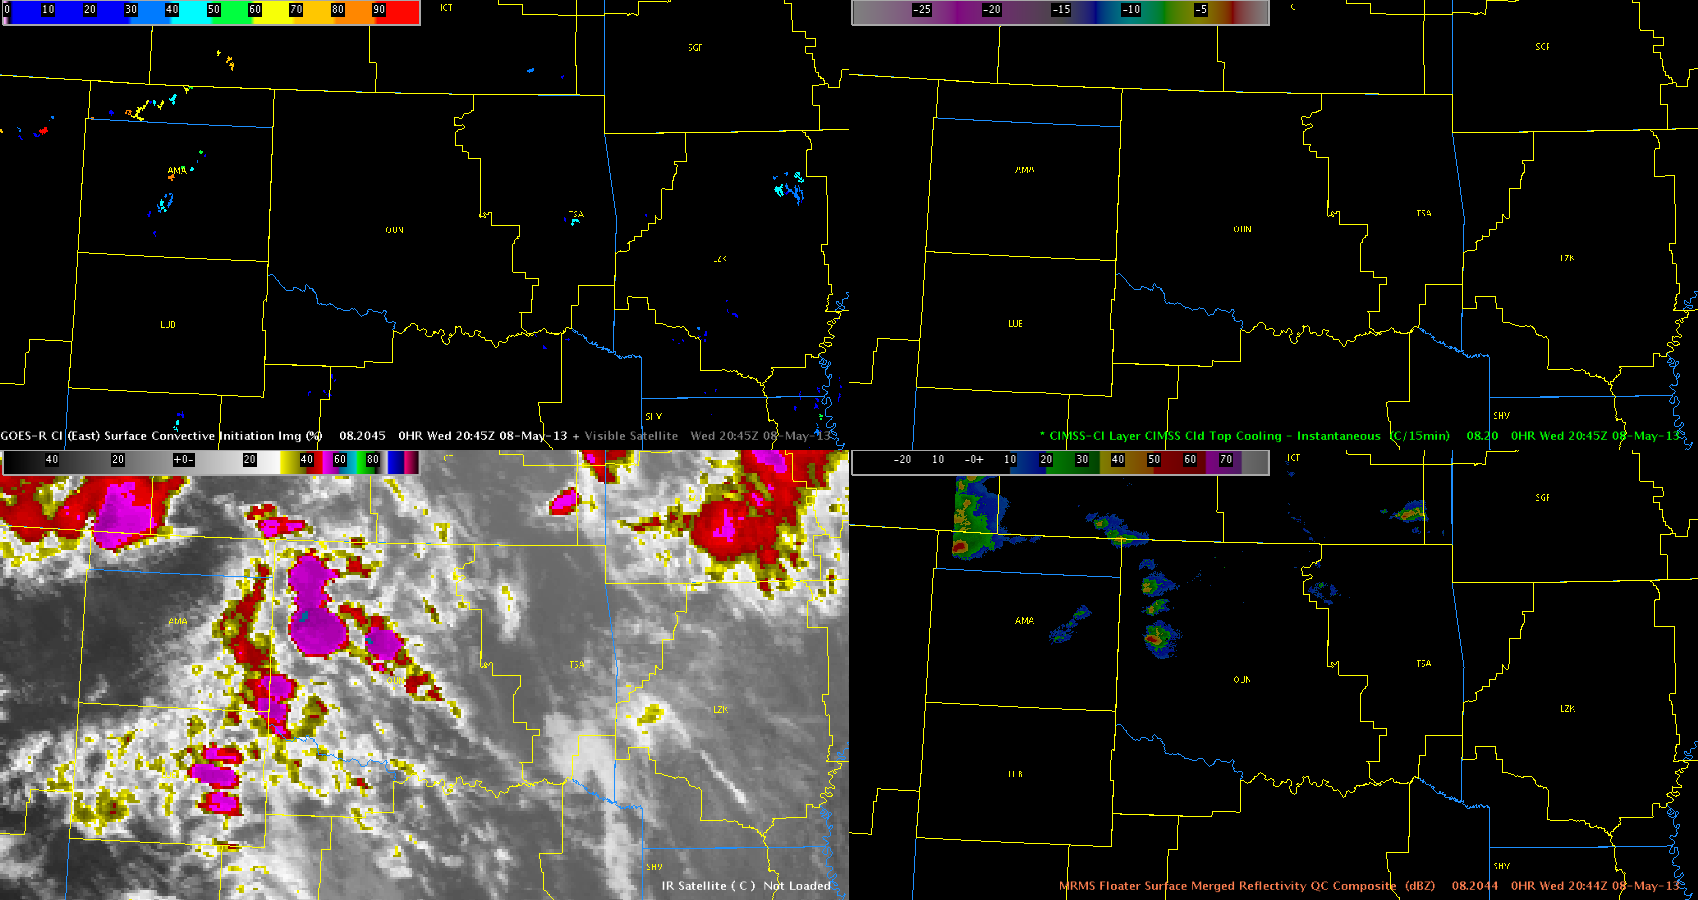
Early convection this afternoon developed in a sct to bkn area of cumulus, with scattered cirrus/stratus spread across Panhandles through western OK. This has resulted in little to no response from the both the GOES-CI and CTC products due to the contamination from the cirrus and stratus. The screen capture below shows the area of intense convection developing over Oklahoma, with little to no apparent signals in the CI/CTC products. This was also the case for several time steps before this image was saved.
CI, CTC, IR
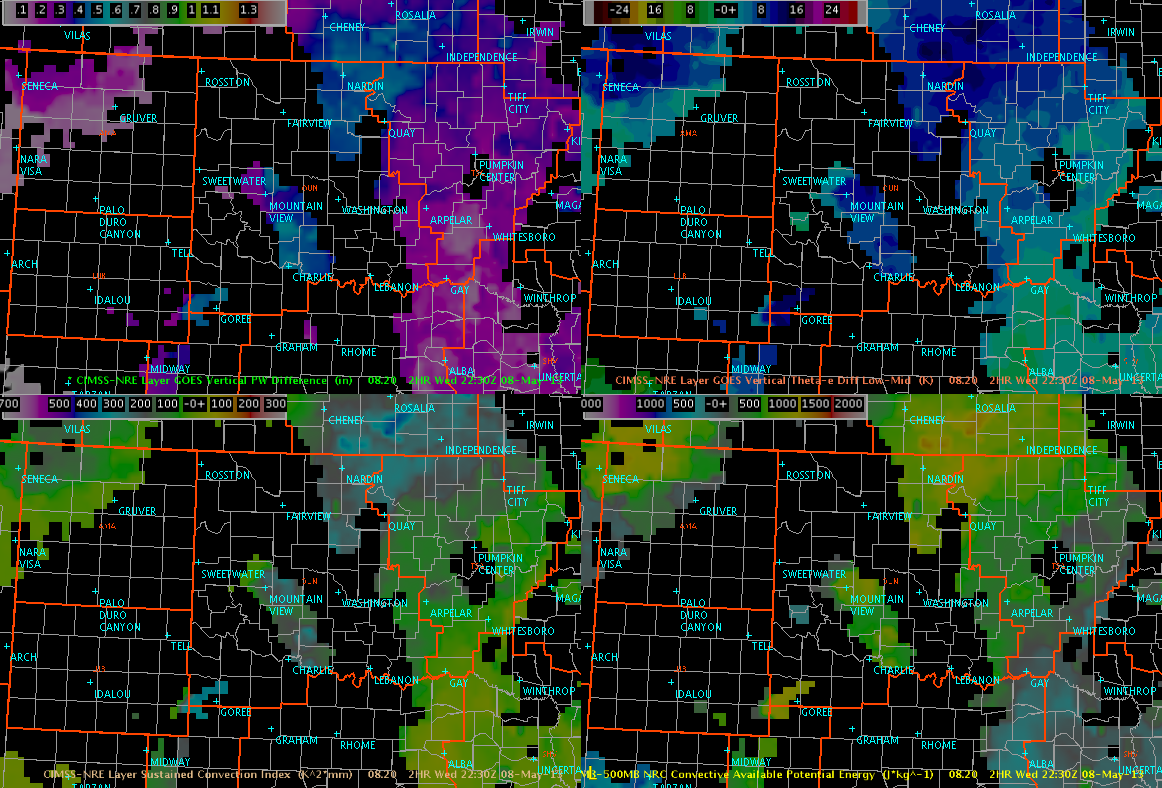
Nearcast products from CIMSS/GOES have also struggled with the presence of clouds before convective initiation. This is evident from loss of data across western OK and the TX panhandle.
PW Diff, Te Diff low-mid, Convection Index (K^2mm), 780-500mb CAPE
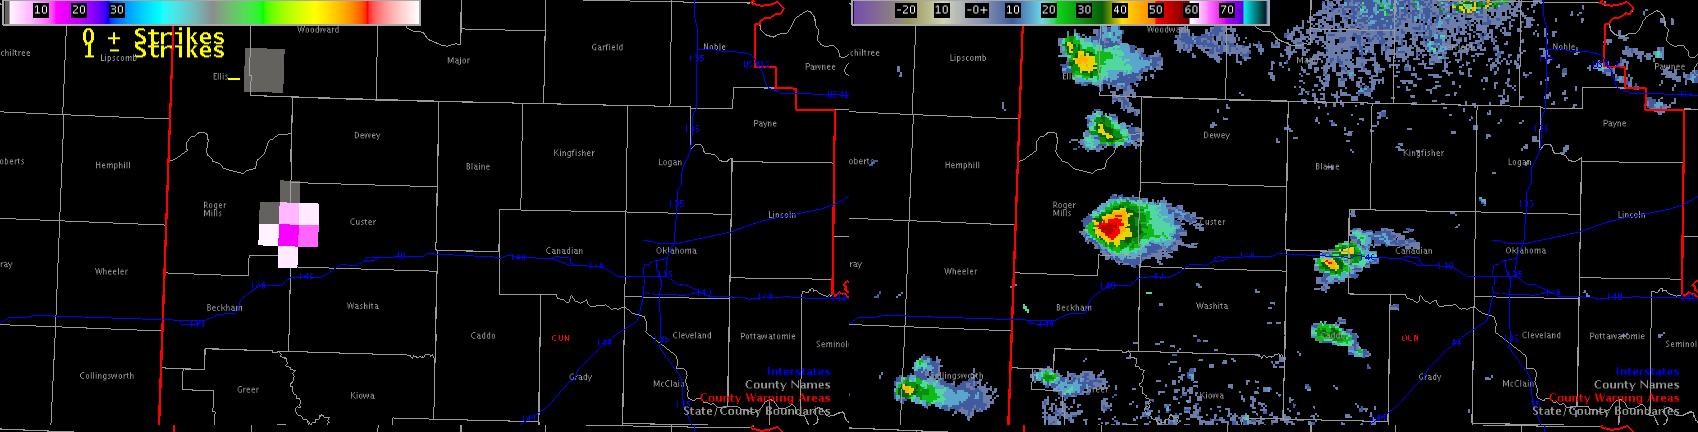
Below is a 4 panel image of Flash Extent Density, Composite Reflectivity, and MESH. With two supercells indicating large hail via MESH, one would expect larger values of FED, which have only maxed out around 5 flashes/min. However, this may have something to do with distance from the LMA centroids. We will continue to monitor. In any case, the PGLM products are very useful for aviation and public safety interests for points downstream.
**Update at 2107 UTC**
Monitoring the storm following Flash Extent Density Trace Tool, it appears many of the storms have entered a period of decreasing lightning activity. This is also apparent in the plan view of FED. This would suggest a downward trend in storm severity, but will monitor to see if this comes to fruition.
With convective initiation underway, we assess the intensification of thunderstorm updrafts using PGLM Flash Extent Density to determine electrical activity within the storm. The cell below has shown several weak lighting pulses over the last 15 minutes and is showing signs of becoming severe. Reflectivity is on the rise and the lightning activity appears to be foretelling of possible storm severity quite well.
Austin
2 Panel of Flash Extent Density (Left) and Composite Reflectivity (Right)