An official website of the United States government
Here’s how you know
Official websites use .gov A
.gov website belongs to an official government
organization in the United States.
Secure .gov websites use HTTPS A
lock (
) or https:// means you’ve safely connected to
the .gov website. Share sensitive information only on official,
secure websites.
Our team, as WFO/JAN, chose the setup for the Mississippi Pickle Fest at 1150 Lakeland Drive Jackson, MS as our IDSS location today (Tue, 08 Jun). Per SPC Outlooks, the Jackson area was on the “edge” of the Marginal Risk Area for severe weather. As operations began for today, a thundershower was noted to the SW of Jackson, moving NE toward the IDSS location of interest:
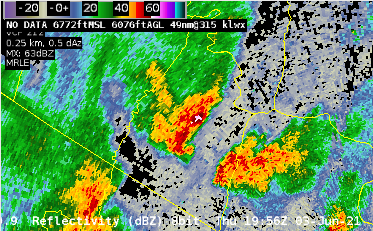
KDGX reflectivity at 1926 UTC, with shower SW of Jackson/Pickle Fest. Range rings at 5/10/20 miles.GLM and NLDN Lightning at 1932 UTC, showing electrical activity in thundershower SW of Jackson, MS.
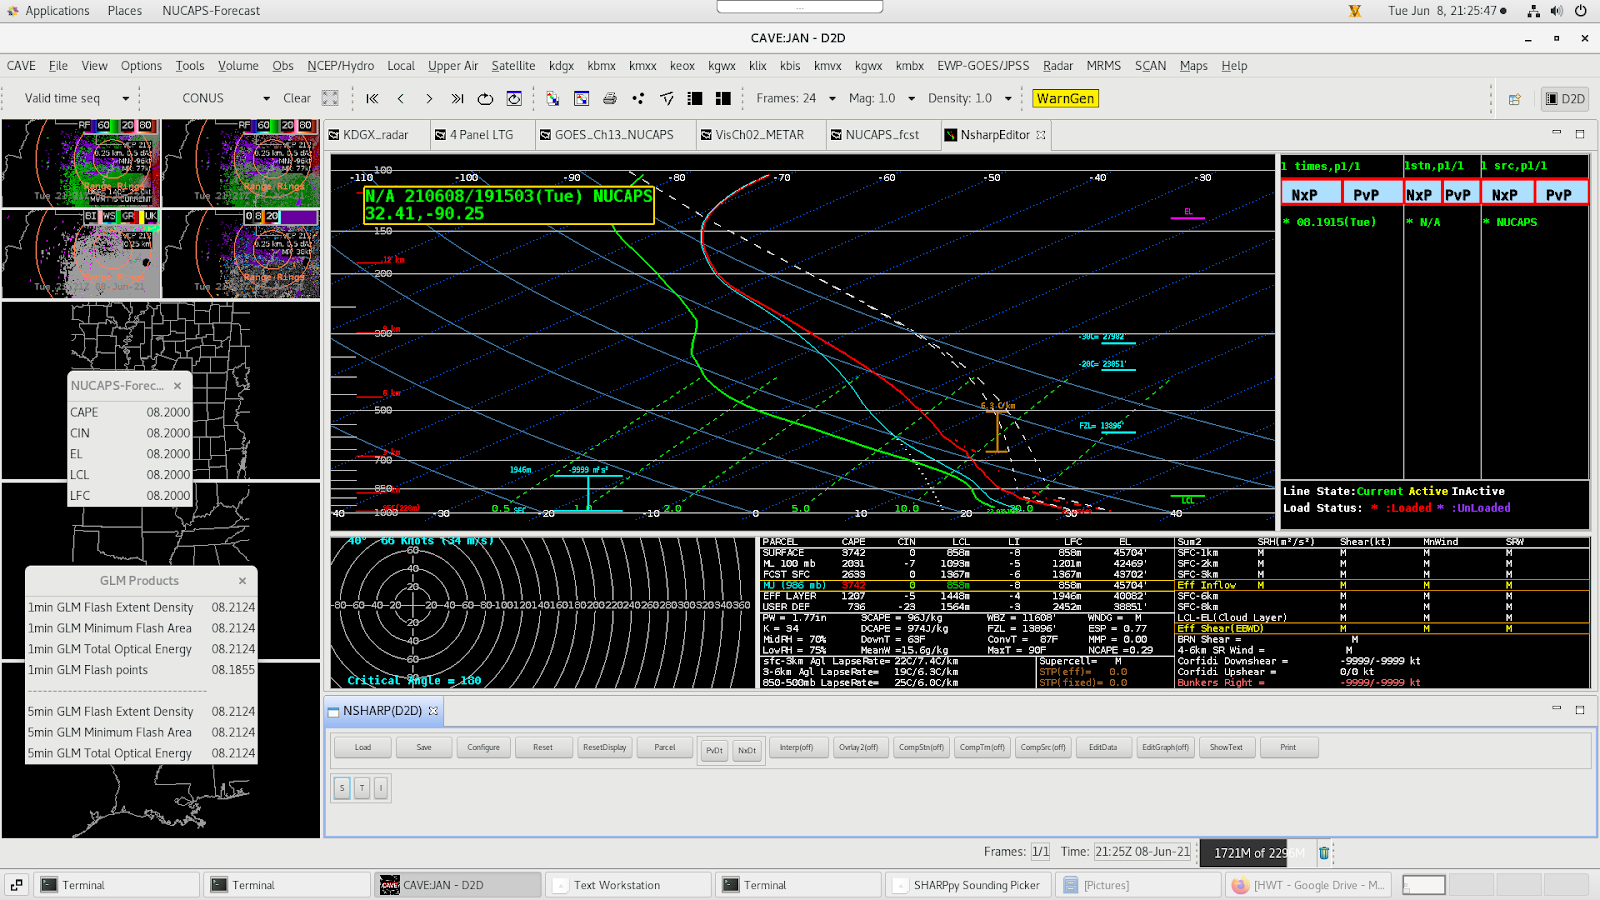
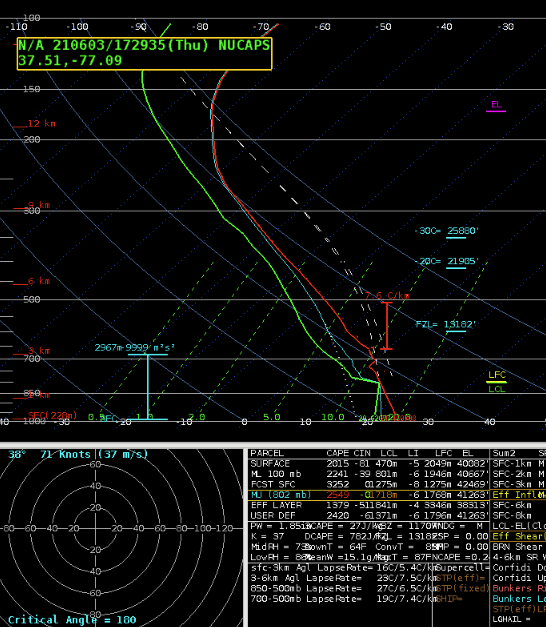
A modified NUCAPS sounding from near Jackson, MS (which became available later), indicated plenty of instability/CAPE (2000-3500 J kg-1), suggesting that the thundershower would be maintained as it advected toward the Pickle Fest location. This would be a good time for a “heads-up” to the event venue or EM. The unmodified NUCAPS sounding (not shown) still suggested sufficient instability aloft for the storm to maintain itself.
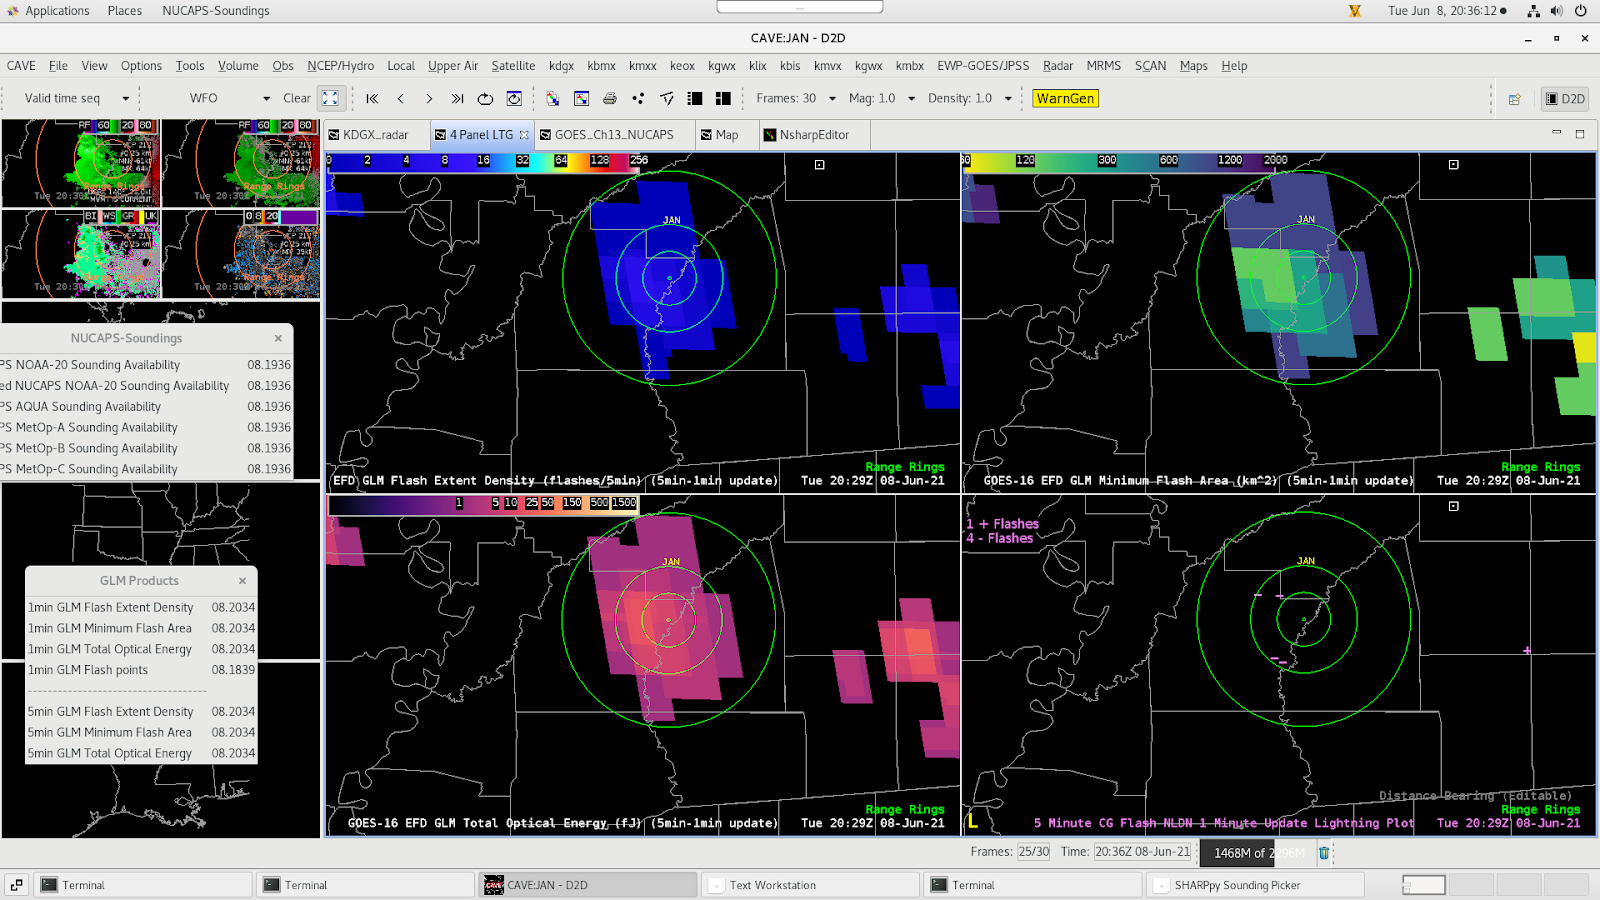
The ProbLightning product on the Web, somewhat surprisingly, still showed only ~25% chance of a GLM lightning flash within the next 60 minutes at 2001 UTC, but this had increased to 75% by 2026 UTC:
By 2029 UTC, the electrical activity was nearly overhead:
Interestingly, the NUCAPS forecast CIN was forecast to increase over the next couple of hours (valid 22UTC, below), after the storm passed, but ahead of another, stronger line further upstream (not shown).
Based on this, and the rapid collapse of electrical activity within the shower around 2110 UTC, a reasonably confident “all-clear” could have been given to the venue at that time…or at least until the upstream line approaches in a couple of hours, assuming it holds together.
Today was the first day of Week 2 for the Satellite HWT Experiment. One of the main applications we are looking at this week is the new ProbSevere Model version 3. We are able to compare this version to the one currently in use (version 2). This is the version most operational forecasters are familiar with, and that is available in AWIPS2 and GR2 Analyst.
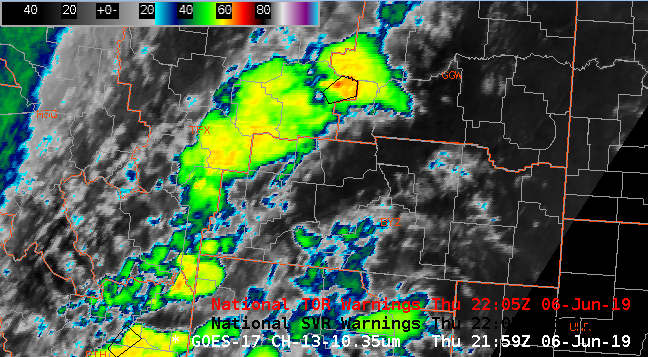
The target today was convection occurring in the Shreveport, LA CWA this afternoon. A QLCS was moving across the region from west to east, as shown below. The reflectivity was not especially impressive, but velocity scans occasionally showed some stronger winds.
Above: A line of storms moving through Louisiana on June 7, 2021.
The image shows MRMS Vertically Integrated Ice (VII) on the left, a parameter many forecasters are familiar with and may use as perhaps a “sanity check” to see if a cell may be trending towards strong or severe. On the right is a screenshot of the Shreveport radar (KSHV) at the 0.3 degree reflectivity slice. Overlaid is the ProbSevere Model with ProbSevere2 and ProbSevere3 parameters both listed for comparison.
As you can see there are a few areas of concern. A quick glance at VII indicates there may be some strong updrafts capable of hail over the area of convection over southeastern Caddo County in northwestern Louisiana. Looking at the output for ProbSevere2 in this same area, there is a 43% chance for hail in this area, and a 14% chance for hail according to ProbSevere3. The new and not yet operationally available ProbSevere3 uses a newer, more highly-skilled algorithm that should theoretically better match with ground truth.
During this time there were no hail reports in SPC’s database, severe or otherwise. There were some areas of surface based CIN noted, and this may have suppressed stronger updrafts and thus large hail. So in this case, it appears that the newer version of ProbSevere was correct about hail not being severe.
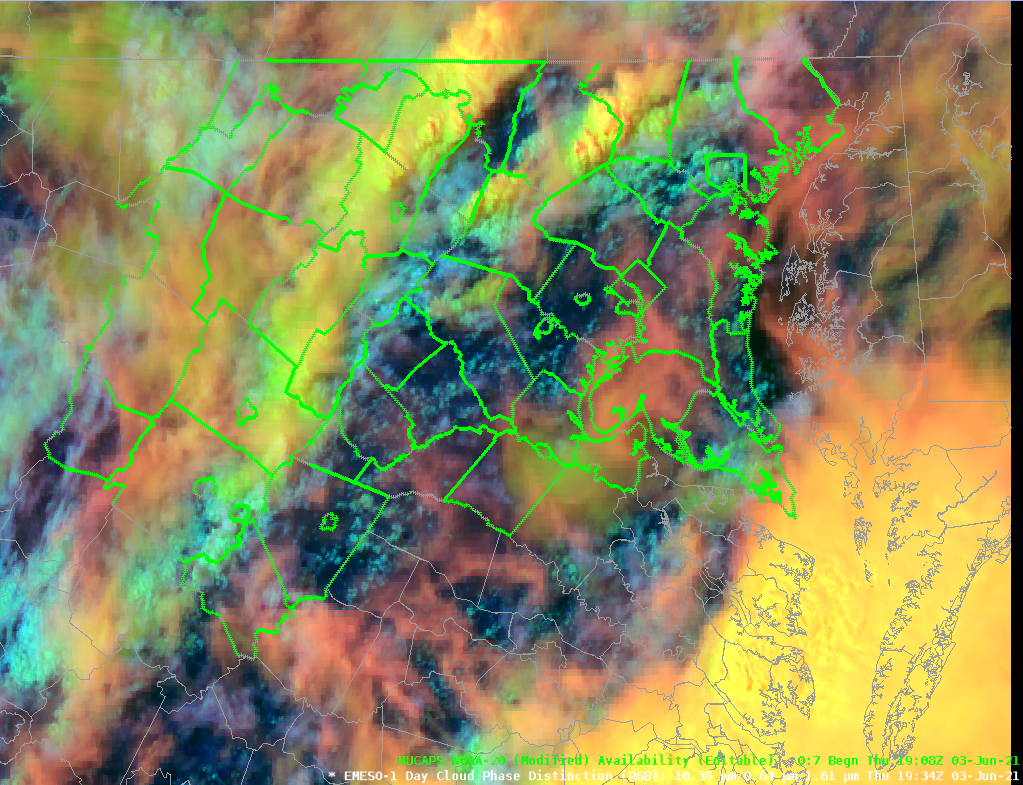
Image 1: 1943 UTC GOES East Mesosector Day Cloud Phase Distinction
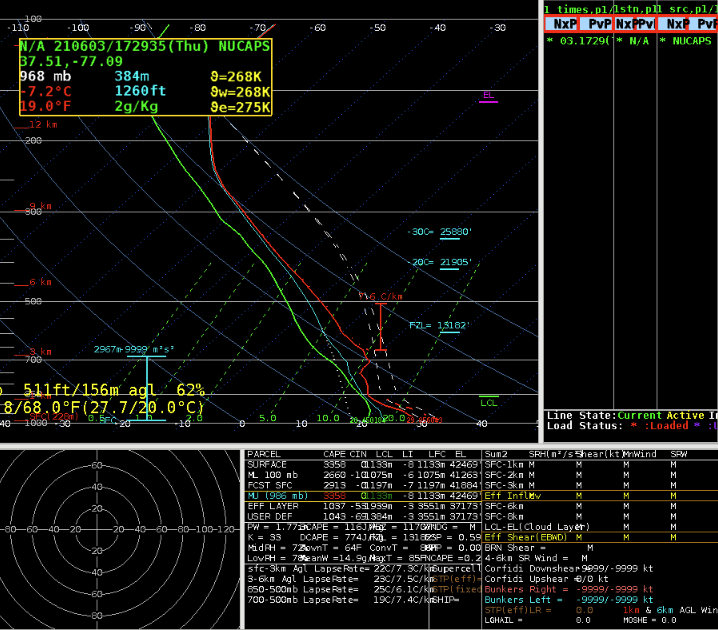
The modified NUCAPS sounding from 1730 UTC revealed in excess of 2,000 J/kg of CAPE (image 2) and by 1900 UTC thunderstorms had developed in an area less shaded by high level cloud cover. Comparing this to RAP mesoanalysis data, it initially seemed too high as RAP mesoanalysis suggested closer to 1000-1500 J/kg (not shown) and based on initial lightning activity. SBCAPE from NUCAPS was extremely high and close to 4,000 J/kg which seems very high (image 3). We did note that for some reason the NUCAPS forecast image showed CAPE being “missing” over central MD/northern VA while the CIN fill was more complete. When sampled over the “missing” data in AWIPS in the Cloud, the readout showed actual values.
Image 2: NUCAPS Sounding near Washington D.C.Image 3: NUCAPS CAPE and CIN forecast at 2100 UTCImage 3: 2000 UTC 4 Panel of Day Land Cloud Phase
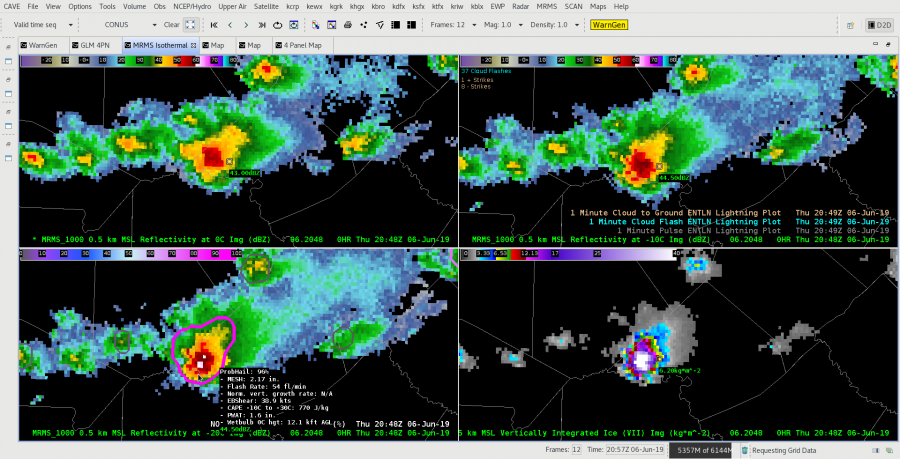
Initially, storms appeared to struggle with flash counts on the order of 10 to 20 flashes. Over the course of 30 to 45 minutes, lightning flash counts increased by an order of magnitude (closer to 100-150 flashes)
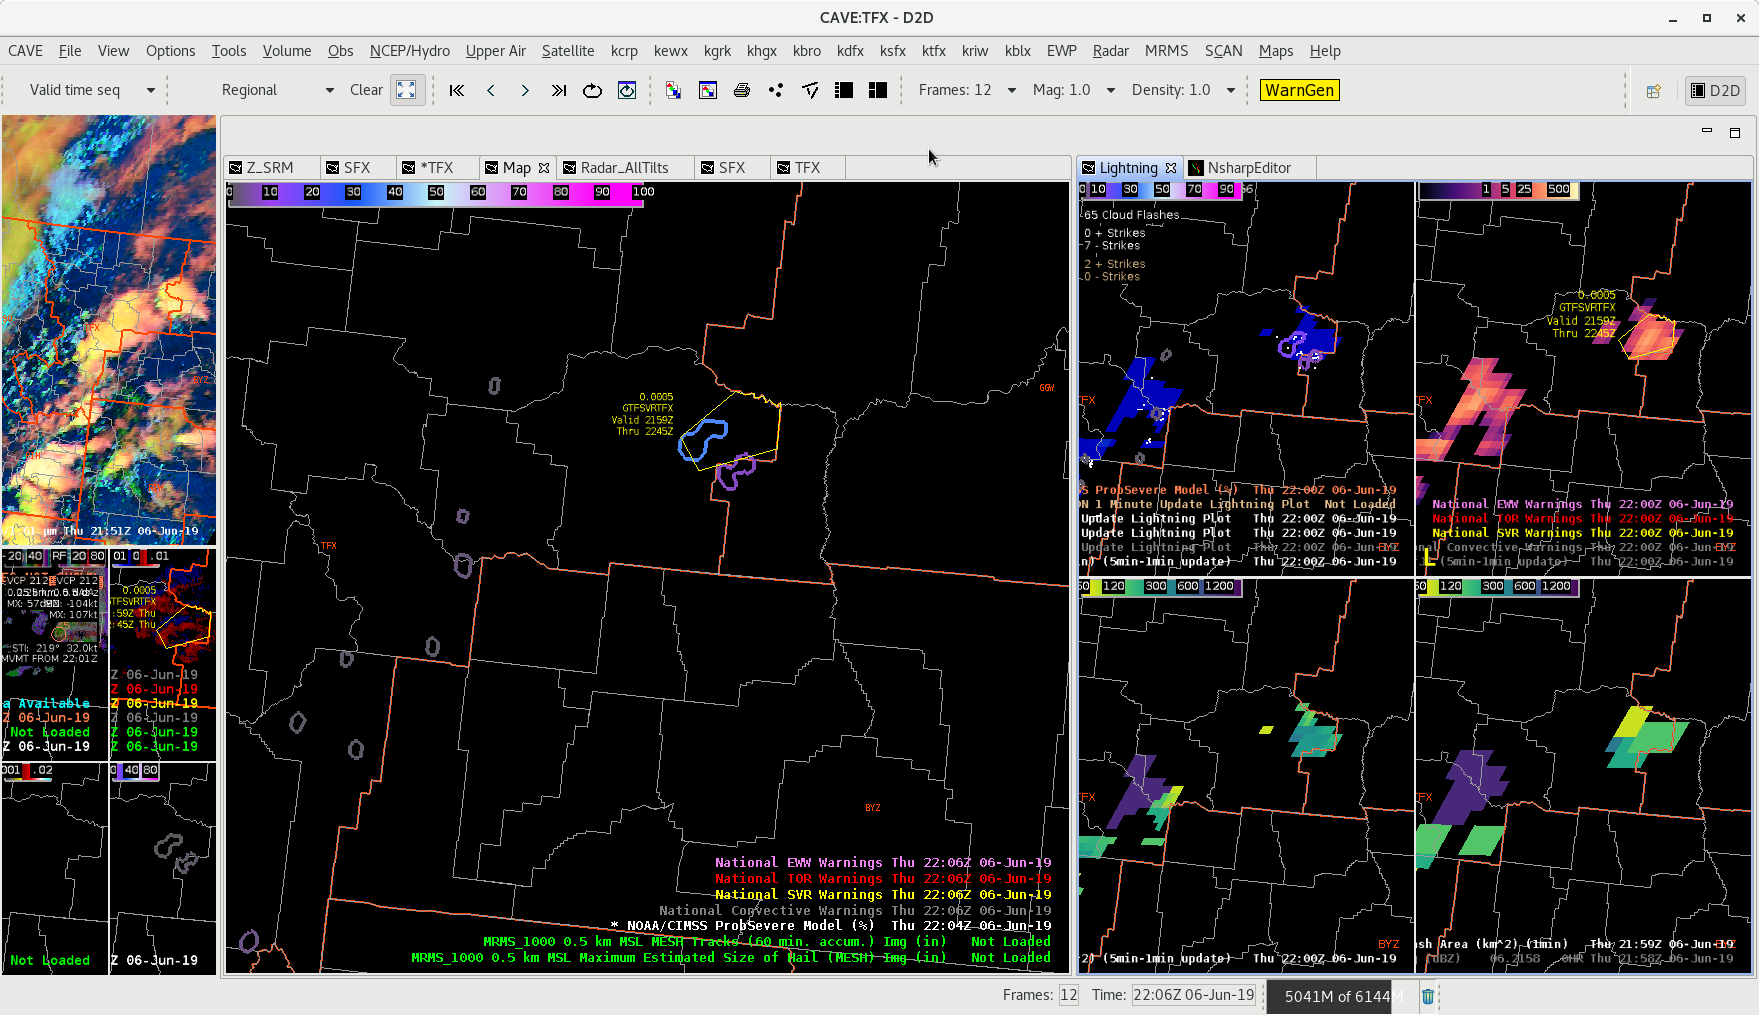
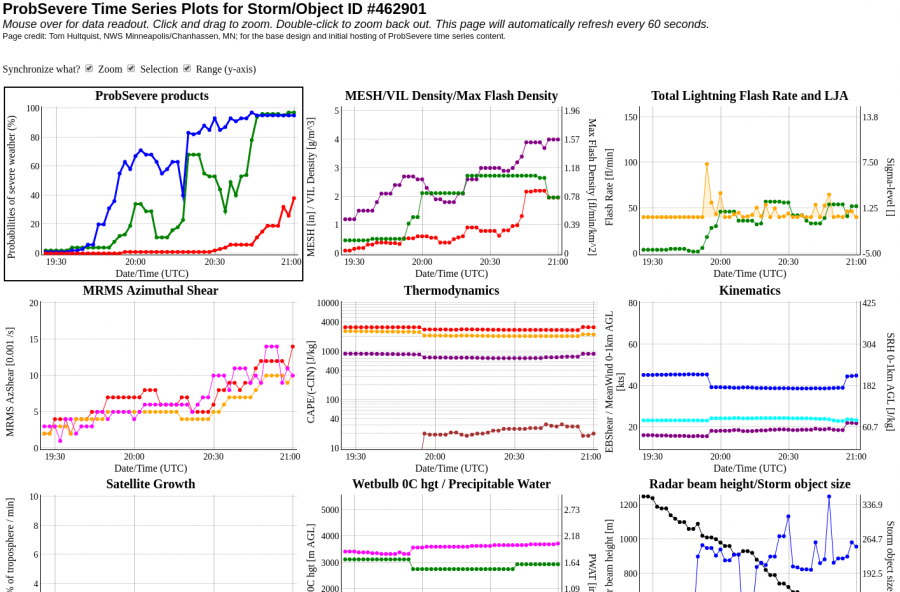
Closer to 2020-2030 UTC the rigor of convective elements increased and we started seeing transient echo overhang/along with some weak echo regions in tandem with an increase in both lightning activity as well as ProbSevere trends (especially ProbSevere3) as seen in Image 4. This increased our confidence in issuing our own warnings with LWX having a couple of warnings already issued.
Image 4: ProSevere Time Series just after 2000 UTC.Image 5: LWX 0.9 Reflectivity Image near 2000 UTCImage 6 and 7:(LEFT) ProbSevere Time Series around 20:30 UTC. (RIGHT) 4 Panel (from top left to bottom right) of Day Land Cloud Phase Distinction, Radar+GLM FED, Day Land Cloud Convection + TOE, ProbSevere3 + GLM MFA
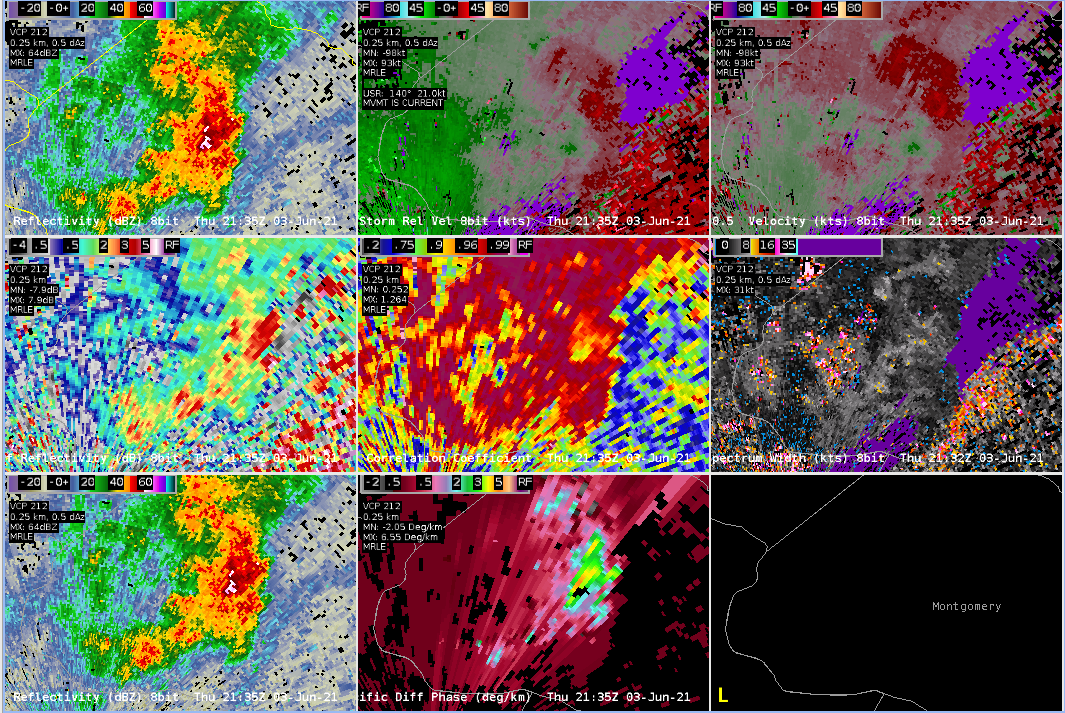
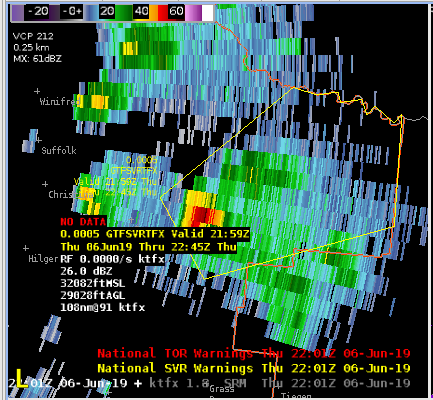
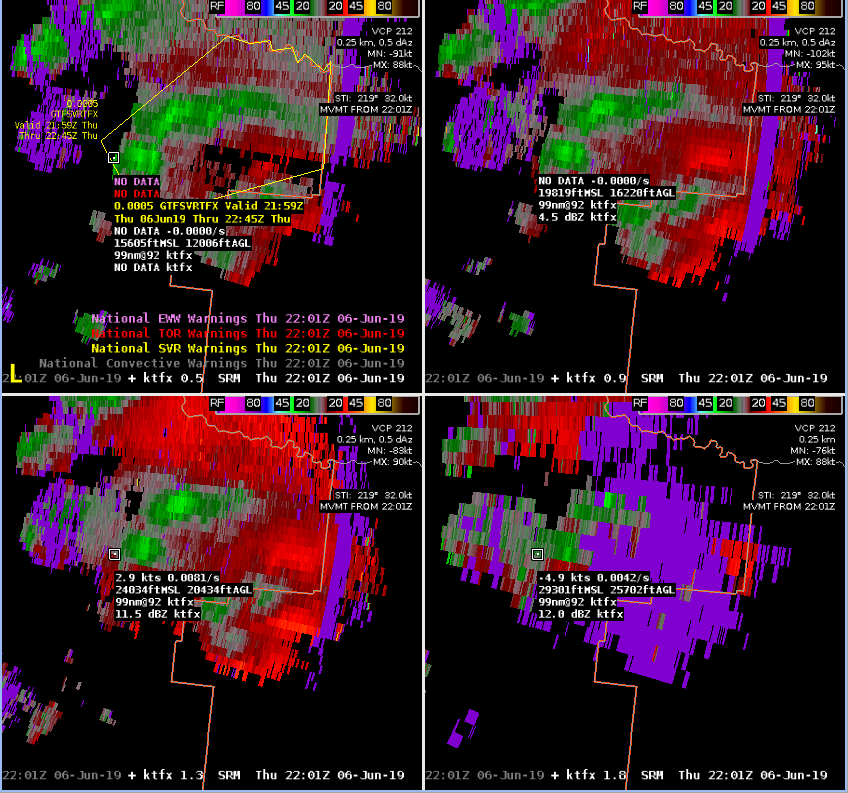
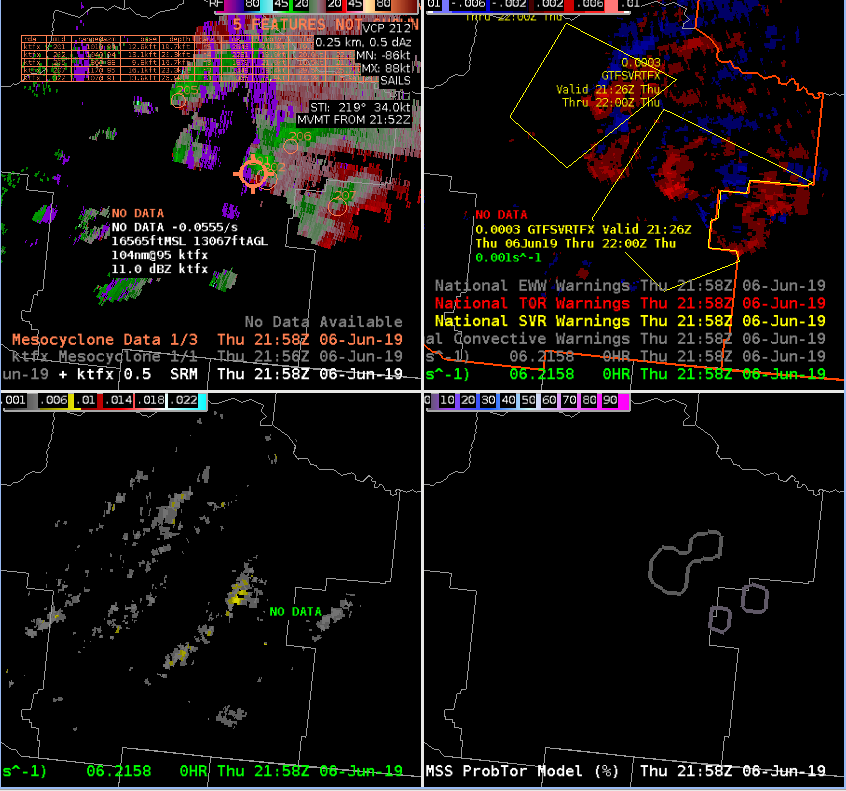
Closer to 21:50 UTC things became a bit more interesting from both a radar and lightning standpoint. Imagery from the KDOX radar (Central Delaware) suggested increasing mesocyclogenesis across Baltimore County (image 8) due north of Baltimore.
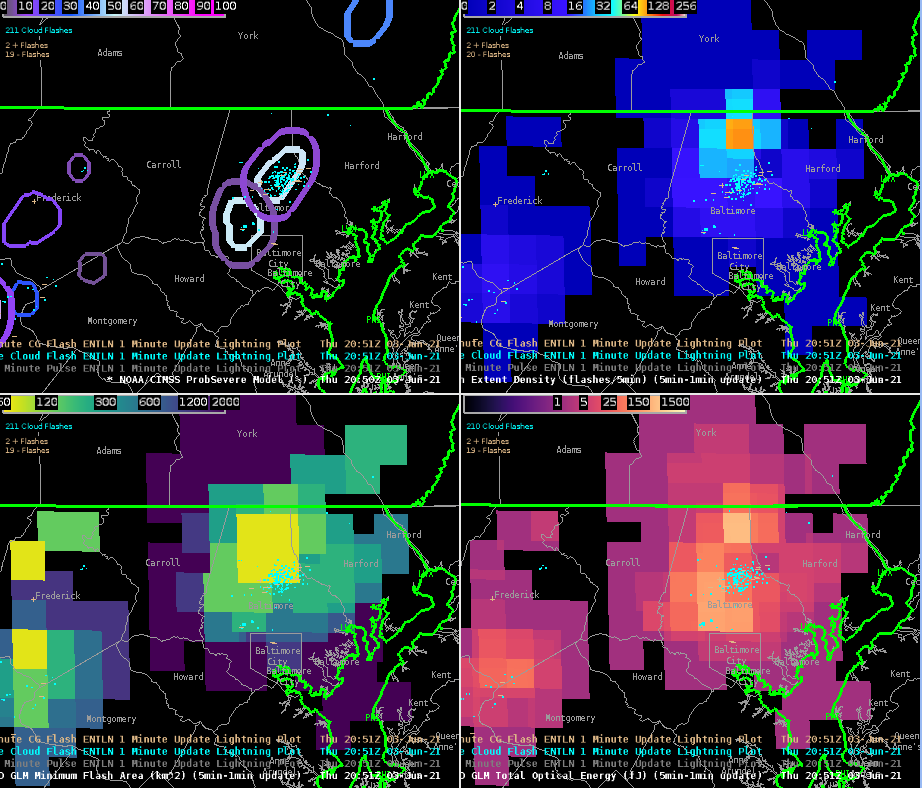
Image 8: 20:48Z 0.5 degree cut from KDOX indicating low level mesoscyclone.Image 9: 4 Panel of ProbSevere, GLM FED, GLM MFA, GLM TOE at 20:45 UTCImage10: 4 Panel of ProbSevere, GLM FED, GLM MFA, GLM TOE at 20:51 UTC
From a comparison of these images, there was certainly an indication that the updraft was increasing as FED magnitude increased from 51 flashes/5 min to 99 flashes/5 min. MFA also became more concentrated NW of the City of Baltimore and Baltimore County as seen in images 9 and 10. WFO LWX issued a Tornado Warning around 20:51 UTC.
An animation of the TDWR at Baltimore Washington Airport (image 11) had signs of a possible low-level RFD surge (not shown) in the 0.5 degree rapid scan tilt and increasing low level rotation consistent with either a stronger surge of straight line winds or a QLCS mesovortex/tornado. Aloft, (not shown) there did appear to be healthy reflectivity aloft and the concentrated MFA may suggest that a strengthening updraft.
Image 11: TBWI 0.5 Reflectivity and Velocity image at 20:50 UTC looking at tornado warned storm.
Image 11 from KDOX shows a loose mid-level mesocyclone with a gradual increase in ProbSevere3 with the time series. In this image, the storm was currently tornado warned by WFO LWX. At time we’d likely opt for a tornado possible warning and monitor very, very closely.
Image 12: 21:02 UTC Showing ProbSevere Time Series with KDOX 0.5 data (left panels) and GOES/GLM data (right panels) + ProbSevere
By 21:13Z The storm of interest is looking LESS favorable for tornado although prob severe tor increased significantly to closer to 20% perhaps due to an elongated zone of low level shear.
Image 13: 21:13Z KDOX Radar Imagery
Prob Severe Table Ideas: If the tables could open in a floating tab in Awips that would be very helpful. This way you can manually dock and move the tab around in awips. This way you can quickly view the tab and keep it open until you want to just close it. You can also rename the tab to whatever will help you keep track of the storm that it belongs to. This would get around needing to color code multiple tables etc.
A separate tab will also allow room to show additional information (beyond just prob severe).
Prob Severe jumped to nearly 80% with a fast moving bowing segment through Montgomery County.
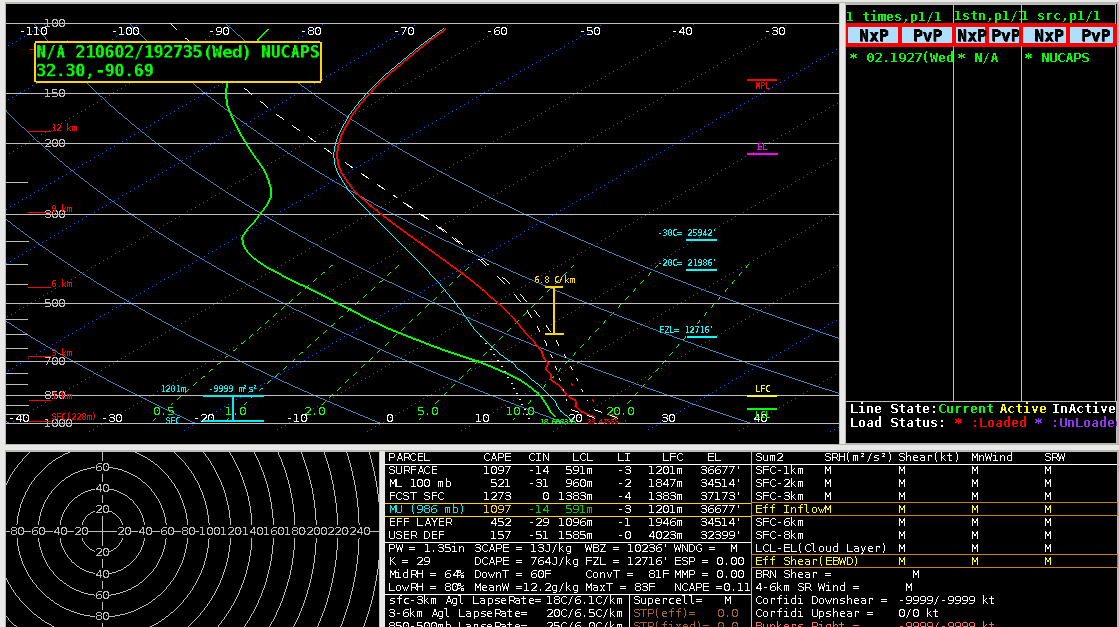
Looked at the modified NUCAPS sounding for and the low levels, below 700mb, were un representative (had an inversion when SPC mesoanalysis had no CINH), however the sky had roughly 80% cloud cover.
NUCAPS Base SoundingNUCAPS Modified Sounding, Same Location as Above
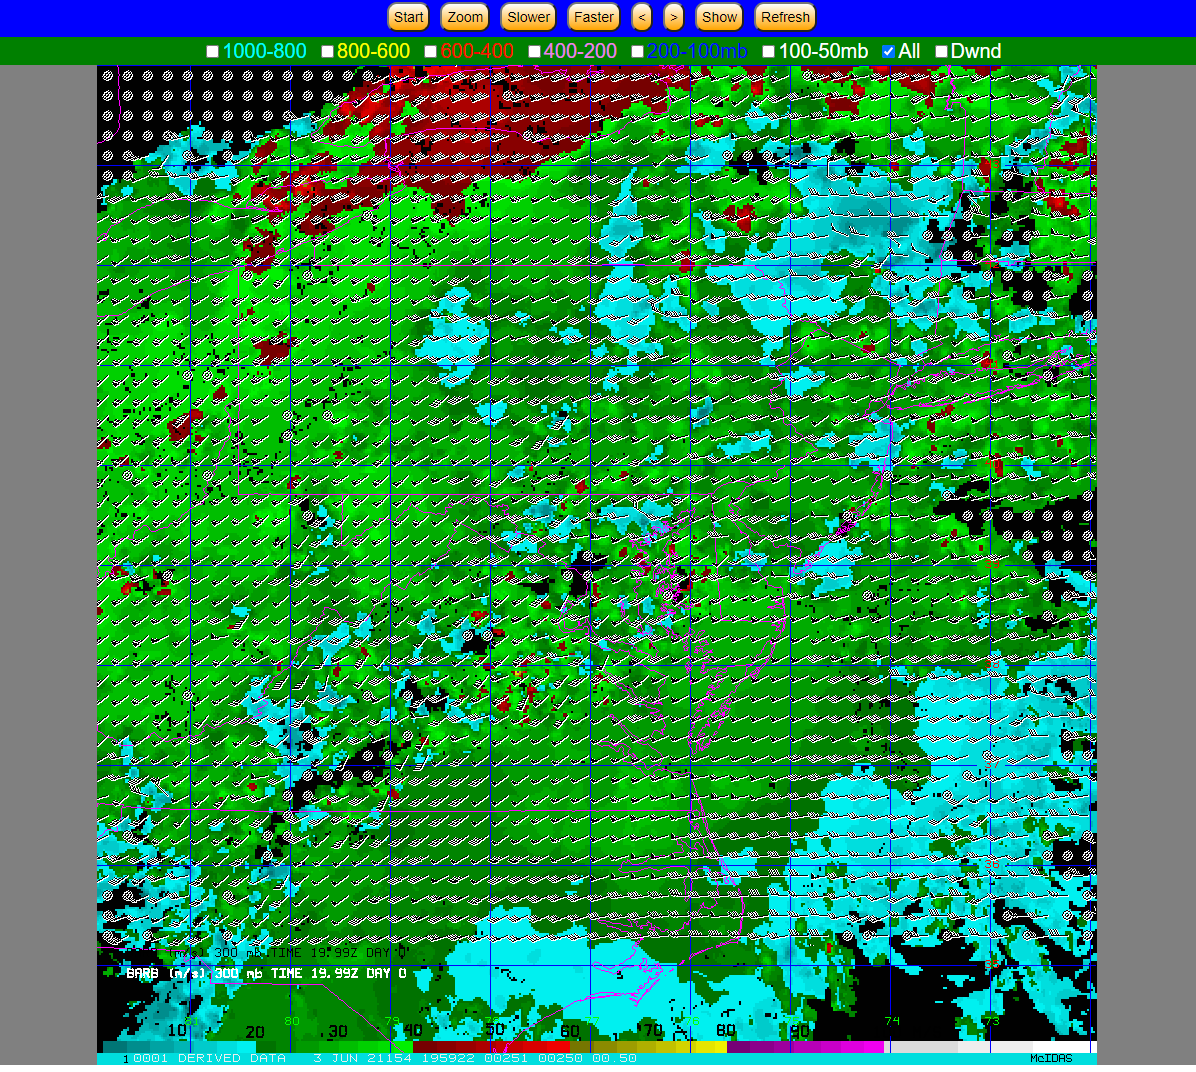
Looking at the NUCAPS forecast, the holes in the output field due to the cloud cover. The lack of data was in a bad location, preventing us from seeing the instability potential for a line of storms coming in from the west. The gridded format was actually better to use in this case as it helped fill in the gap.
Interpolated CAPE NUCAPS Imagery
The interpolated data is easier to visualize gradients in the variables, but our experience was that some important data was filtered out by having this turned on.
The time in the lower left is 19.99z. A key for the “all” field would be helpful to understand what I am looking at.
Having the CWA borders is handy, however having it as it’s own layer would be more helpful, and separating out the CWA borders from the state borders.
Can storm names be used to correlate the time series (F6, D3) and also have the names plotted in AWIPS for the storms I am looking at a time series of; would be more beneficial than having the lat/lon
-for example, click for a time series of one storm triggers a storm ID to show up in the time series and in AWIPS
-I click another storm and another time series shows up with the storm ID in the time series and in AWIPS allowing me to see which time series goes to which storm
If prob severe and its time series could be put into GR that would greatly improve DSS services when outside the office. The AWIPS thin client is sloooow, so being able to have the same ability, or similar ability to interrogate storms as in the office would greatly help improve the quality of DSS when deployed.
Prob severe version three continues to look more reasonable for severe wind than version two
Noticed an increasing 5 minute trend in the minimum flash area that was reflected in the FED about 5 minutes later. Seeing the sustained increase in one minute minimum flash area caused me to pay more attention to that storm than I did earlier due to the sustained growth
While monitoring a storm with FED and minimum flash area, the FED suddenly went down. The same trend was not seen in the minimum flash area as easily. Maybe the minimum flash area is more useful tool for monitoring the growth of storm while the FED is better suited for monitoring the overall trend in storm strength and sudden weakening.
Downward trends in FED for one of the storms matched what was being seen on satellite of the storm updraft becoming more ragged as it weakened due to entraining dry air.
-would be great to have lightning data such as FED plotted in a time series as well so trends are more easily seen
The stronger storm we were monitoring (same as in the screenshot below), prob severe version 3 was higher than version 2 for 15 minutes atleast. Looking closer this was due to the hail category being higher than version two; version three was also higher than version two in the wind category, but not nearly as much. Toward the end of our time version two was higher due to higher probabilities in the wind category. Interesting.
We monitored this particular cell on and off throughout the afternoon and tried to gain a better understanding of the minimum flash area. We noticed a close cluster of negative strikes, which really helped as a visual aide for what the GLM was seeing. The GLM MFA was able to isolate the core of the storm really well. We combined this with ProbSevere, and watched the probabilities on this storm increase which was a further confidence booster that the storm was intensifying in addition to what was seen by GLM and ENTLN.
Modified NUCAPS sounding appeared to have a better handle on the environment compared to baseline NUCAPS sounding. However, it also appears it might not be totally representative of the atmosphere given the partly cloudy conditions at the time RTMA data was pulled in. The SPC mesoanalysis page suggested MLCAPE upwards of 2500 J/kg in an uncapped environment. Using the gridded mid level lapse rate product from NUCAPS we found the data to be representative. It verified well with what was shown in the NUCAPS soundings and matched with the values suggested by the SPC Meso Analysis page.
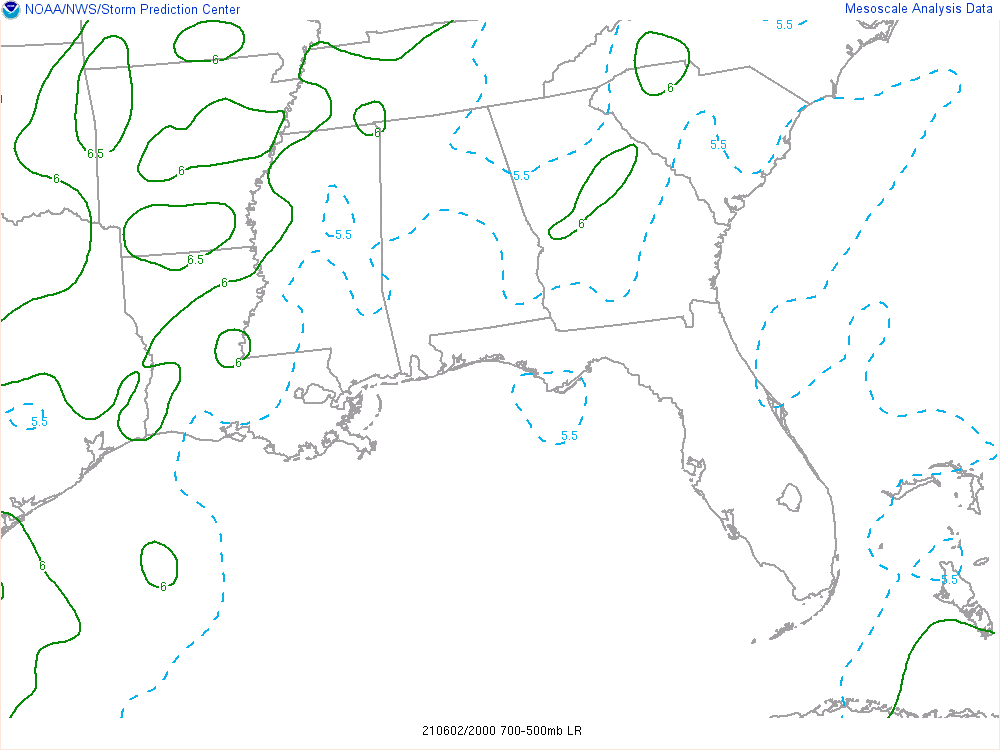
MODIFIED SOUNDING 1927UTC – WEST HINDS COUNTY, MS1927UTC BASELINE SOUNDING – WEST HINDS COUNTY, MS21UTC 700-500MB LAPSE RATES
The NUCAPS mid-level lapse rates were fairly representative when compared to the SPC mesoanalysis page. This was further evidence that large hail was probably not going to be in the cards for the Jackson area today, but marginally severe wind gusts would be something to watch.
16 UTC 700-500MB NUCAPS GRIDDED LAPSE RATES, SAMPLE NEAR THE SOUNDING DATA POINT
Prob Severe version 2 vs version 3, particularly in prob severe wind:
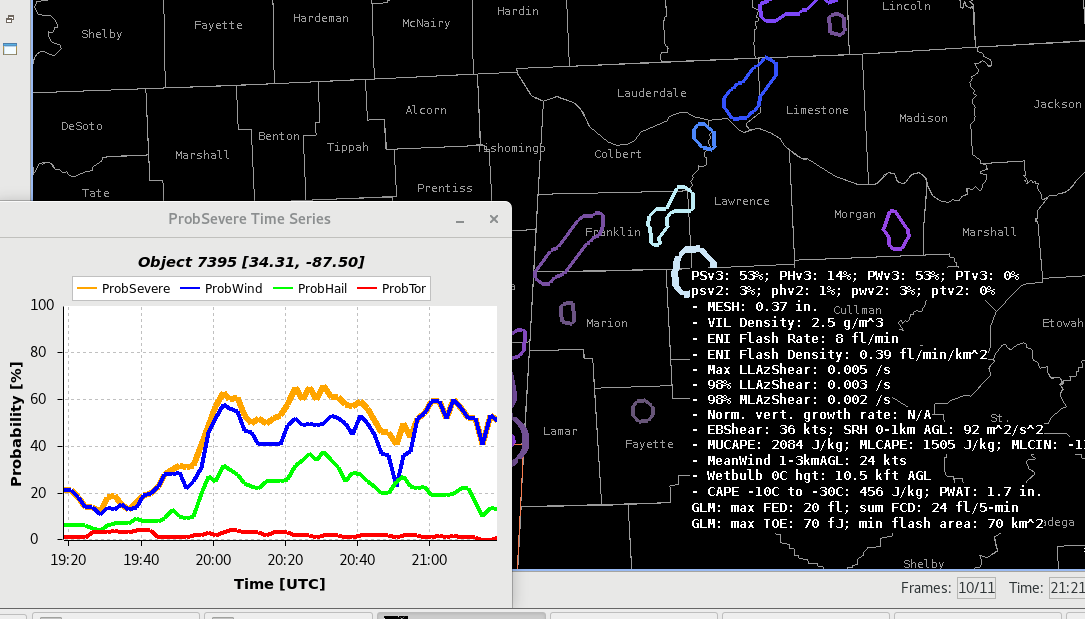
In this event, the prob severe there was a sig wx statement and severe thunderstorm warning put out by the Huntsville office. Around that time, the prob severe was increased specifically for the prob severe wind component. The version 2 had a prob severe value of 3% while the version 3 had a 53%. Version 3 better captured the significance of the storm with a 40 mph gust reported around the same time. This is significant since we were also discussing how filtering lower prob severe thresholds would be useful in decluttering the operational screen. We could have missed this event if that was the case (with version 2).
Based on this experience, we can see the vast improvement in the wind component of prob severe version 3.
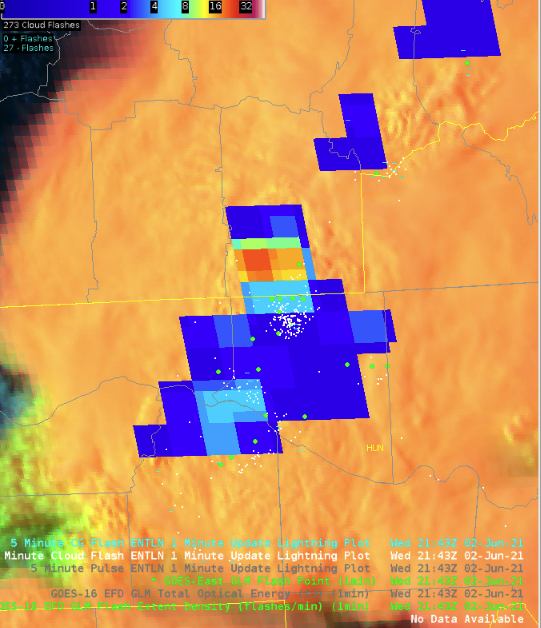
21:16 UTC ProbSevere Sample (note V2 versus V3 differences in sample).Local Storm Report of a measured 41mph wind gust in Colbert County AL, just north of the contoured ProbSevere storm.1 Minute FED overlaid with ENTLN 5 minute (1 minute update) and GM Flash Point
GLM Observation:
Saw a steady lightning jump depicted in the GLM FED correlated with a storm that NWS Huntsville issued a Severe Thunderstorm Warning on. Several mPING reports of wind damage (assuming sub-severe with no LSRs issued as of this time) which raises confidence that storms are intensifying. Perhaps the most interesting thing about this screenshot is seeing the parallax-correction in action when looking at the Flash Points.
Optical Wind:
Still difficult to tell where you are geographically. Suggestions to perhaps swap the lime green grid with the state outline colors.
Additionally, the time stamp gets cut off if you zoom in on the product and occasionally gets covered by the wind barbs themselves. Perhaps a floating time stamp would be better for this instance.
Time stamp for the image above.
A note about the timestamps:
The time stamps attached to the wind barbs appear to be formatted incorrectly, showing times like 21.97Z, note the actual time correctly formatted shown in the image below was actually 21:58Z.
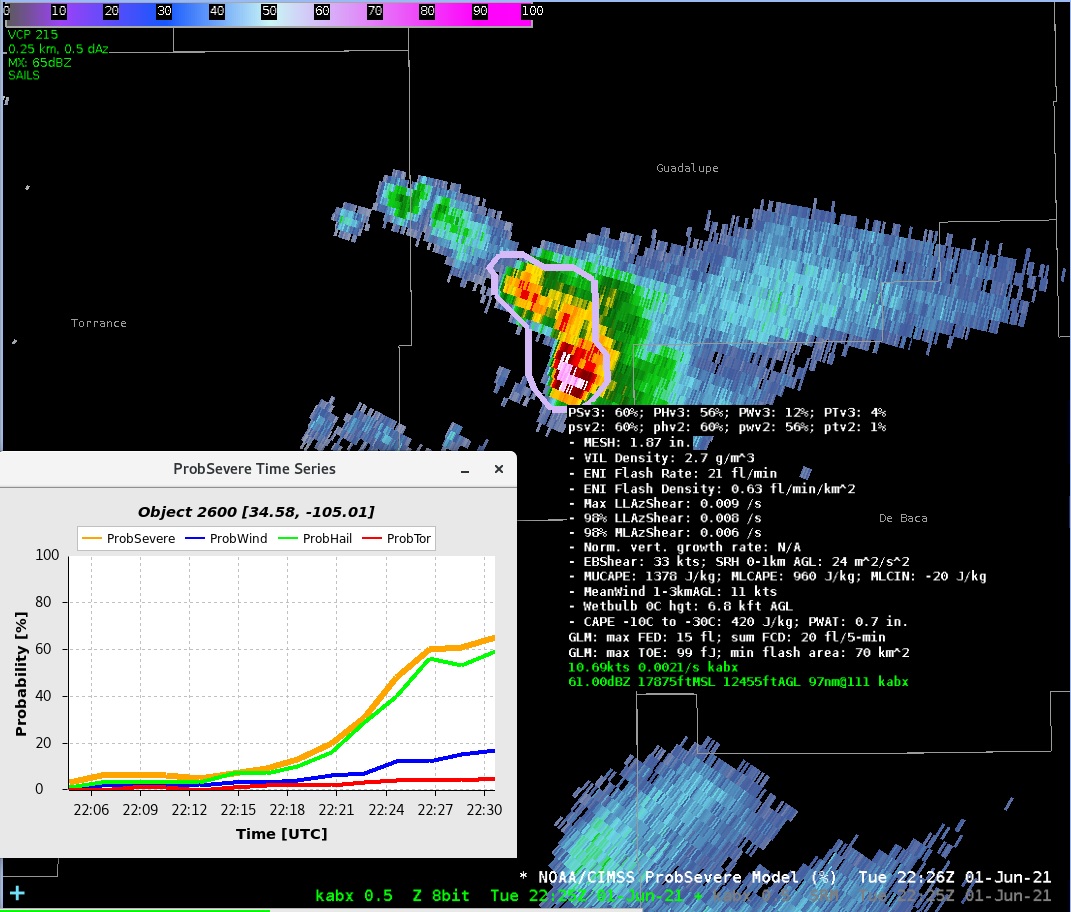
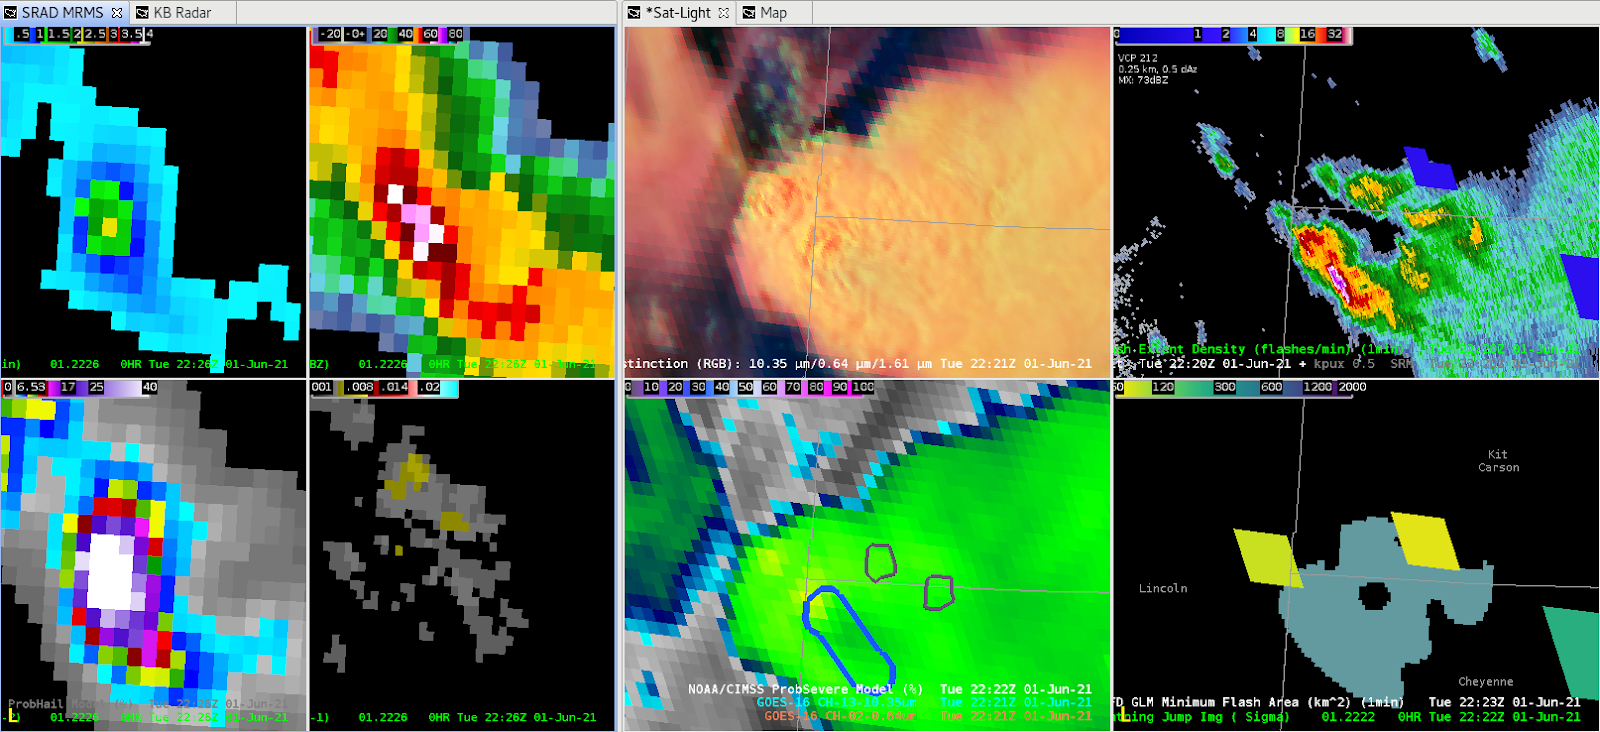
Radar imagery showed a storm form and rapidly strengthen over Guadalupe County, NM. ProbSevere matched this intensity increase well. The storm looked like it was going to become severe. ProbSevere jumped to 60% at 2226Z, which was about a 40% increase in about 5 minutes. Surprisingly, the 60% value was the same for ProbSevere Versions 2 and 3. The modelers mentioned that Version 3 has lower values than what forecasters are used to seeing in Version 2. Therefore, a 60% value for Version 3 is probably a higher threat than an identical value for Version 2. That gave me more confidence considering this storm severe.
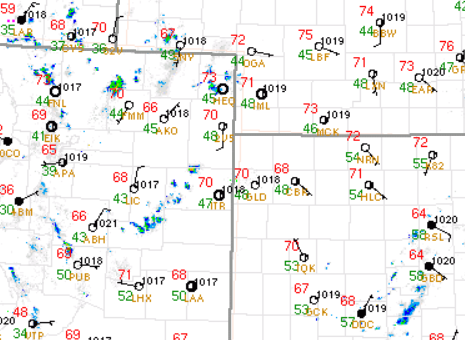
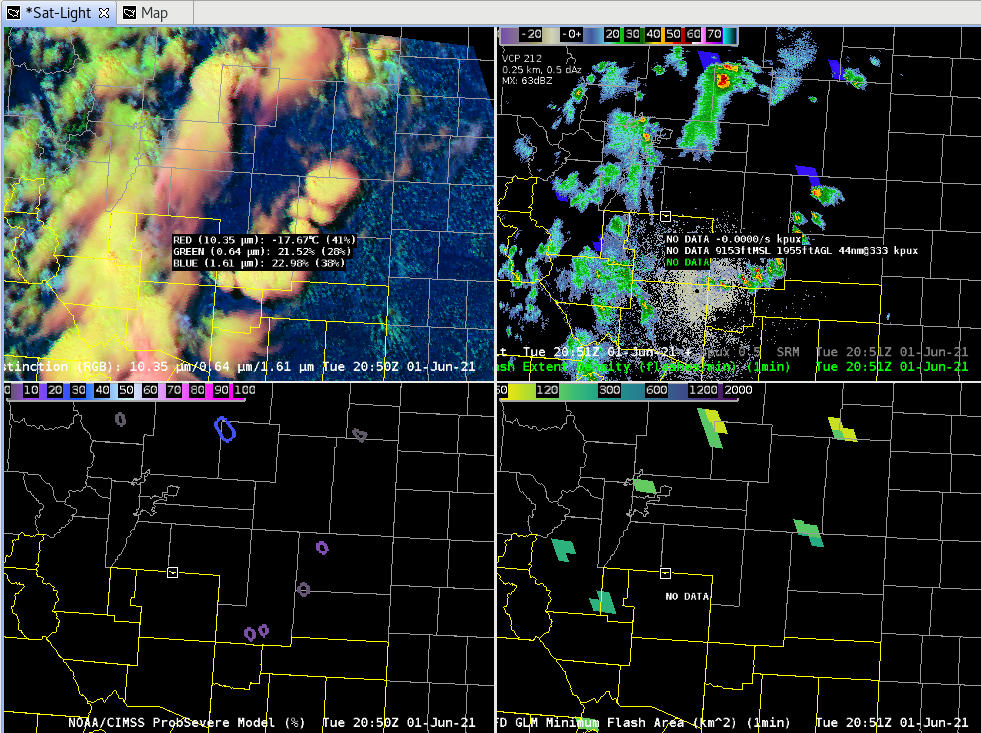
Looking at a surface map there looks to be a boundary, possibly a weak warm front, over E CO that storms are firing off of. A similar feature can also be seen in the satellite data taken at the same time.
Lightning:
The FED did not give as much information about the growth stage of the updrafts as the flash minimum area did. Also noticed the VII trend resembled a similar trend as the flash minimum area did.
The flash minimum area is also a good way to help catch the eye of what updrafts are strengthening, especially if the trend of low flash minimums persists. Great tool to use at first glance of which storms need to be watched and which don’t.
-Dwight Schrute and Accas
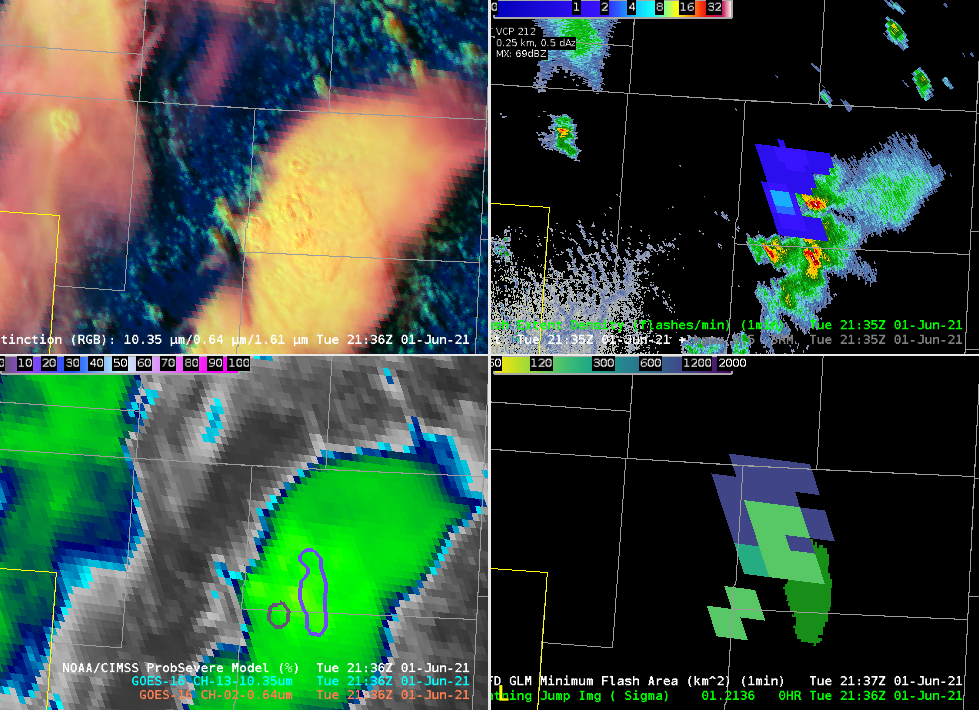
Saw several examples of the flash density for lightning either muting out or not showing the trend the flash minimum area was showing. In the past I have been using the flash minimum area to help me see trends in the lightning, but am now seeing that I should be using the flash minimum area instead if I want to see trends in lightning activity. I use the lightning trends to help me know if the storm is rapidly intensifying or suddenly weakening and possibly about to generate a severe downdraft. Being able to see these sorts of trends better can also help communicate a potential threat for storm intensification or severe wind development to those in the path of the storm.
-Accas
Area of coverage greater for the minimum flash vs extent density.
MRMS and Satellite indicating glaciation (the small updraft in the center of the satellite picture). Lightning expected, but only seen potentially with the minimum flash area product and not with the flash extent density product. Until one scan later (shown below).
Next time stamp, we can see increased minimum flash area lightning over the new updraft and a pixel from the flash extent density. So the minimum flash area would likely be the best bet for using the tool with decision support services in mind due to its higher sensitivity.
-Dwight Schrute
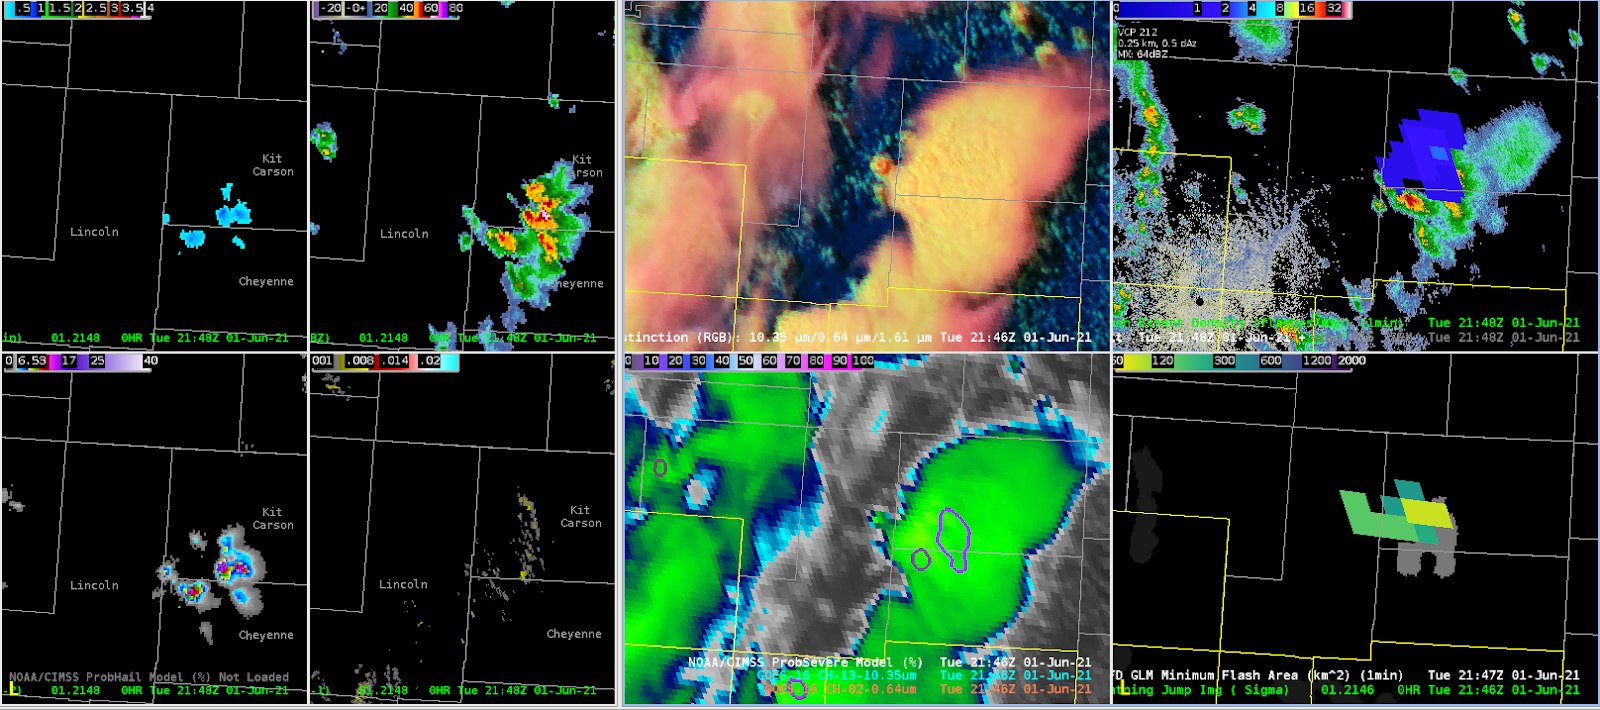
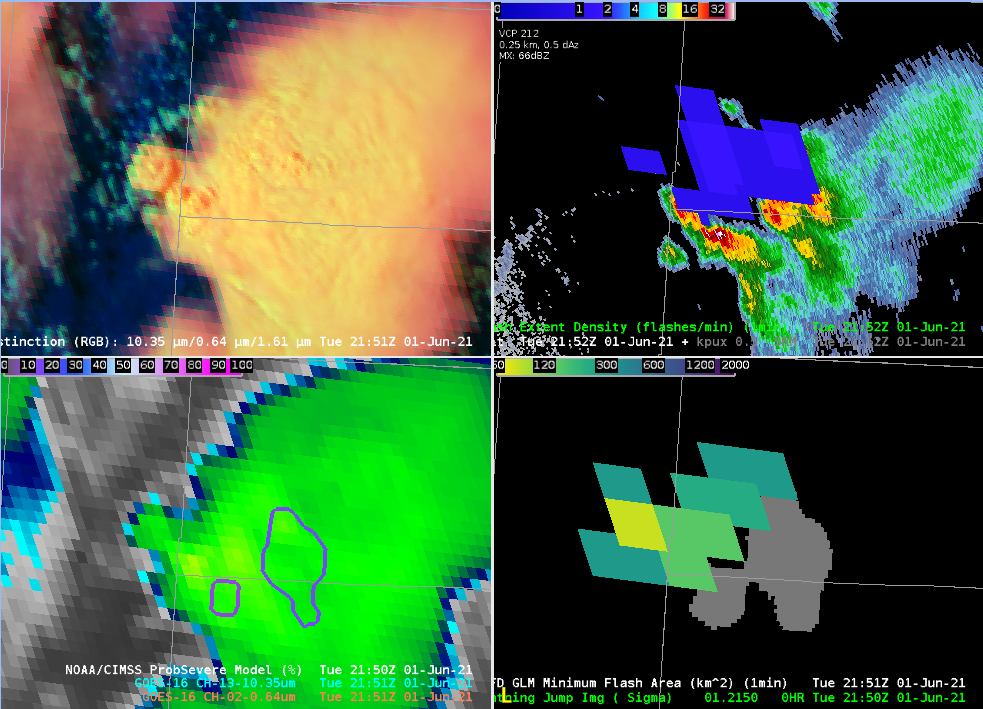
This was a scenario where we were baffled by how little lightning was being shown from both the minimum flash area and flash extent density products. We asked why so little lightning compared to how much ice is in the storm, combined with MESH indicating a 2” hail stone. The lightning with this maturing storm was not being sampled well.
Continuing the SVR downstream, as yet another strong core pops up. Colder cloud on IR and now prob severe is starting to jump up. Blue color showing ProbHail and ProbWind in the 30s.
Cell also showing more signs of organization in the SRM…better chances for hail.
Also getting a pickup from the DMD (latency issue still for NMDA).
Had an interesting opportunity to watch a quickly intensifying cell relatively close to the radar. While ProbHail did a decent job monitoring the trend in this cell, its (2 to 4 minute) latency in an environment conducive of rapidly intensifying cell could possibly lead to a reduction in Lead Time. By monitoring the cell via All-Tilts BR/BV/CC/ZDR and GOES-East Satellite Imagery via Mesosector, I was able to get roughly 5 additional minutes of lead time on my warning (ProbHail was less than 45% by warning issuance). A good reminder as to how the ProbSevere suite is best utilized as an additional tool, and not necessarily the deciding factor in warning ops, especially in freshly forming cells.
Quick update: The earlier warning did verify with quarter-sized hail. I did find some utility with the ProbHail when it came to making the decision to re-issue the warning or not, especially as the storm began to near the “cone of silence.” Accessing the time series which continued to show >95% ProbHail and a quick glance at a neighboring radar, I had enough forecasting confidence to continue the warning downstream.
Across the EWX CWA, we’ve had a number of splitting cells. The gif below includes 0.5 reflectivity with MESH & ProbSevere overlaid. As the cell begins to widen north-south, both MESH and the ProbSevere polygon elongate and split.