
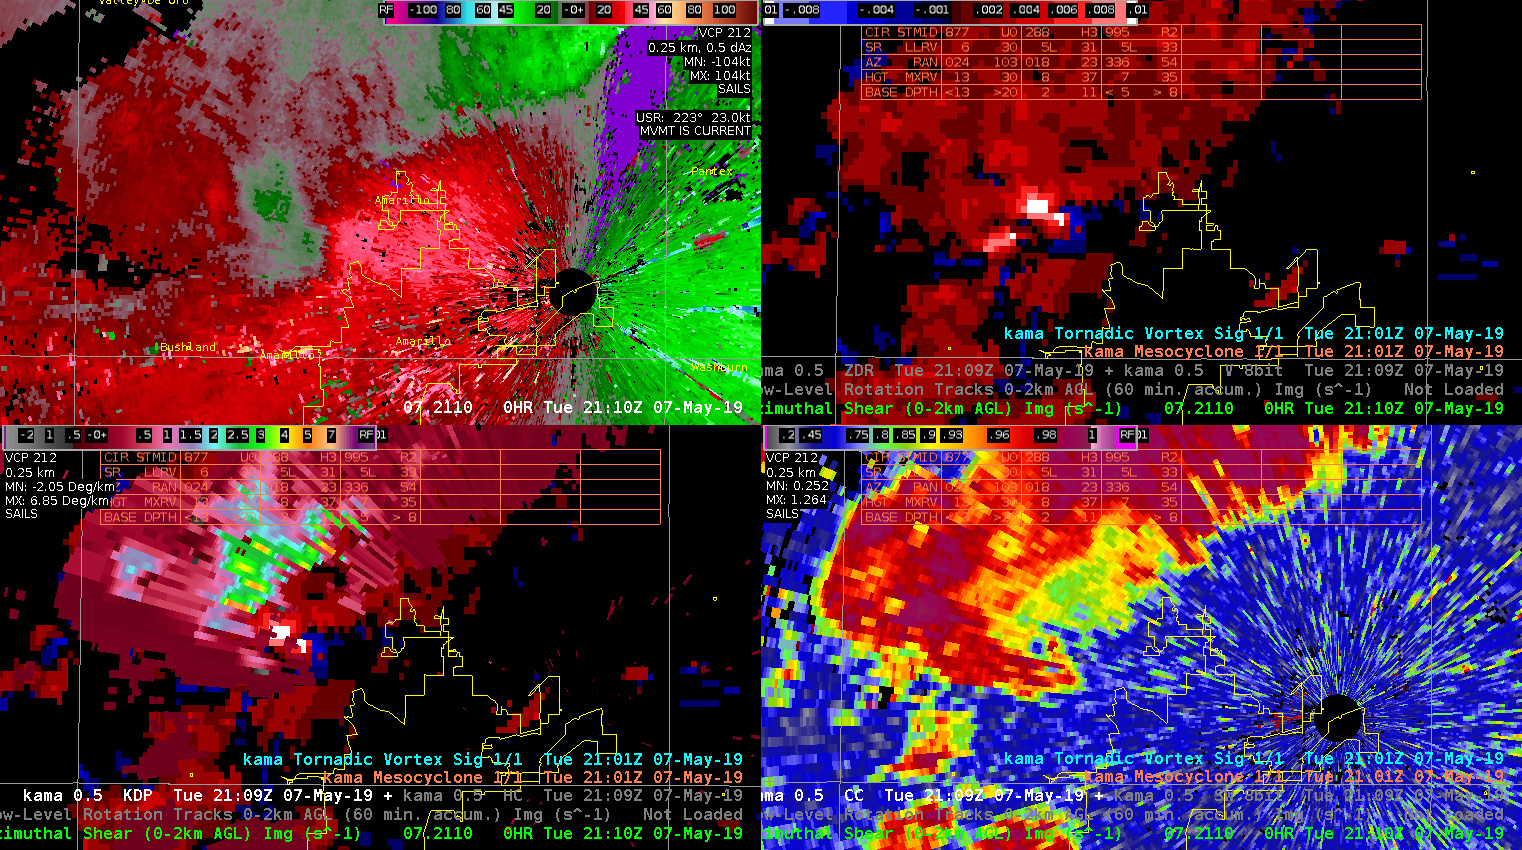
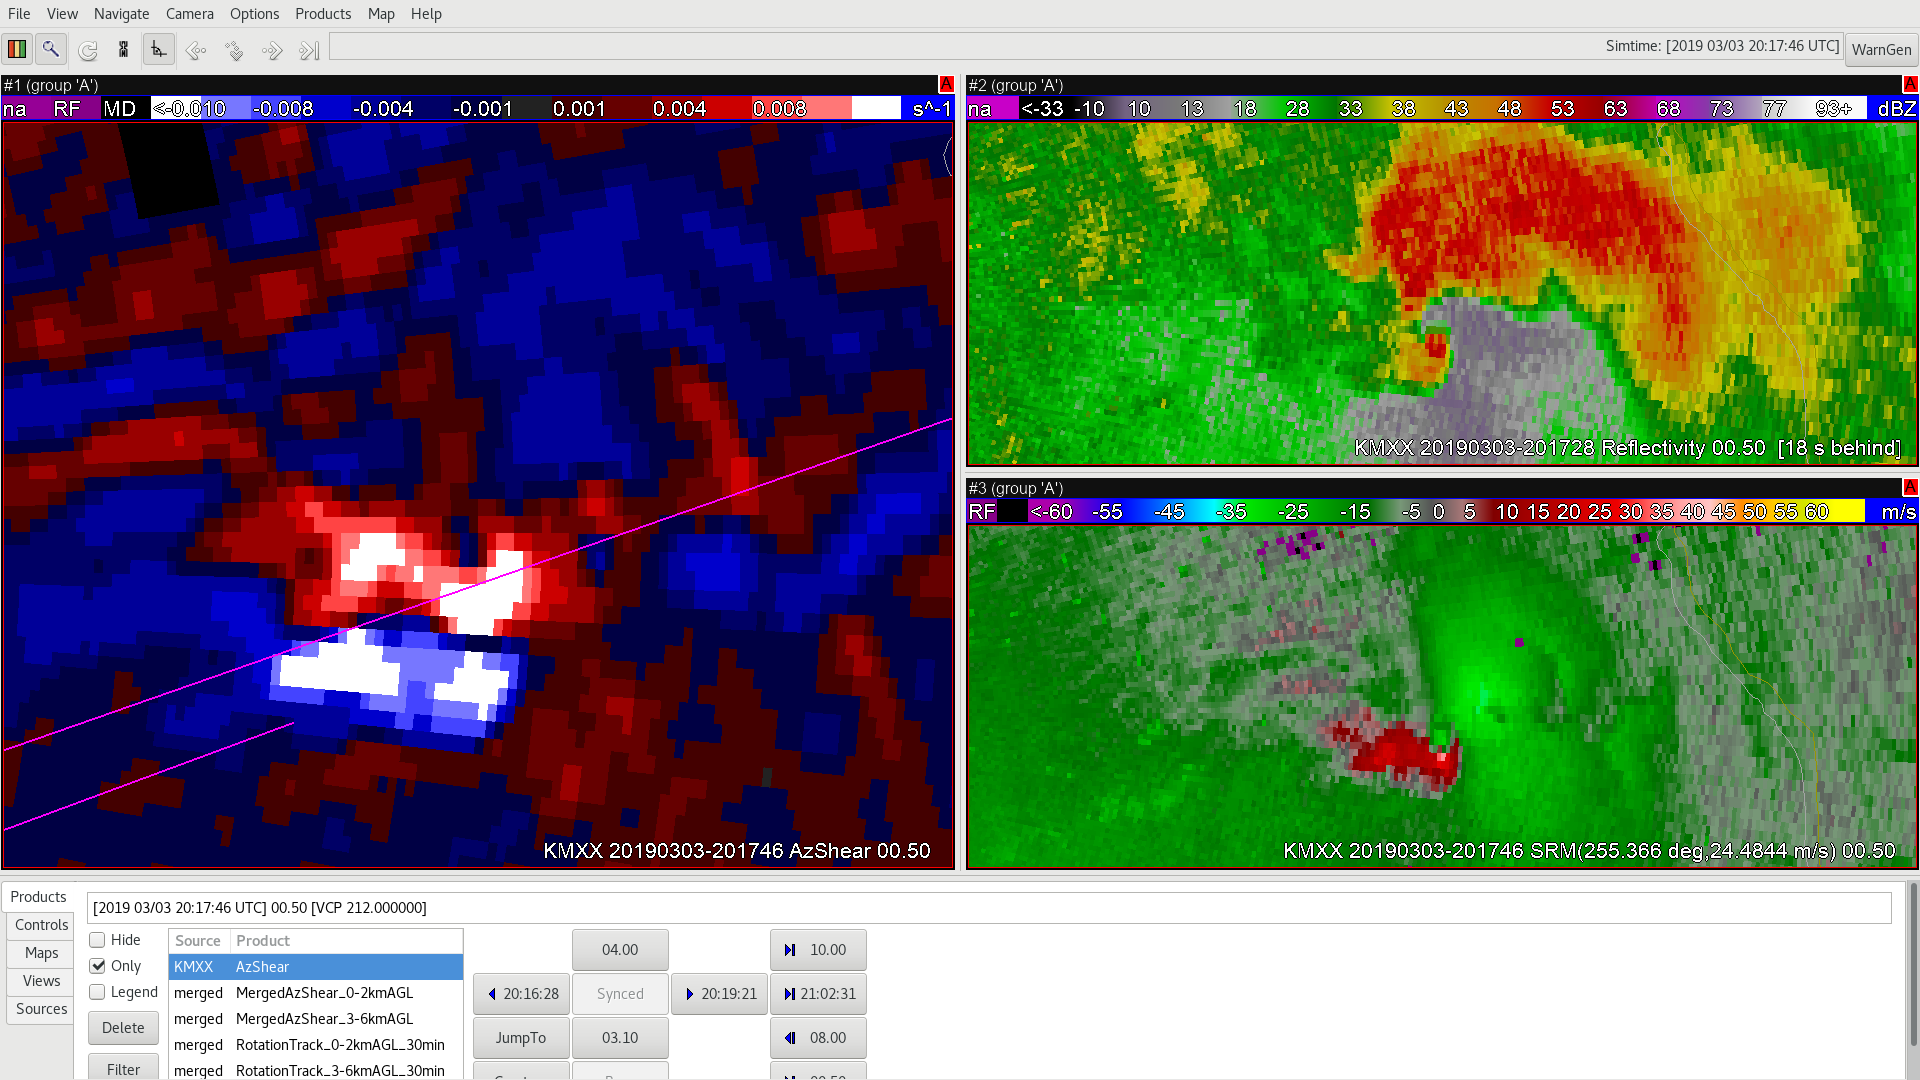
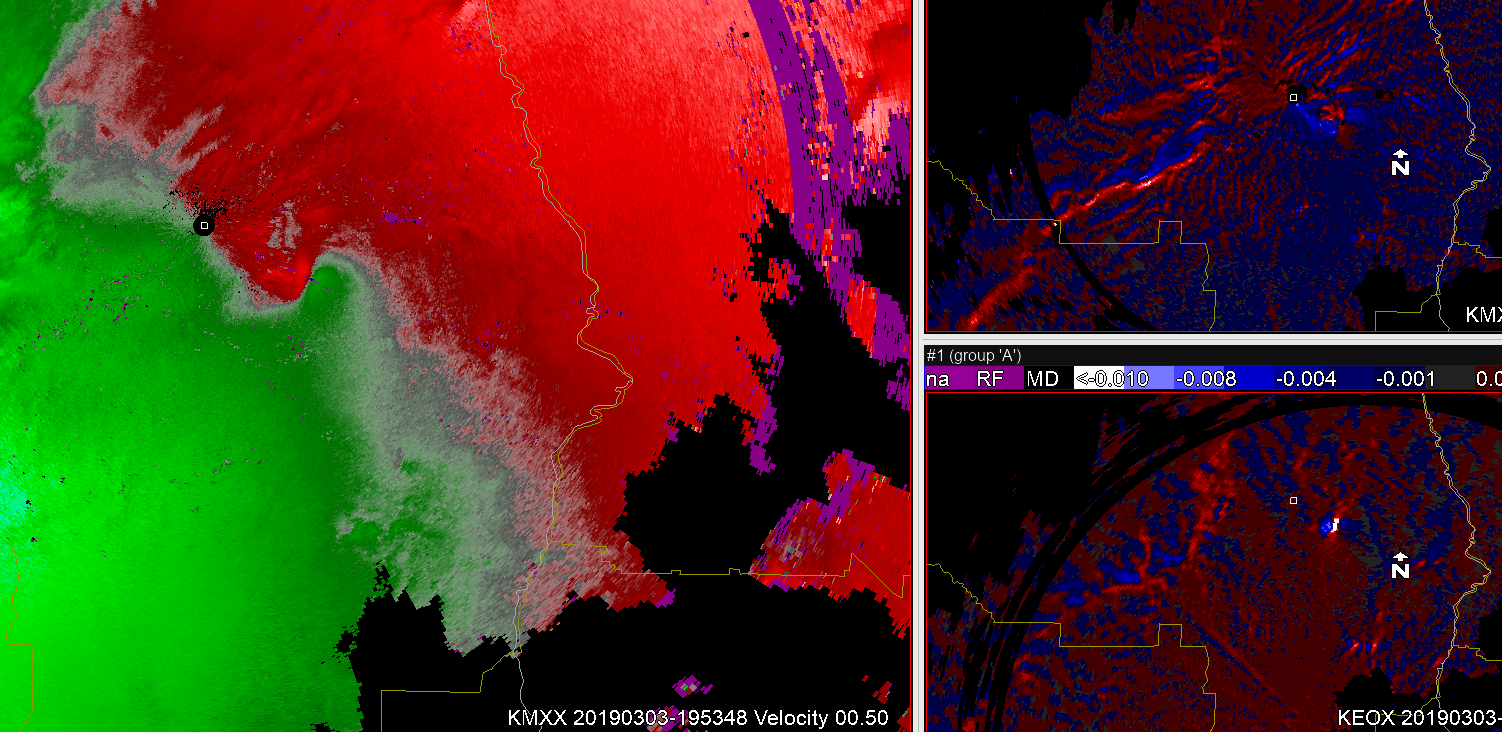
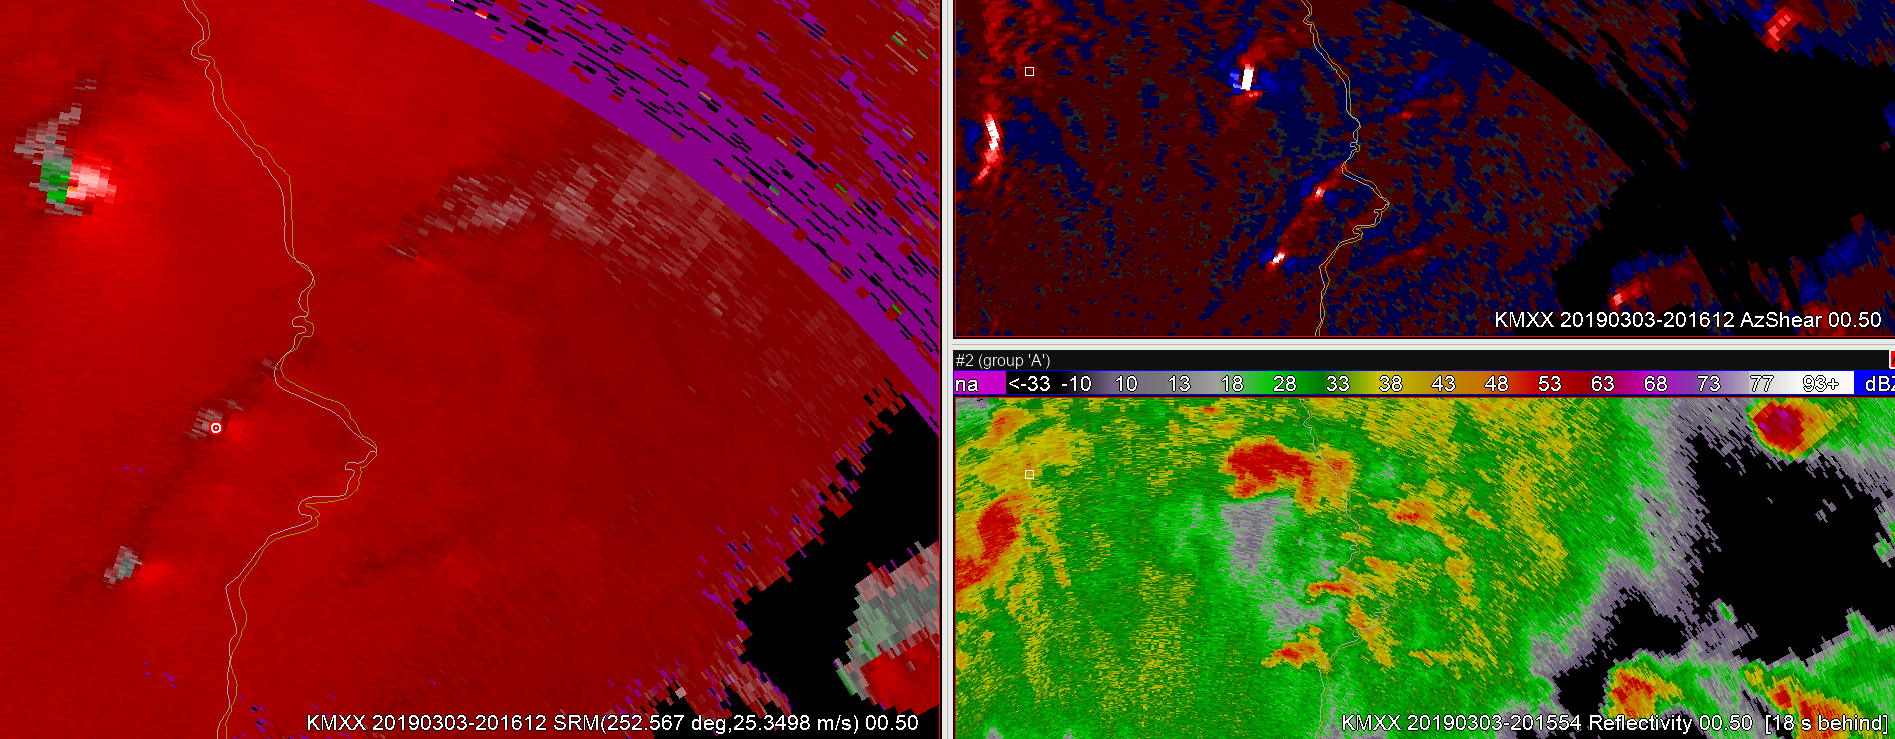
Merged AZShear picking up on the low-level rotation nicely!
(Don’t know why images are being weird here)
#ProtectAndDissipate
Official websites use .gov
A
.gov website belongs to an official government
organization in the United States.
Secure .gov websites use HTTPS
A
lock (
) or https:// means you’ve safely connected to
the .gov website. Share sensitive information only on official,
secure websites.

Merged AZShear picking up on the low-level rotation nicely!
(Don’t know why images are being weird here)
#ProtectAndDissipate
Issued TOR warning with this imagery and supplemental storm chase video showing lowering base and RFD.
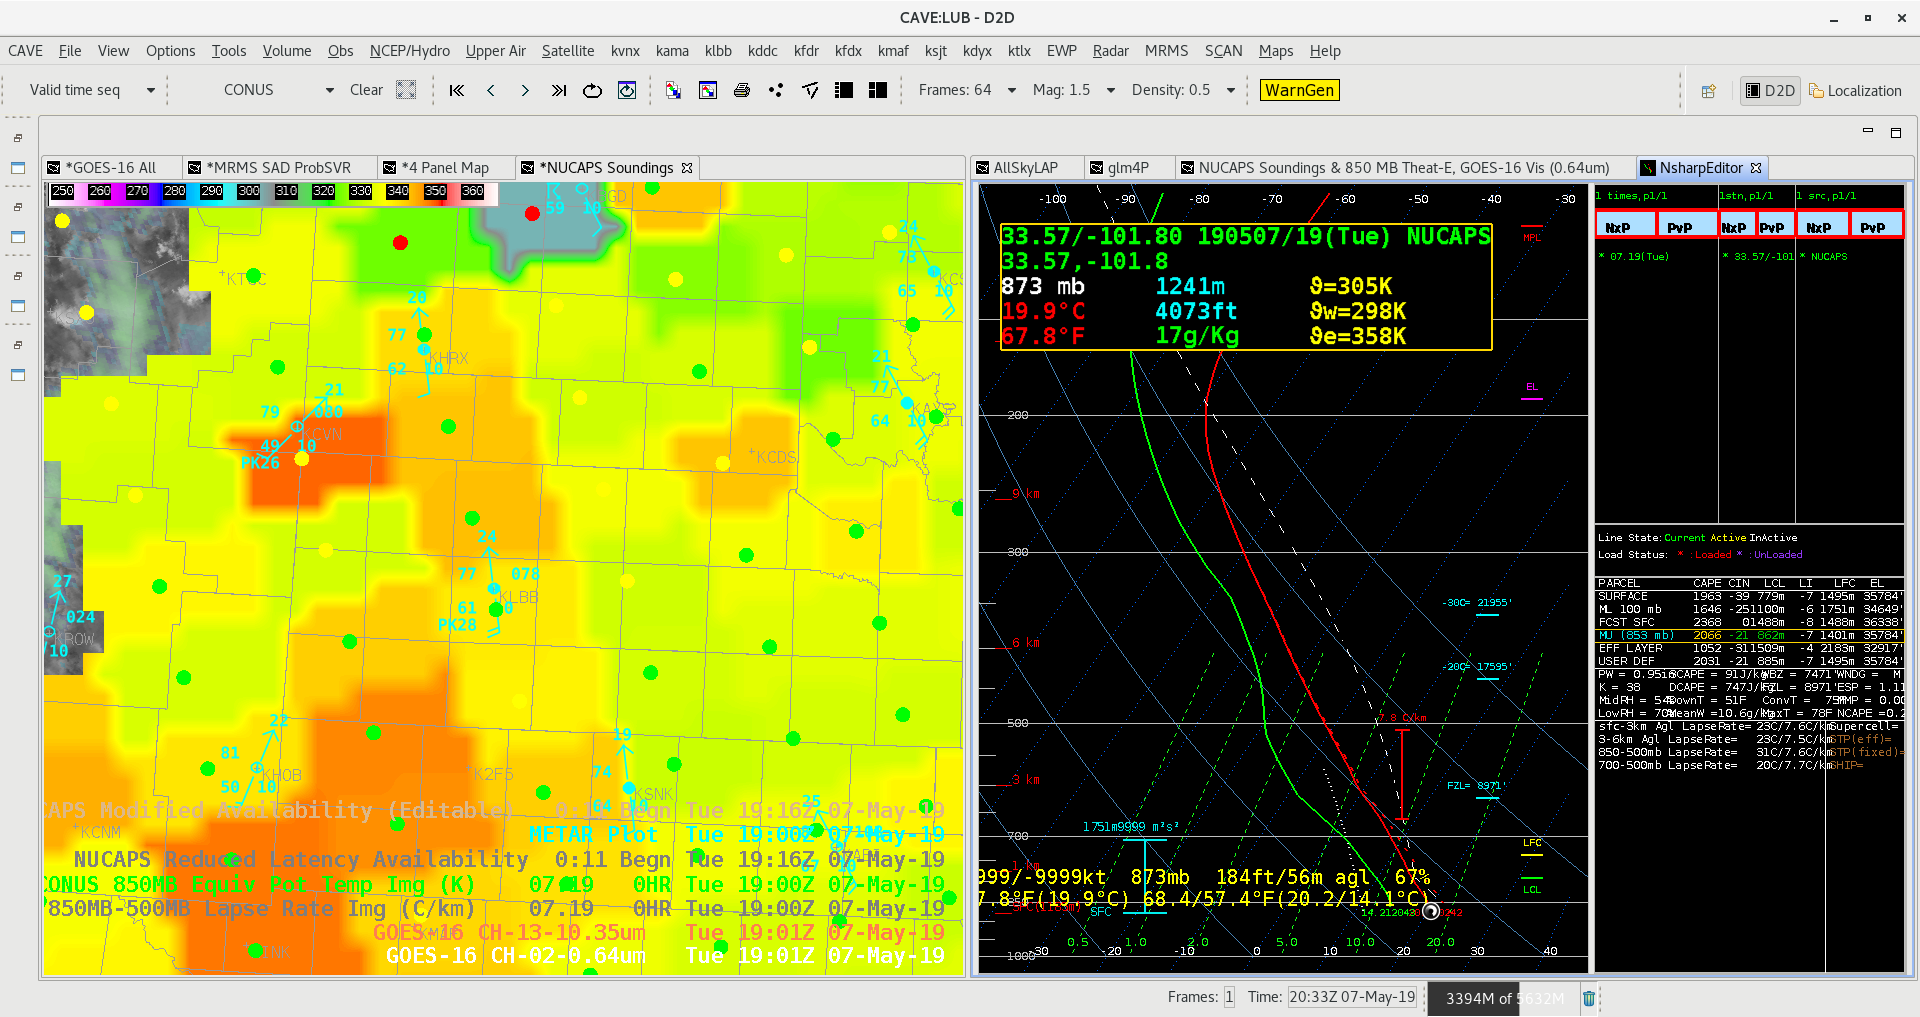
Modified NUCAPS soundings taken at 19Z became available in AWIPS and was noticed around 2030 UTC. The One taken near Lubbock was flagged as a Successful. I wanted to compare the NUCAPS sounding withe the nearby 19Z METAR observation and found the METAR measured temp/dew observations of 77/61 where the NUCAPS sounding at the same time had surface measurement of 69/58. The difference between the surface temperature observations for a modified sounding was concerning.
#ProtectAndDissipate
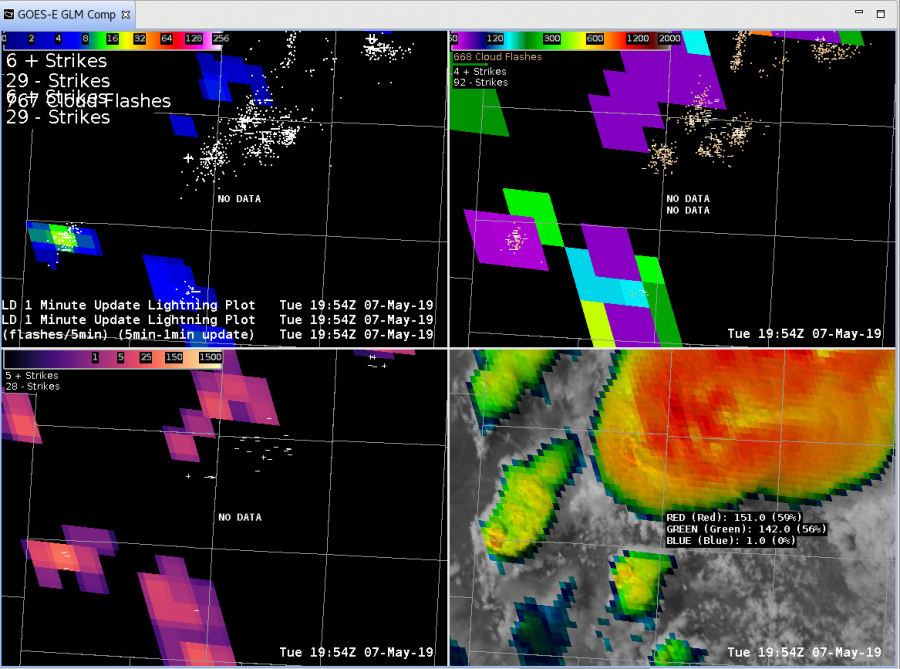
Everything was chugging along great with the GLM and the storms around Amarillo this afternoon as this image from 19:54 shows (TL – Flash Extent Density 5-minute w/ 1-minute update with Vaisala GLD Data overlayed, TR – Minimum Flash Area with ENI Total Lightning overlayed, BL – Total Optical Energy with Vaisala NLDN overlayed, BR – IR/VIS Sandwich):
But then the next set of data arrives at 19:55:
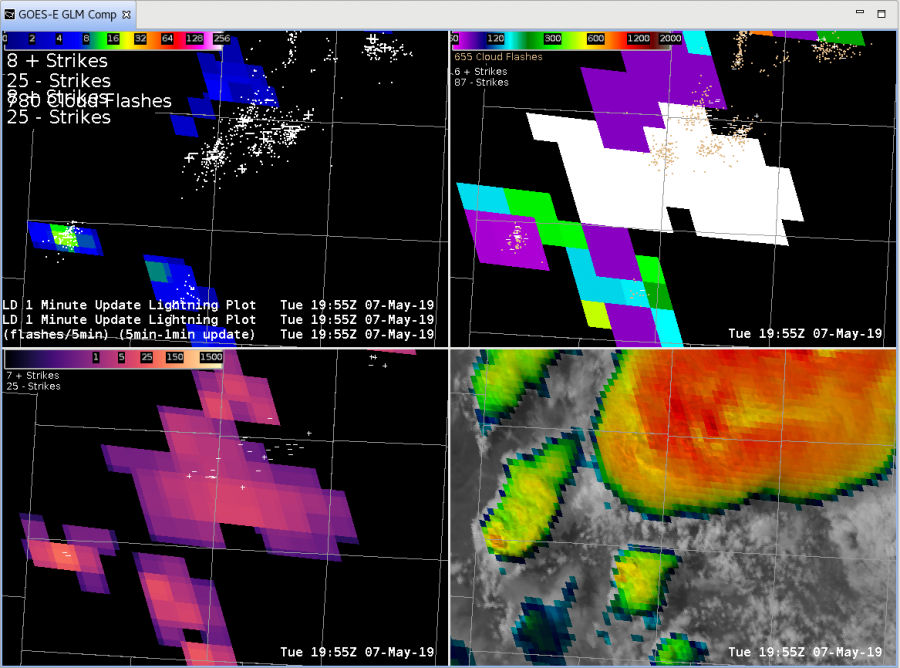
So, that big white area showed up which is a 2918 km2 area flash. WOW. THAT. IS. HUGE. But the question now becomes is that correct or not? Taking into account parallax and the data from the ground-based networks shows that there was electrical activity in the general area. However, it isn’t in the area that would line up with the parallax; the ground-based network data should be closer to the southeastern area of the flash. Also of interest is that there is no Flash Extent Density associated with the large flash but there is an associated area of Total Optical Energy.
One thing we are tossing around here is the possibility of a cloud reflection; here is the 1-minute visible mesoscale scan with the big flashes overlayed:
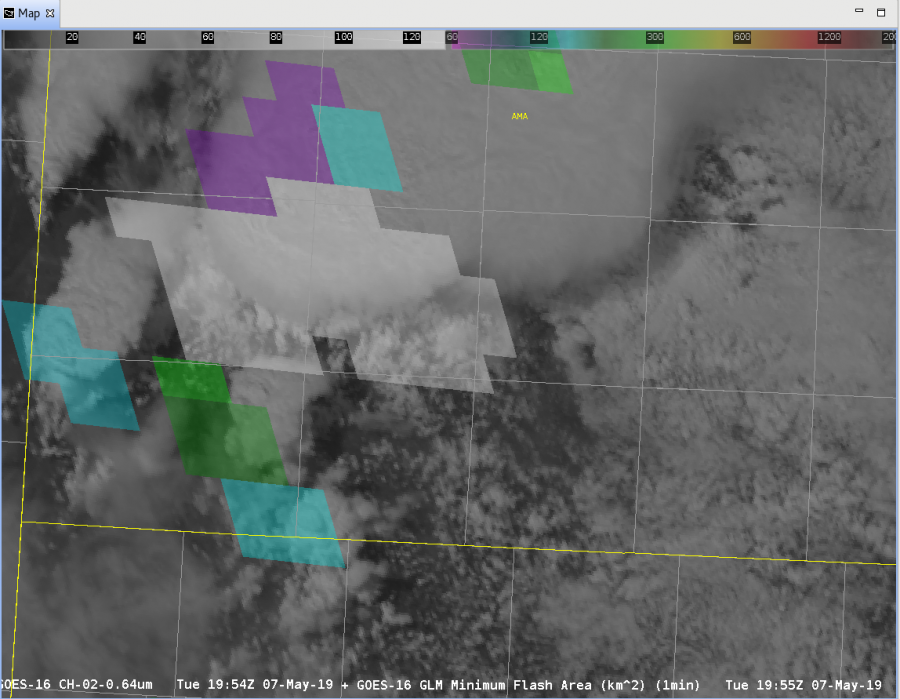
If there was indeed a flash at this time, the optical energy could have reflected from the originating area off the anvil, and then reflected back off the low clouds around the updraft to the GLM instrument. However, the fact that there isn’t any data associated with this flash in Flash Extent Density is concerning. Needless to say, the lightning scientists here are all going “Hmmmmmmm….”
-Dusty
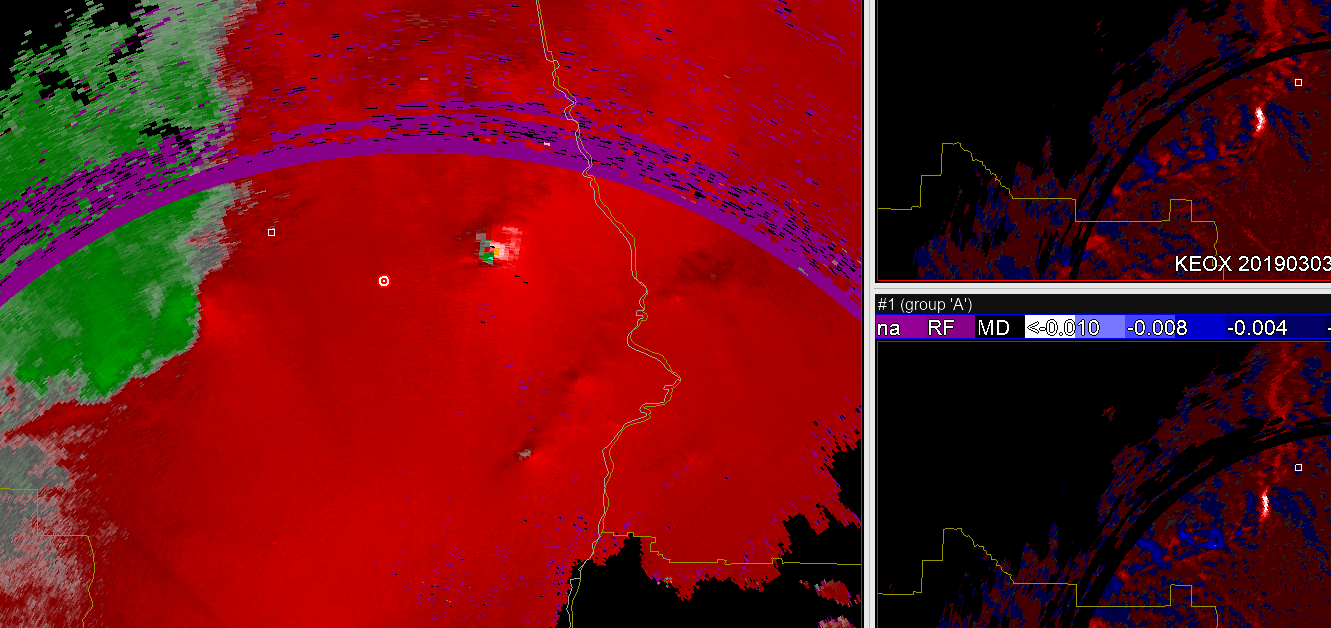
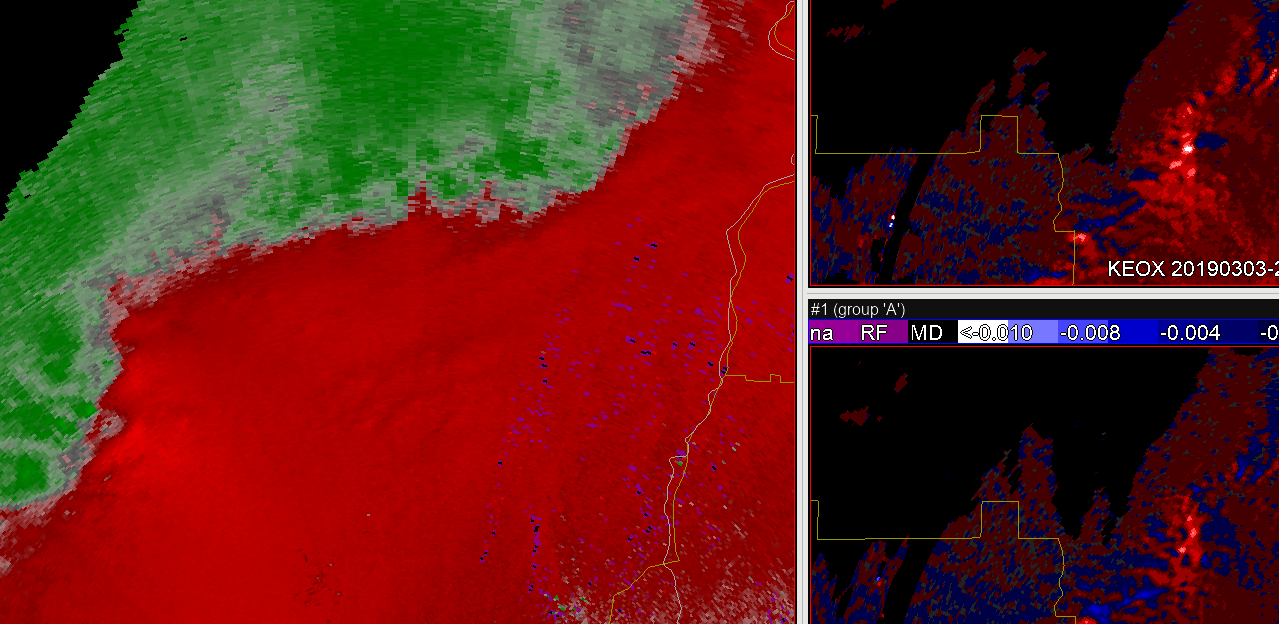
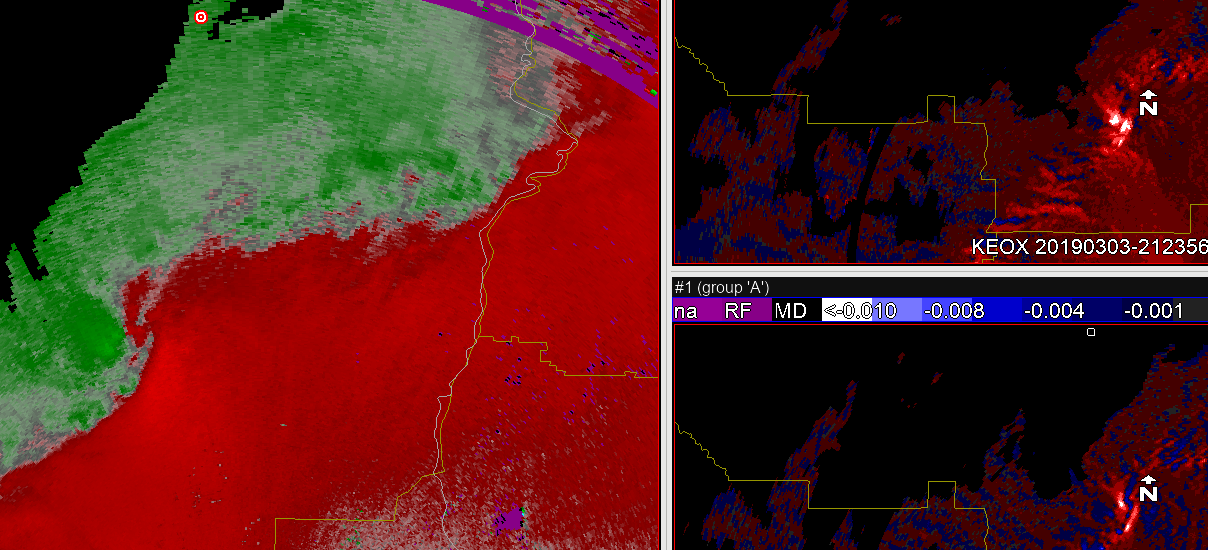
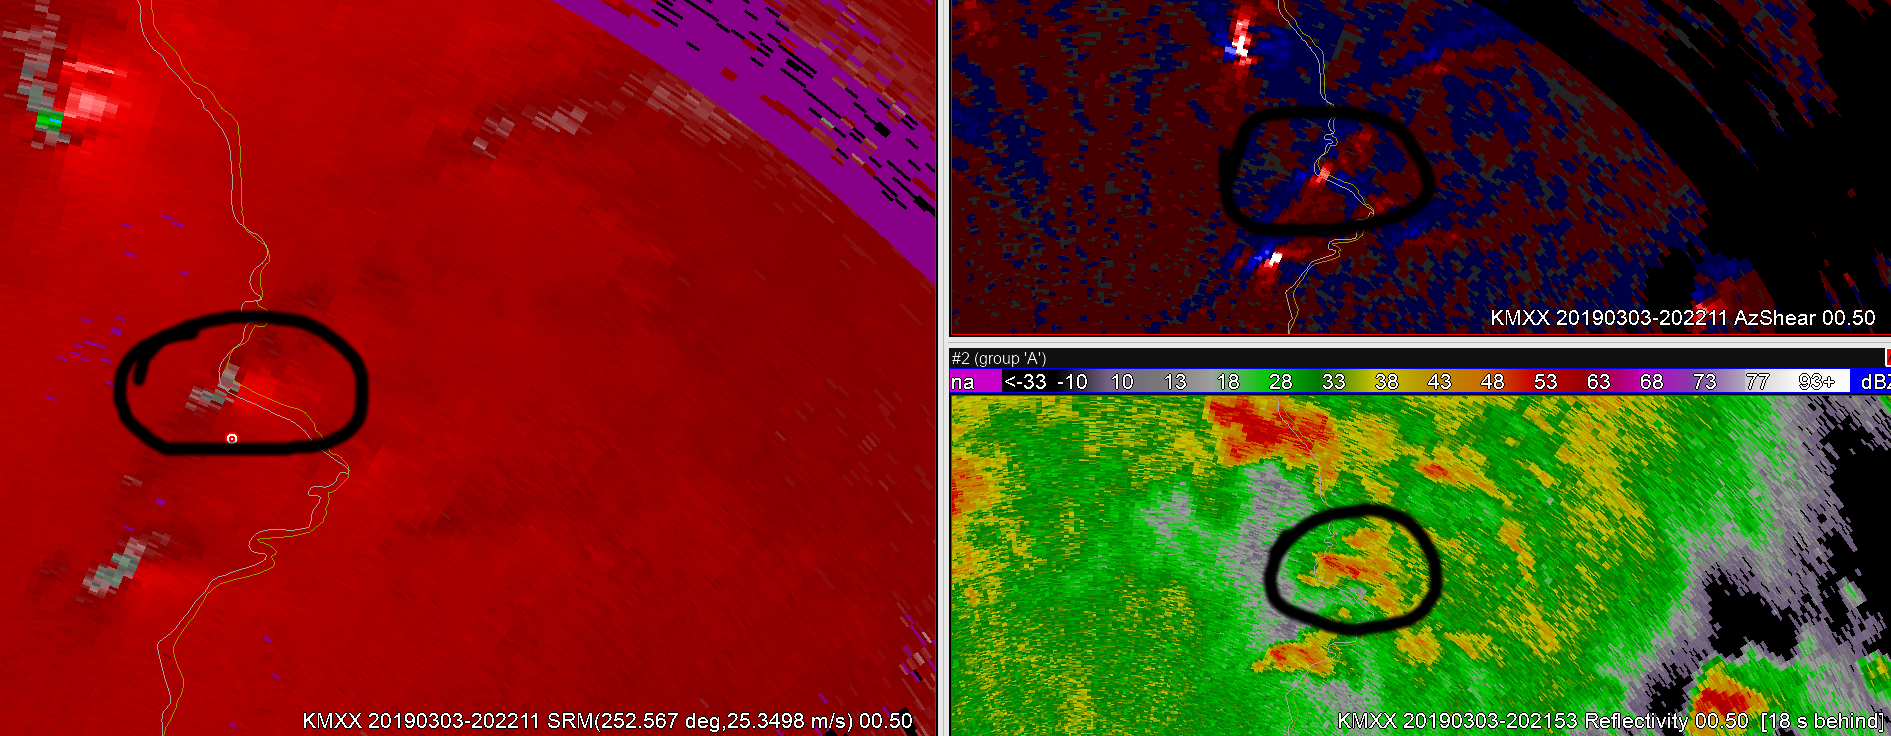
Although the second circulation does not produce a tornado, my attention was directed toward the second circulation thanks to AzShear. Also, the RFD shows up quite nicely negative values in AzShear.
ZDR_Arcophile
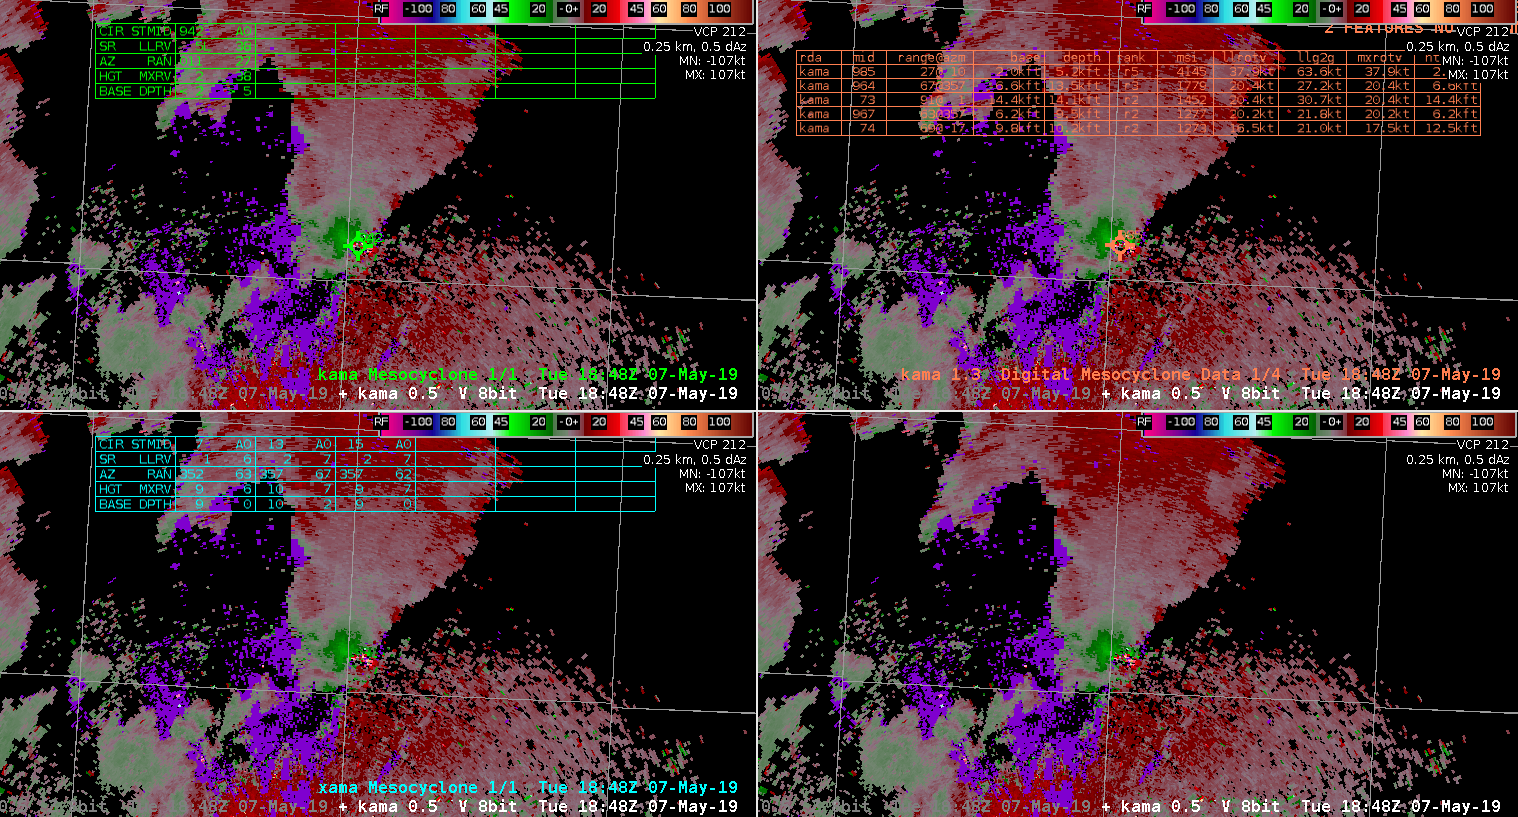
Quick comparison between the MDA, DMDA, and NMDA showing that the MDA and DMDA had marked an area in AMA’s CWA, yet the NDMA did not. However, two minutes later the NDMA finally caught on and highlighted the same area.

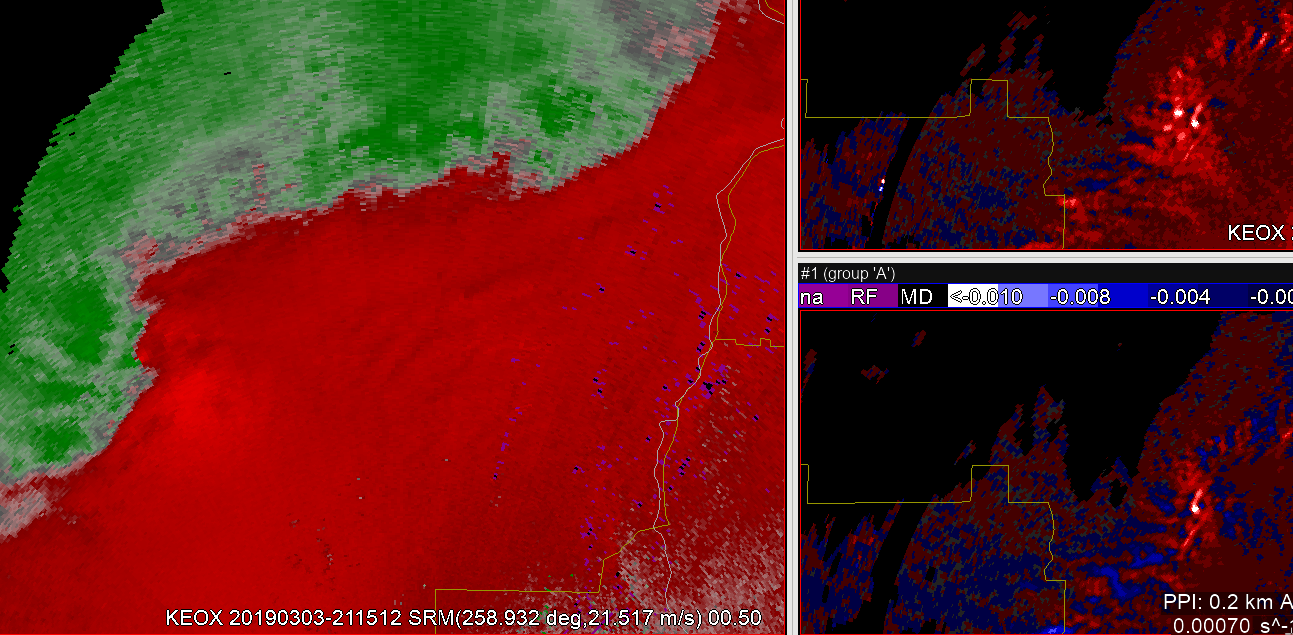
Right off the bat at the beginning of the simulation KEOX AZShear max really jumps out at you! A great SA example to quickly hone in on area of concern. 0-2 km Azshaer also very good.
Focusing on the squall line upstream, really like the way the elongated max in AZShear draws attention to the increasing shear along leading edge (updraft-downdraft convergence zone UDCZ) of the surging portion of the QLCS. Often a precursor to MV intensification along the UDCZ. 66
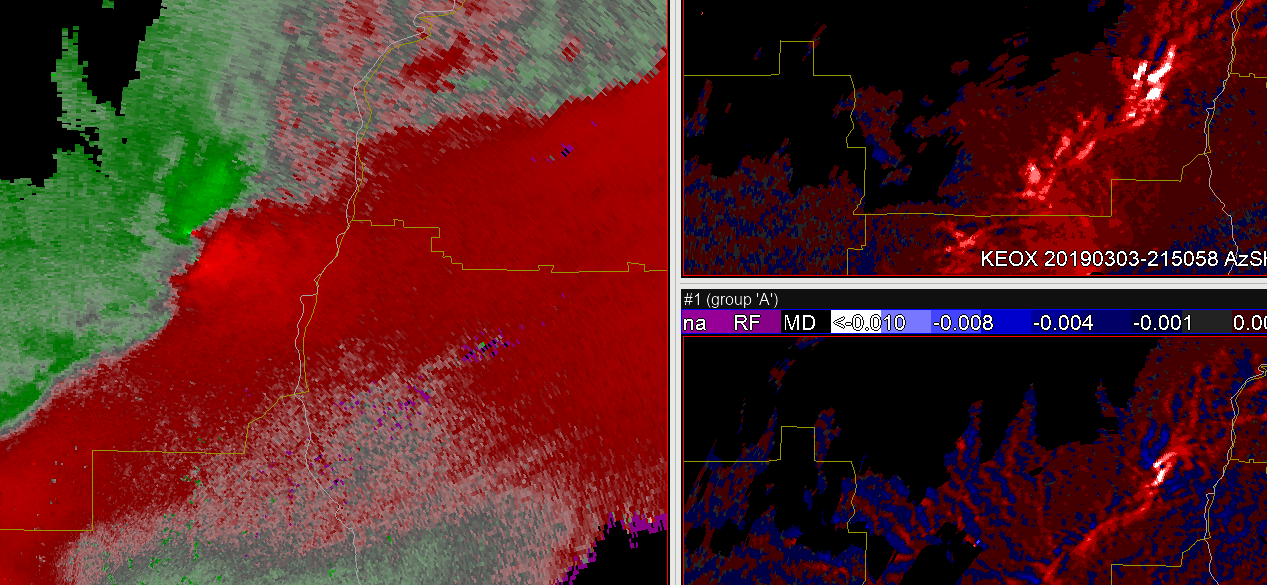
The following sequence shows the evolution of a mesovortex along the UDCZ a little later in the event. The first panel nicely shows a MV forming (left portion of SRM below) with a AZShear max evident at that location as well. The second panel below suggests that the MV starts to fall back just behind that leading UDCZ while the AZShear maintains a max with that circulation. What is even more interesting is that in the 0.5 AZShear in particular, you can still see an elongated area of enhanced shear associated with the leading UDCZ just downstream from the MV. You can see these two distinct features even more clearly in the last panel below. In summary I think the 0.5 and 0-2 km AzShear can hep forecasters identify increasing shear along the UDCZ where it is starting to surge…and then identify subsequent MV development and evolution along the surging UDCZ.
Finally, the image below is several volume scans later showing a very similar sequence as that described above. A an elongated area of enhance VrShear develops along the UDCZ followed by subsequent MV development. The MV below in the SRM image is appears to be very likely tornadic at this time. The 0.5 AzShear (lower right) shows the enhance VRShear with the tornadic MV falling behind the leading UDCZ…and a continuation of the elongated enhanced shear along the surging UDCZ. This case demonstrated to me that the AZshear can certainly enhance the warning decision makers SA for more quickly identifying line surges and subsequent QLCS MV development. Given QLCS MVs tend to form in the around 2 km or so, the 0-2km Azshear product may be of added value to identifying the area of enhance shear a bit sooner perhaps providing a bit more lead time on possible tornado warning – Great Case! – Quik Twip.
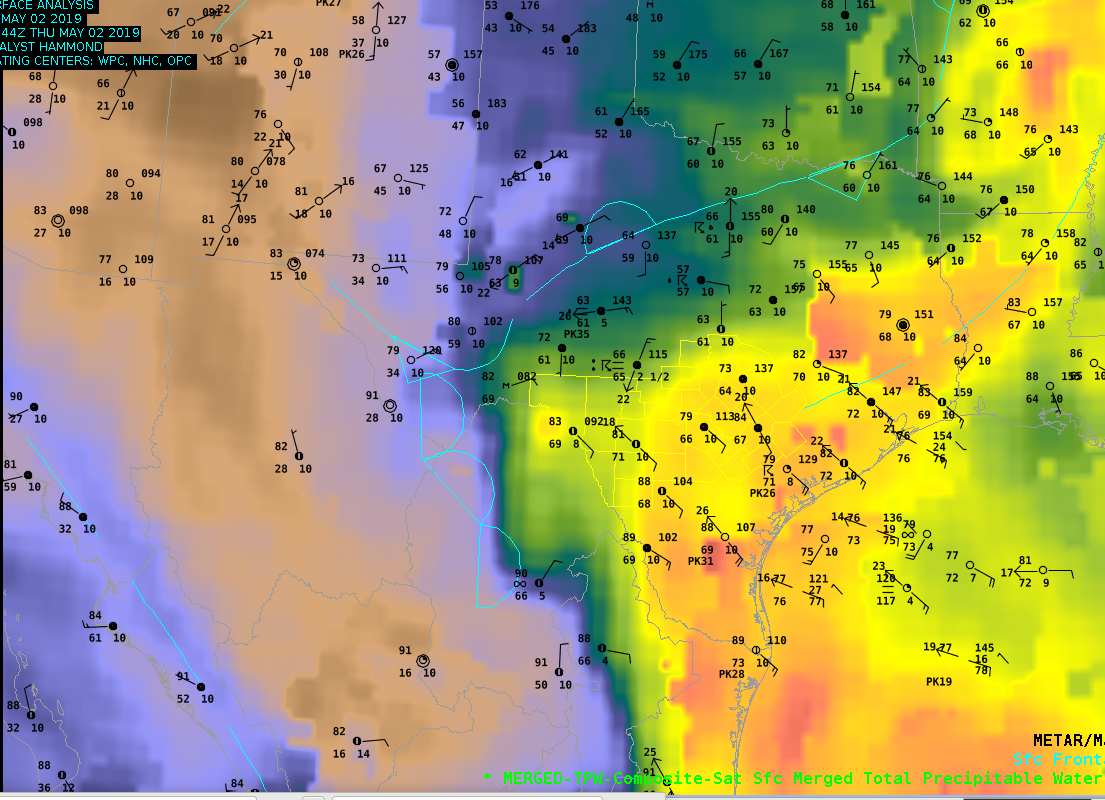
The merged-TPW product compared well to the surface obs with 1) the strong gradient along the dryline 2) the lower PWAT values behind the MCS and 3) axis of greater PWAT along the immediate Gulf Coast. Actual values however were too high in the dry air (MAF/DFW) and too low in the moist air (DRT/CRP). Values compared to 12Z soundings at BRO the best.
— SCoulomb
The merged CC product provided good continuity with the TDS when the single radar CC temporarily lost the signal. This can be important for messaging or confidence in TDS appearance for product updates.
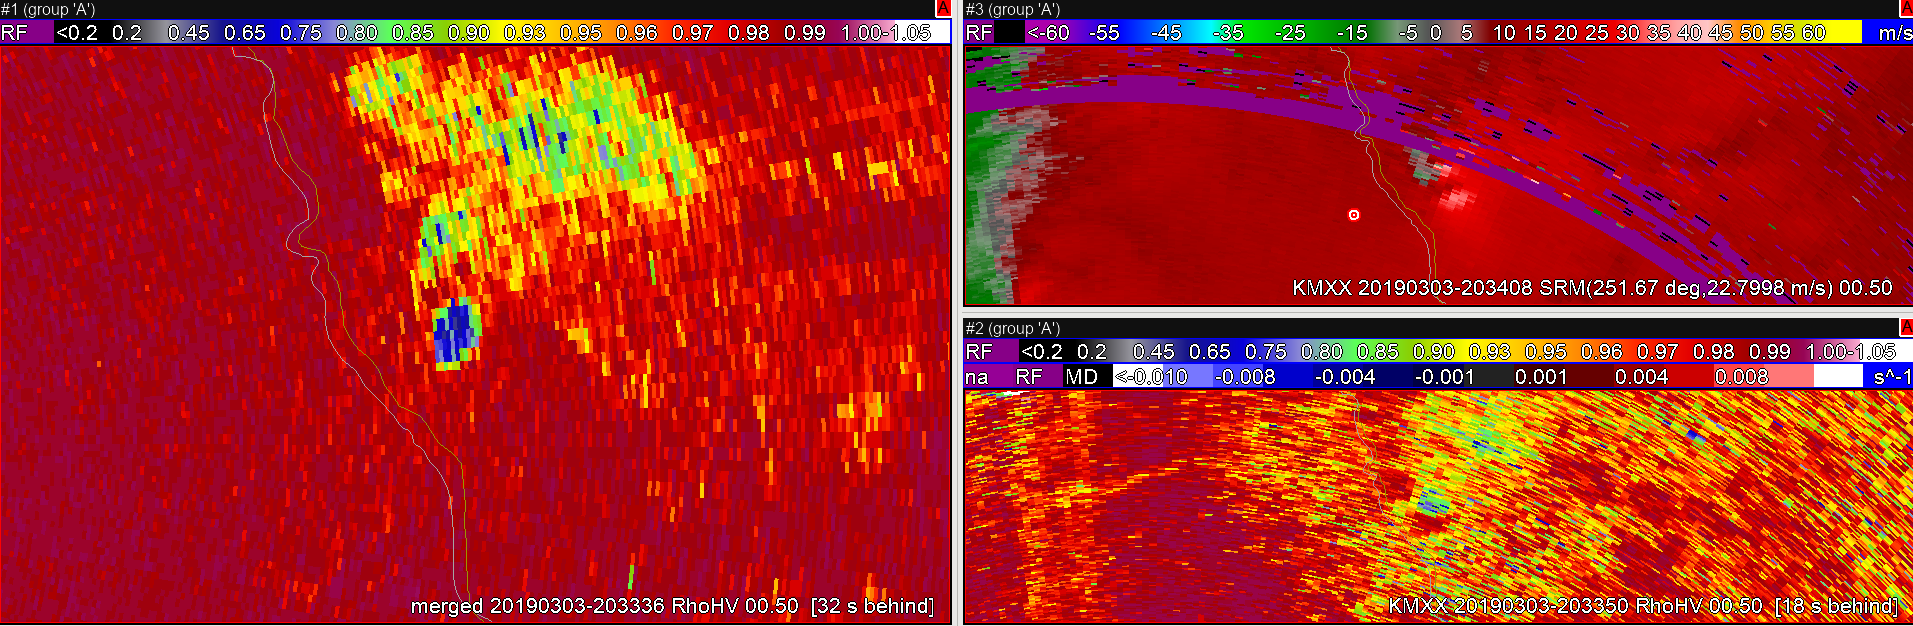
— SCoulomb
An application of AZ-Shear that may show some promise is that it seems to hint at storms/areas which may develop into a velocity couplet. In this example you can see that high Azimuthal Shear values are beginning to be detected by the program, while very little response stand out in the velocity field.
Notice how a few minutes later a velocity couplet is beginning to form, when only a few minutes prior AZ Shear was the only indicator. If this becomes is a trend that develops, it might be able to increase warning times on tornadoes.
South Beach