

Today’s operations will be focused over the SJT (San Angelo), FWD (Dallas/Fort Worth), and EWX (Austin/San Antonio) county warning areas. Focus is once again ahead of an outflow boundary left over from overnight storms. To keep with the theme this week, storms are again on-going at the start of the operations period with a severe thunderstorm watch in place over a portion of the operations area. Supercells will be possible today but the scenario will be messy with storm interactions and mergers likely. The main threats today are hail and high winds but a few tornadoes are possible.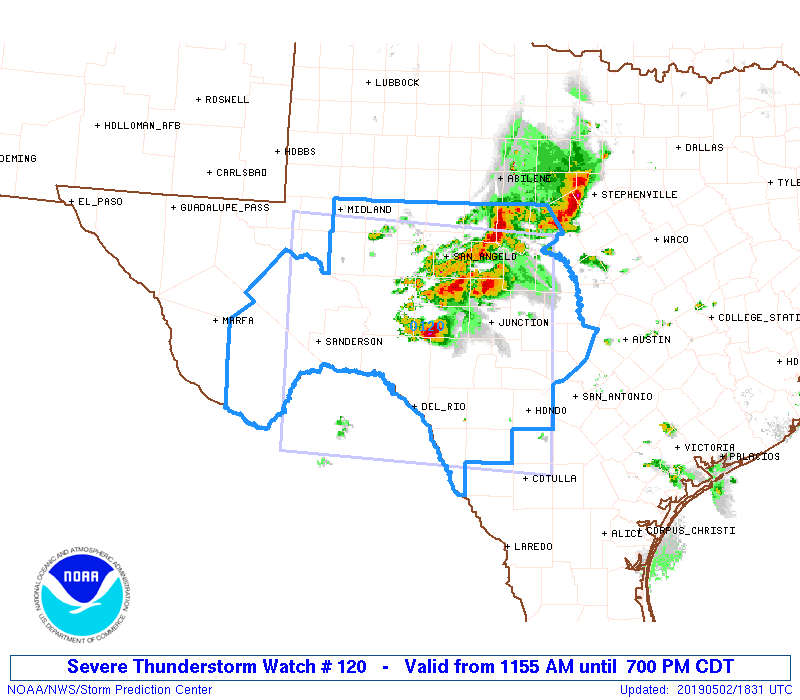
Category: News
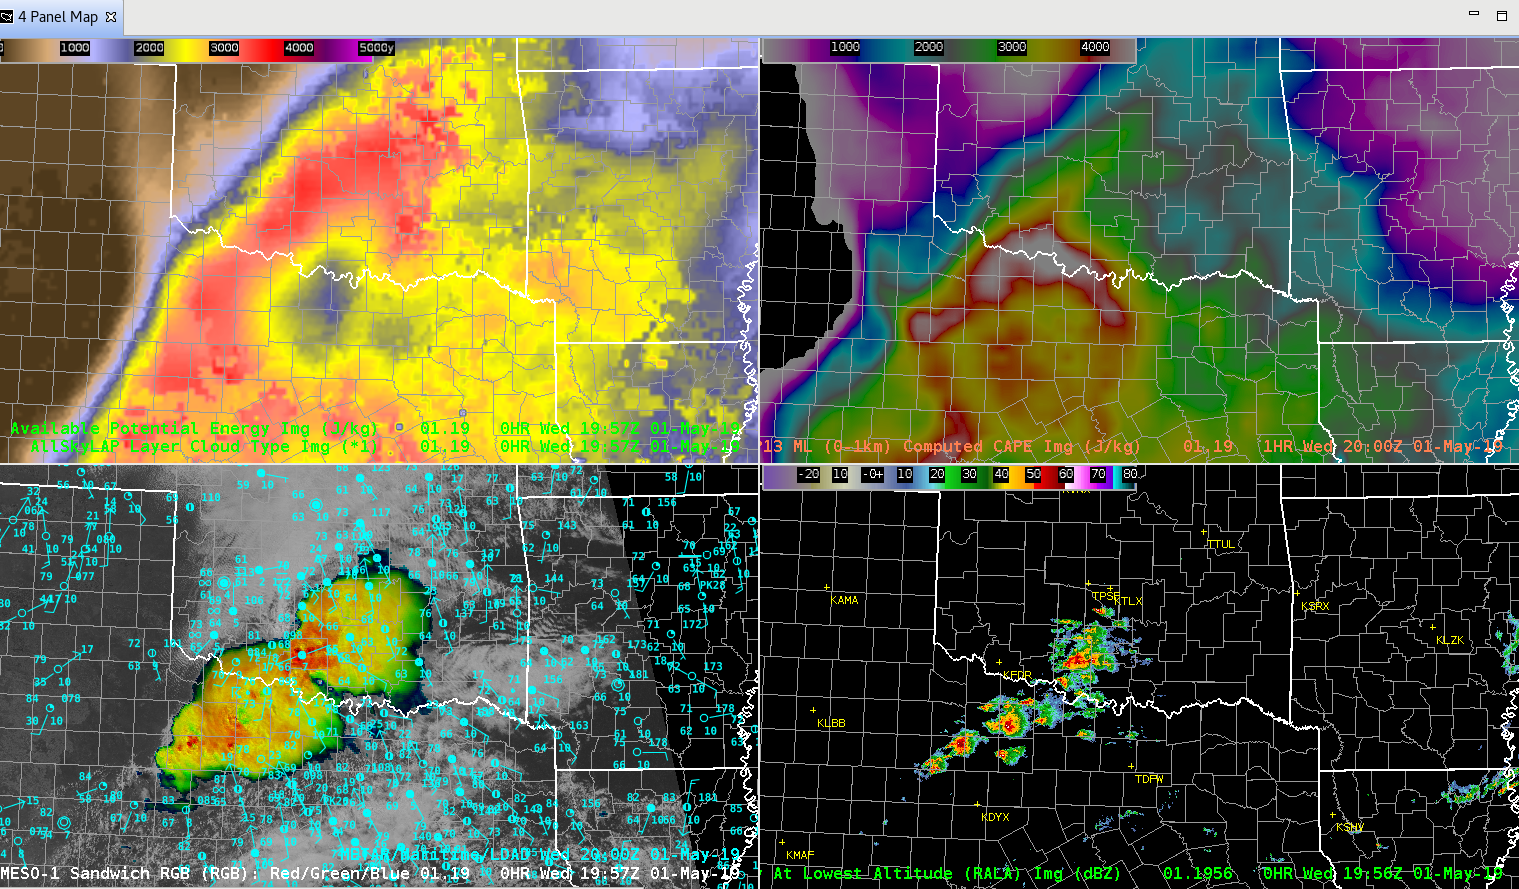
LAP all-sky CAPE hole
The LAP all-sky CAPE developed a min over north TX during the late afternoon. The RAP 0-1km MLCAPE had a similar min. Convection was struggling to develop in this region giving support to the lower derived values. CAPE was overall much higher across the warm sector and into central OK for LAP when compared to the RAP although the RAP had a ring of ~4500 J/kg CAPE around the relative min (~3300 J/kg).
NUCAPS vs. Obs
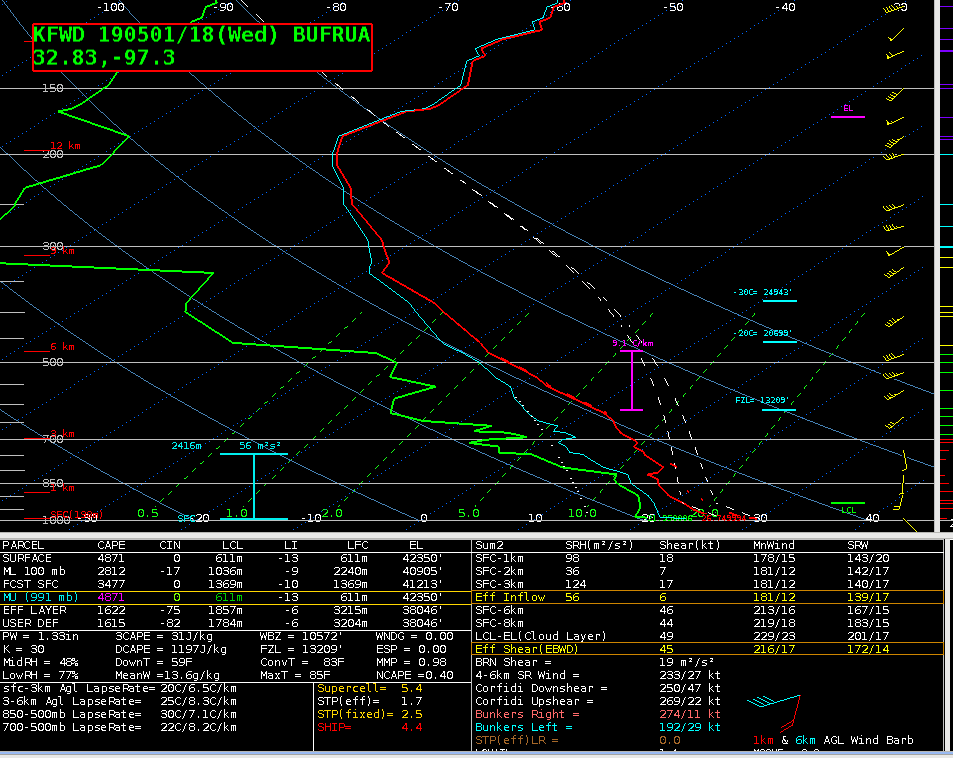
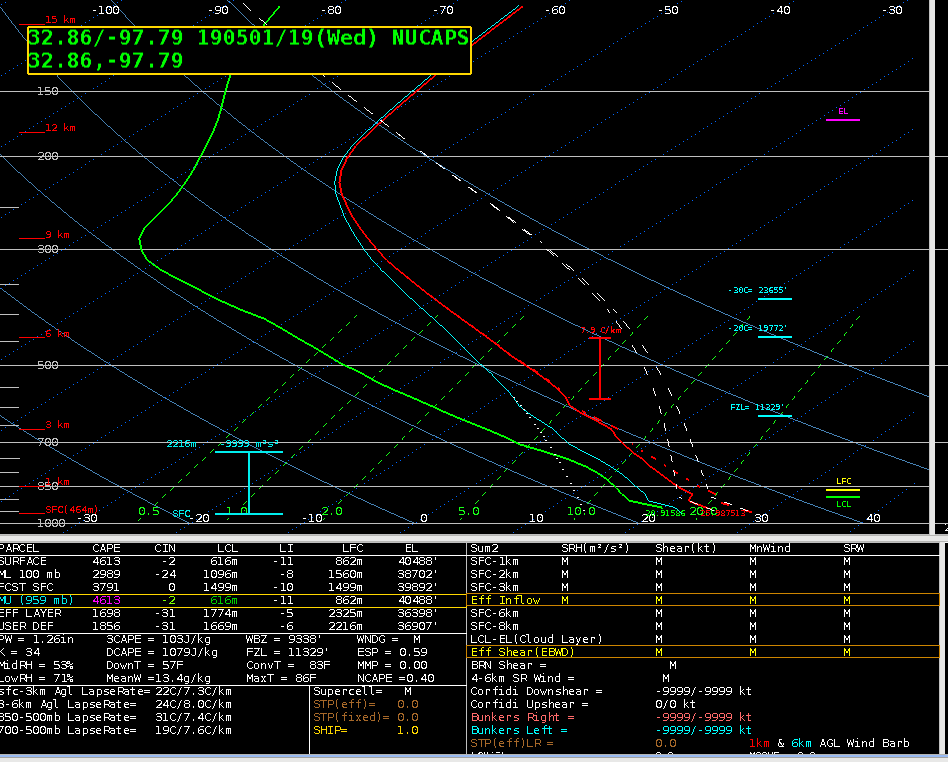
Perfect conditions to utilize NUCAPS soundings today in the FWD CWA. FWD did a special release at 18z and I was able to compare that to a 19z NUCAPS sounding immediately west of FWD, ahead of the ongoing convection north and west of the CWA. They are remarkably similar from the boundary layer upward with very similar MUCAPE/SBCAPE values around 4600-4800 J/kg.
This highlights how important these NUCAPS soundings can be in the absence of any 18-20z special balloon releases. I’m very impressed with how well it lines up with the observed 18z launch and have more confidence in using these in pre-convective environments.
–Stanley Cupp
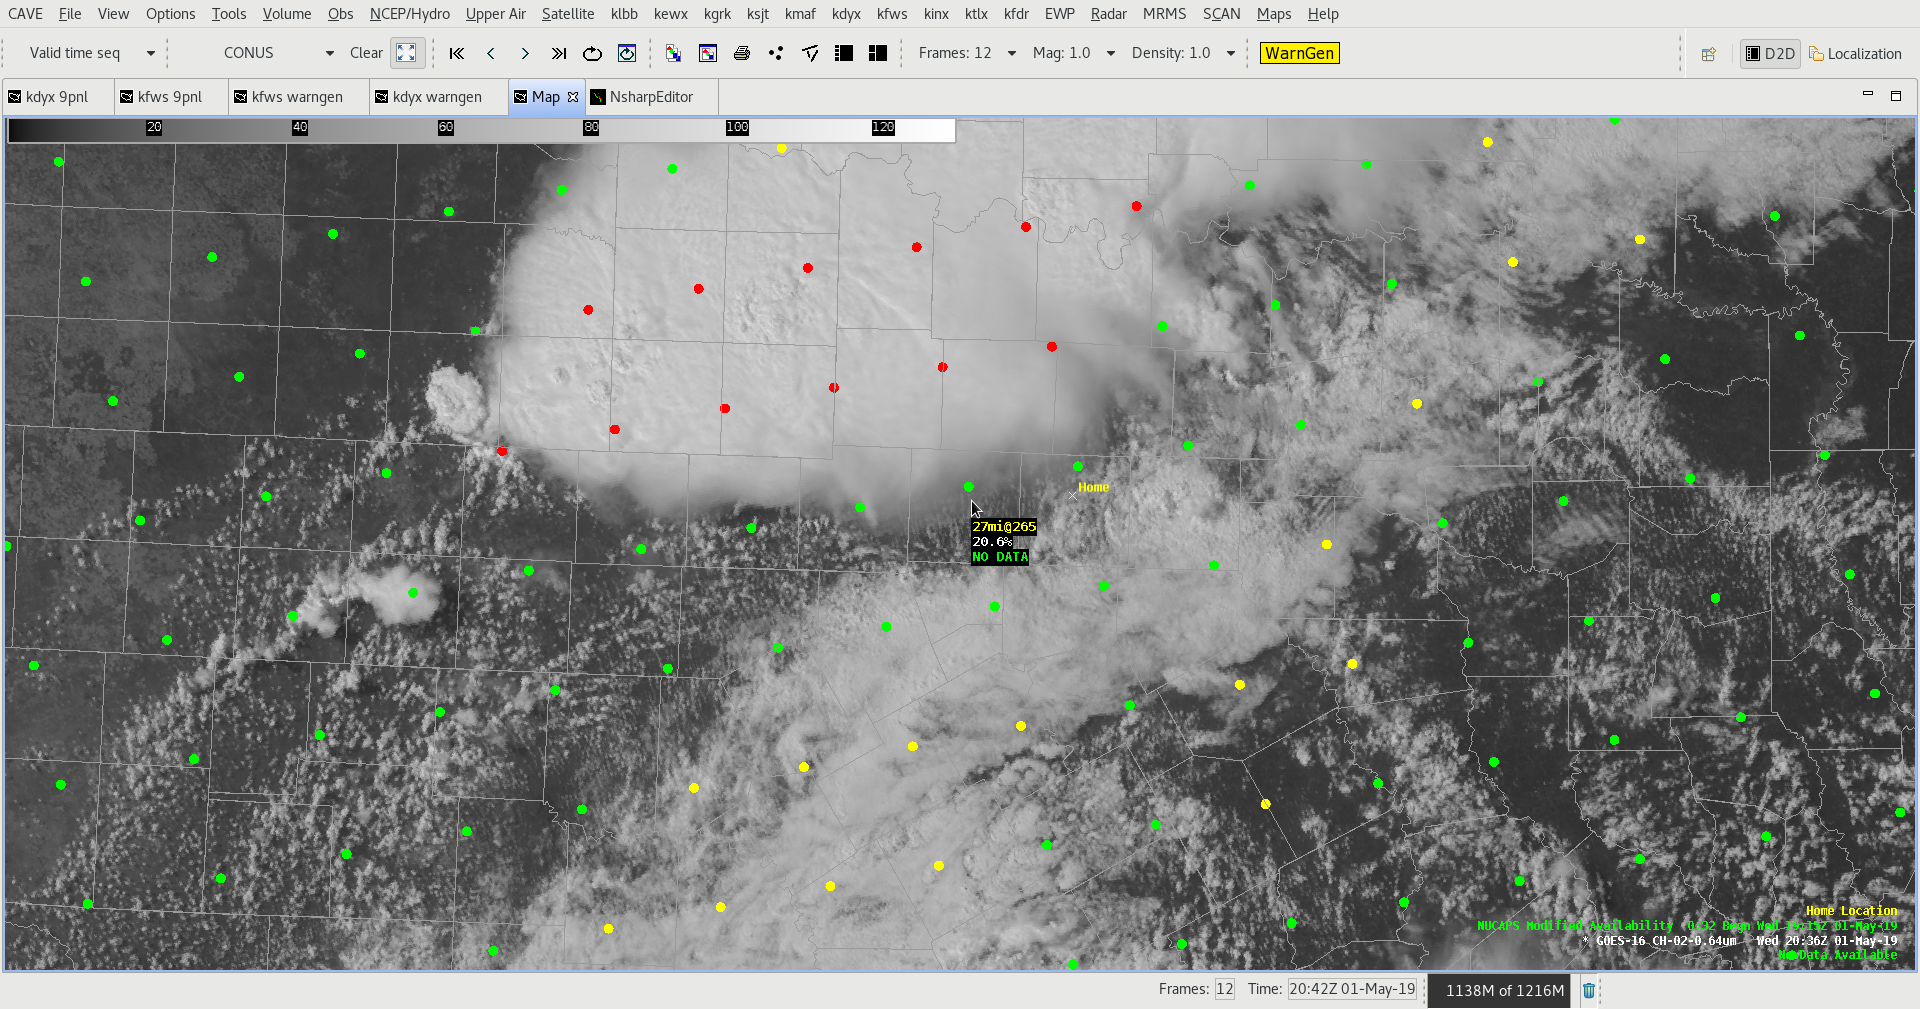
18z FWD sounding:
19z modified-NUCAPS sounding ~25 miles west of FWD
NUCAPS location (green dot above mouse cursor) vs. FWD location (yellow home cursor) and 1 minute vis imagery
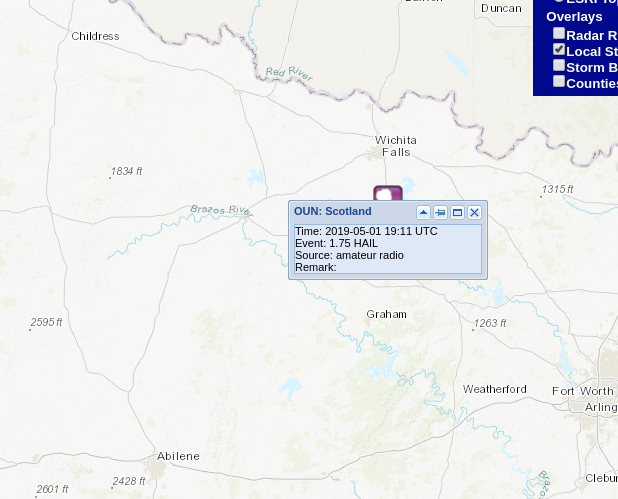
Prob Hail
With Large Hail being the biggest concern today. Focus has been primarily on that aspect. Notice how high the severe hail probability climbed very rapidly. With a report coming in just after a major jump in the probability of severe hail.
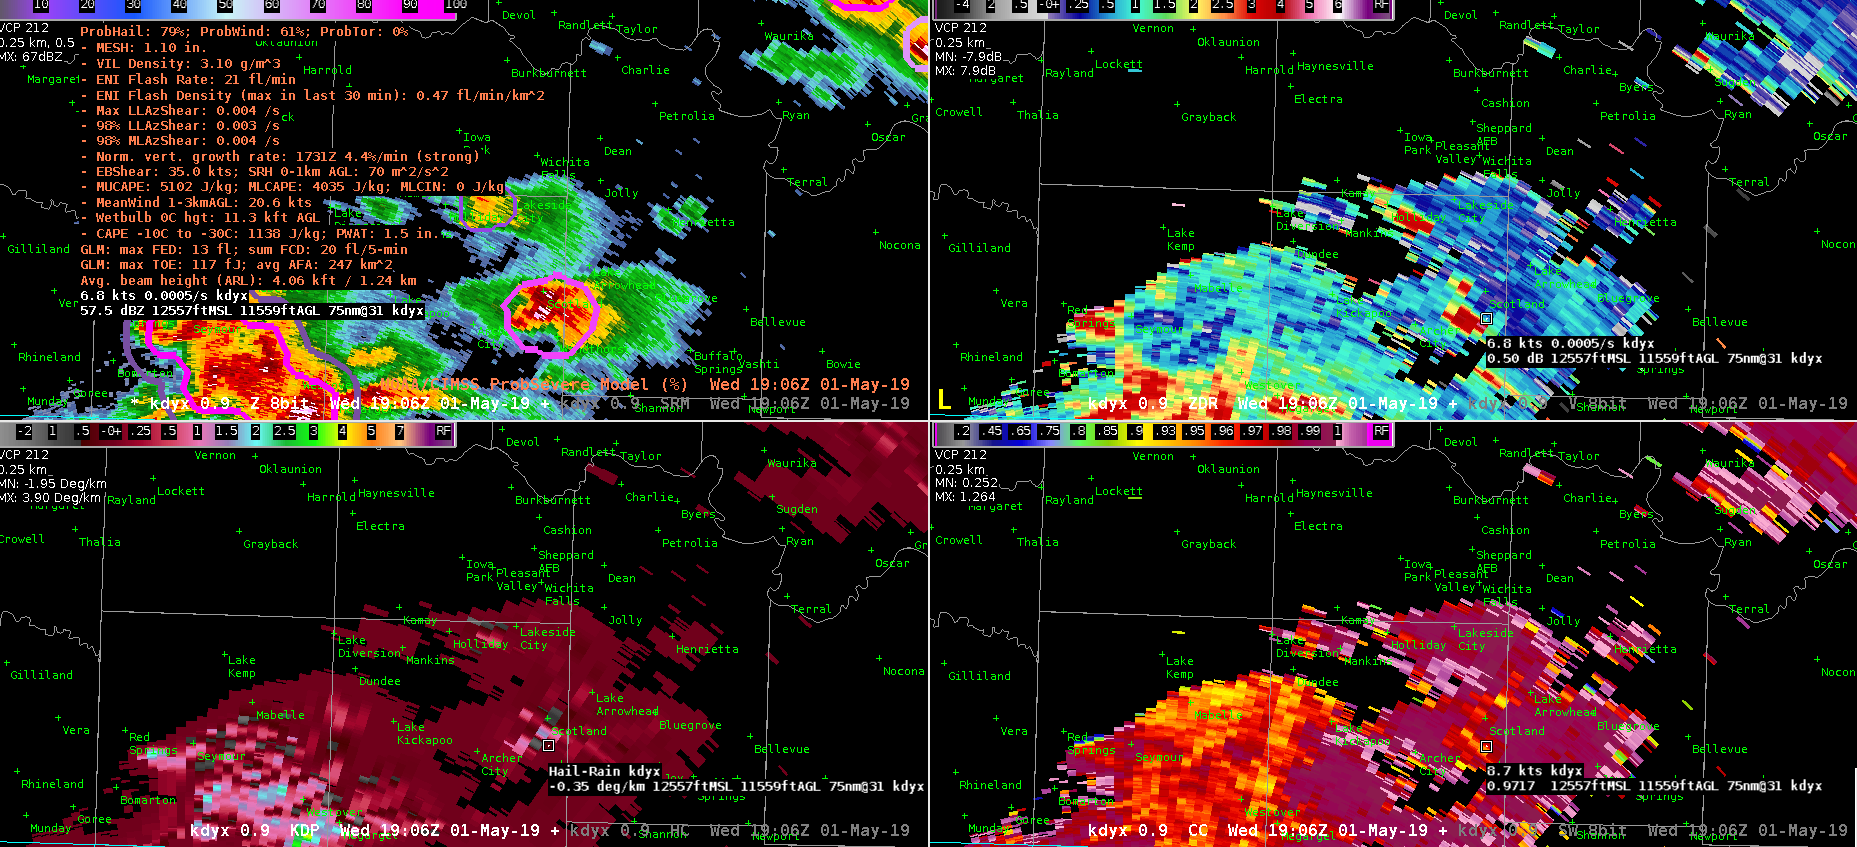
Notice the report came in 10 minutes after the large jump in probability.
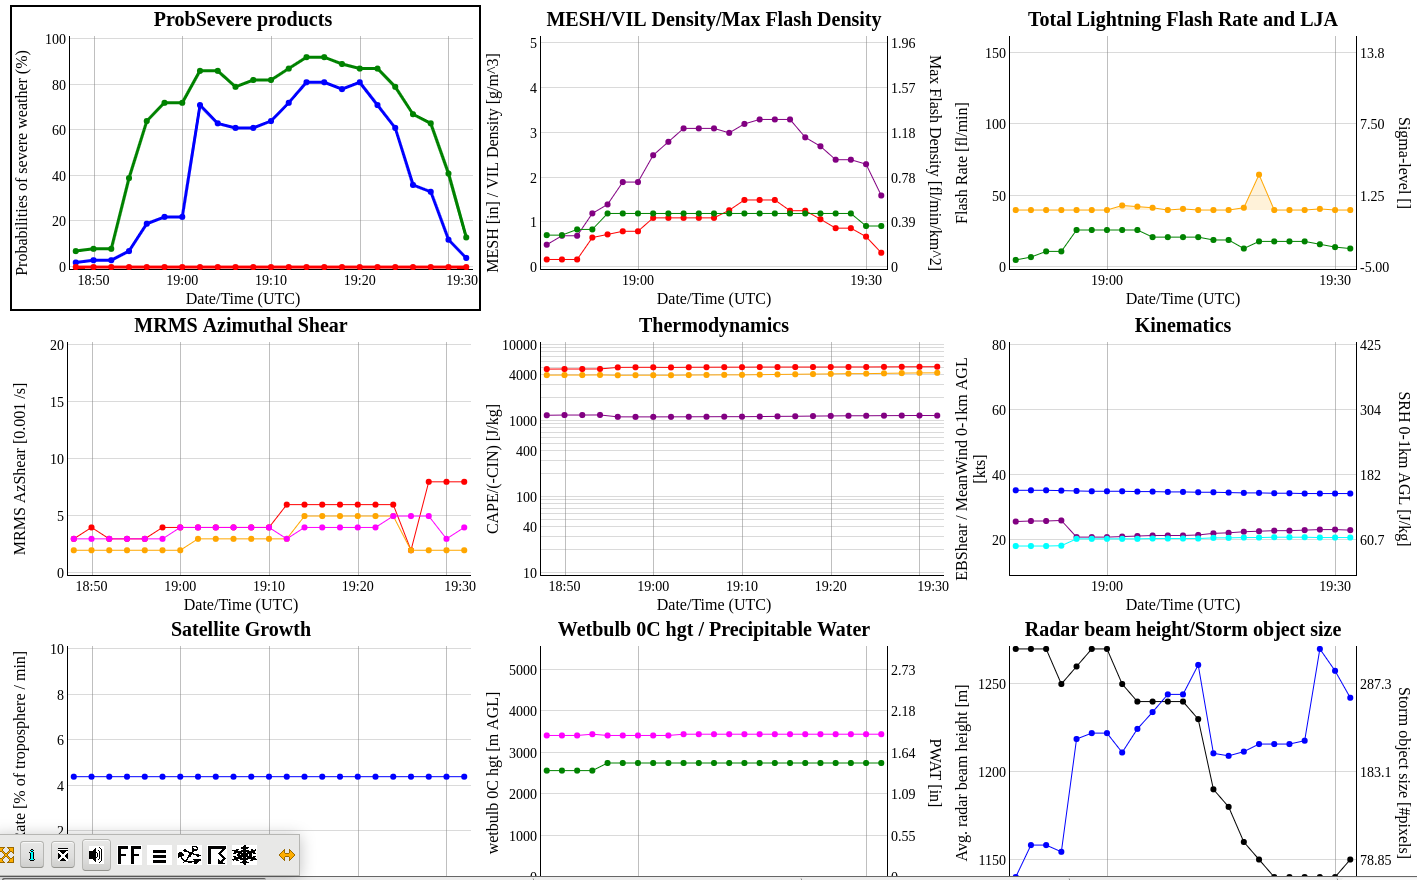
A great way to track your storm intensity trending.
South Beach
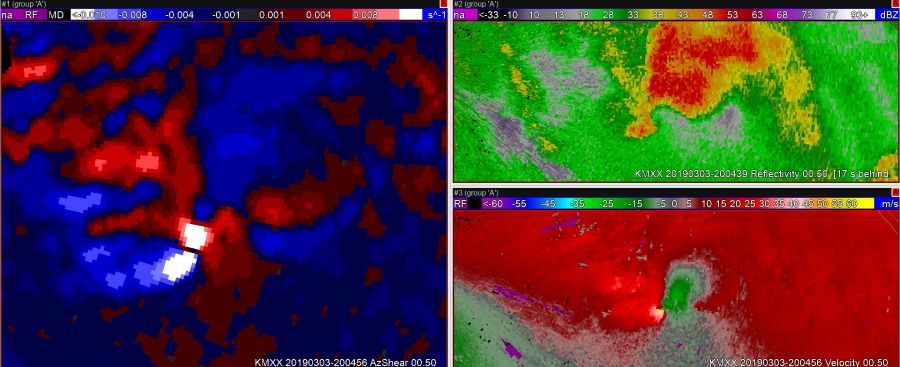
Az Shear Case – 3/3/19
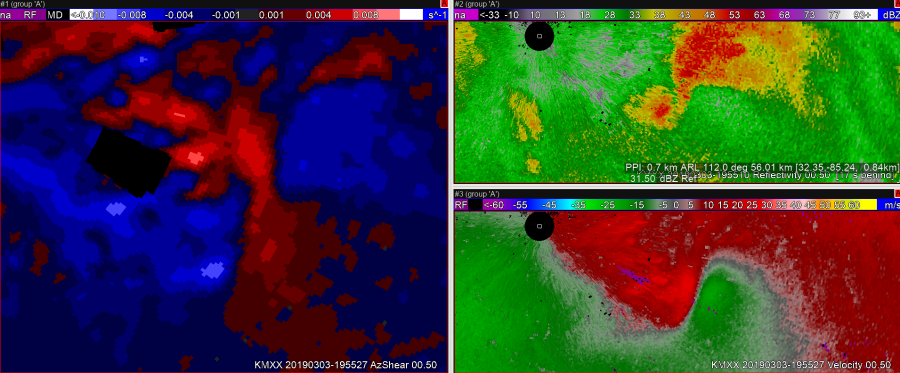 The case above shows a situation where due to the orientation of the zero isodop compared to the radar location, AzShear values are surprisingly low considering the strength of the convergent signature that preceded tornado development.
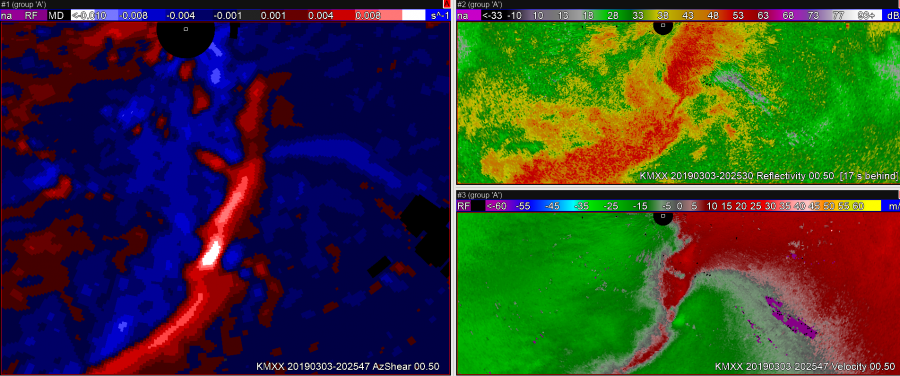
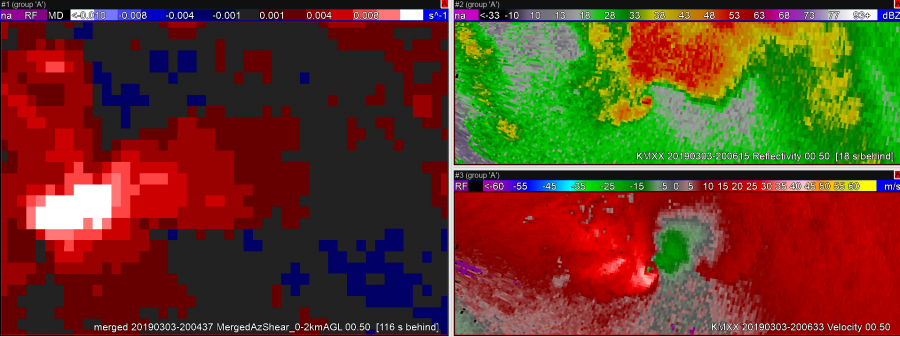
The case above shows different tornadic circulation developing, but this time to the south of the radar – a different orientation of the convergent signature relative to the radar. In both of these first two cases, the eventual tornado had not touched down yet, but the AzShear values were quite different. Training on zero isodop and how its orientation relative to the radar affects AzShear should be created for users before this product is used operationally. 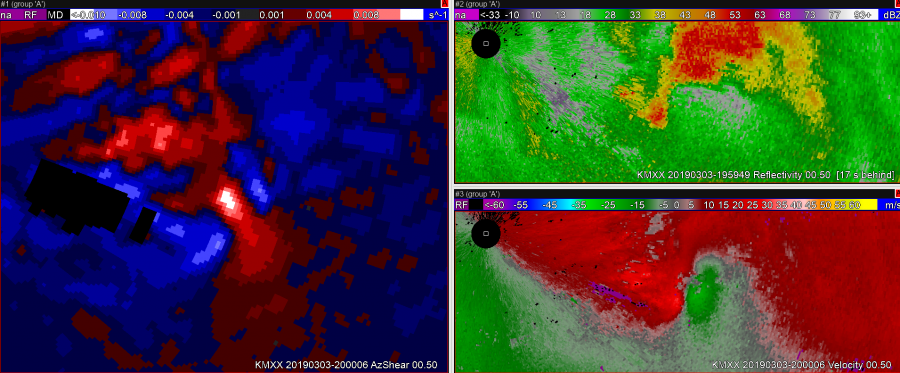
This image shows the first circulation a bit farther in time as the orientation of the convergence changed and AzShear value bins began to max out.
A case where using a color table with bins detracts from the usefulness of AzShear. There are two areas of high AzShear indicated, however very different things are going on in each of these locations. One is a strong tornado on ground the other is flanking line convergence. These two features should not have the same color if this product is to be used in operations. Consider a graduated color ramp with a high range instead of broad bins.
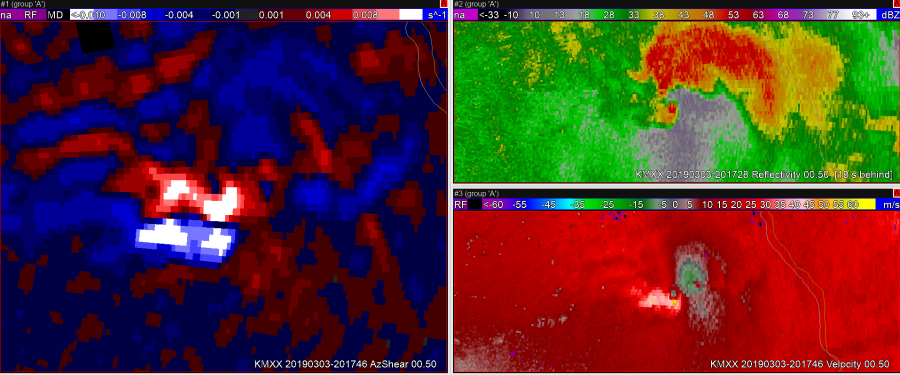
 A case where the anticyclonic shear component is extremely prominent in AzShear. Are these regions useful for forecasters focusing on the tornado? Are they more of a distraction? They could be a distraction in some situations.
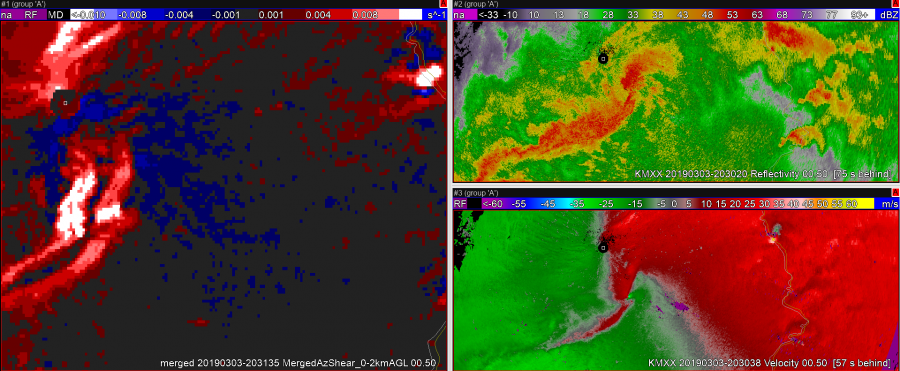
The two above images compare 0-2 AzShear (top) and single scan AzShear (bottom). Due to multiple sampling by multiple radars, it appears as though 4 different iterations of the squall line shear boundary are plotted. This renders the merged 6646data almost useless for interpretation purposes. The single scan data removes this issue. Also from these screen grabs, it appears as though the farthest east scan is coming from the KMX, the single scan site used here.
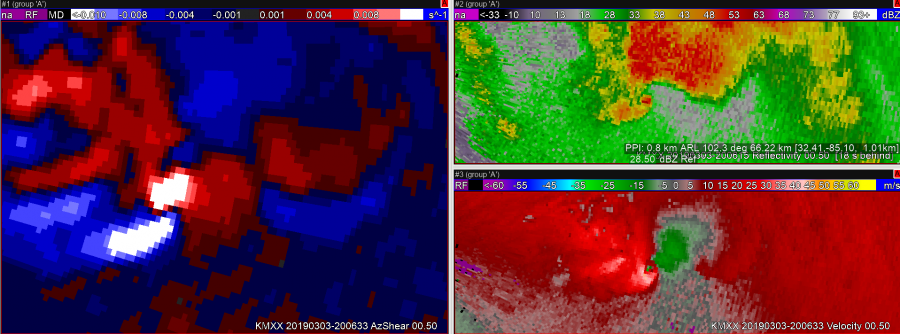
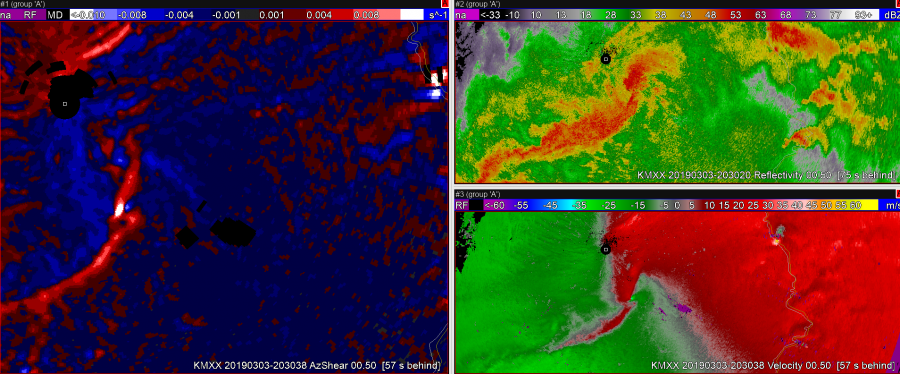
The two examples above show the benefits of single radar versus merged once again. The merged azshear core is several miles behind the circulation center at this time. The single radar data follows the current velocity scan as expected. In a time-sensitive warning operation scenario, knowing this I would likely use the single radar product exclusively.
-Dusty Davis
Max Value Readout for GLM in upper left of screen?
GLM FED maxed out at 160 fl/5-min and TOE at 580 fJ on this cell in southern MO. It would be nice to have the maximum value, at least for the FED and TOE products in the upper left corner like the ground-based networks have. This would also help with quantifying things such as lightning jumps or quickly comparing two cells.
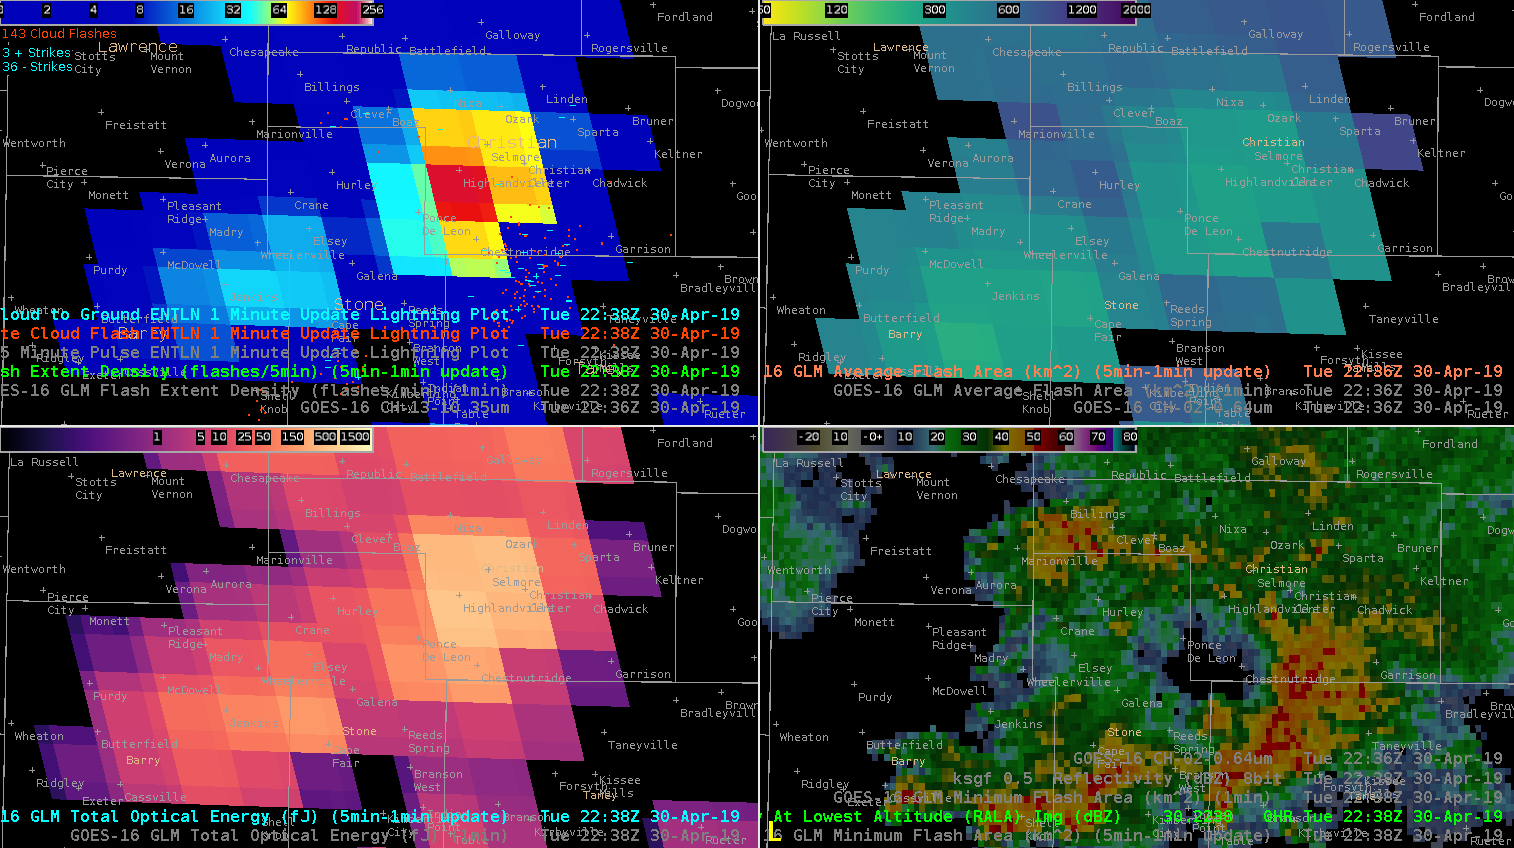
GLM FED (UL), AFA (UR), TOE (LL), RLA (LR)
— SCoulomb
All Sky Severe Environment
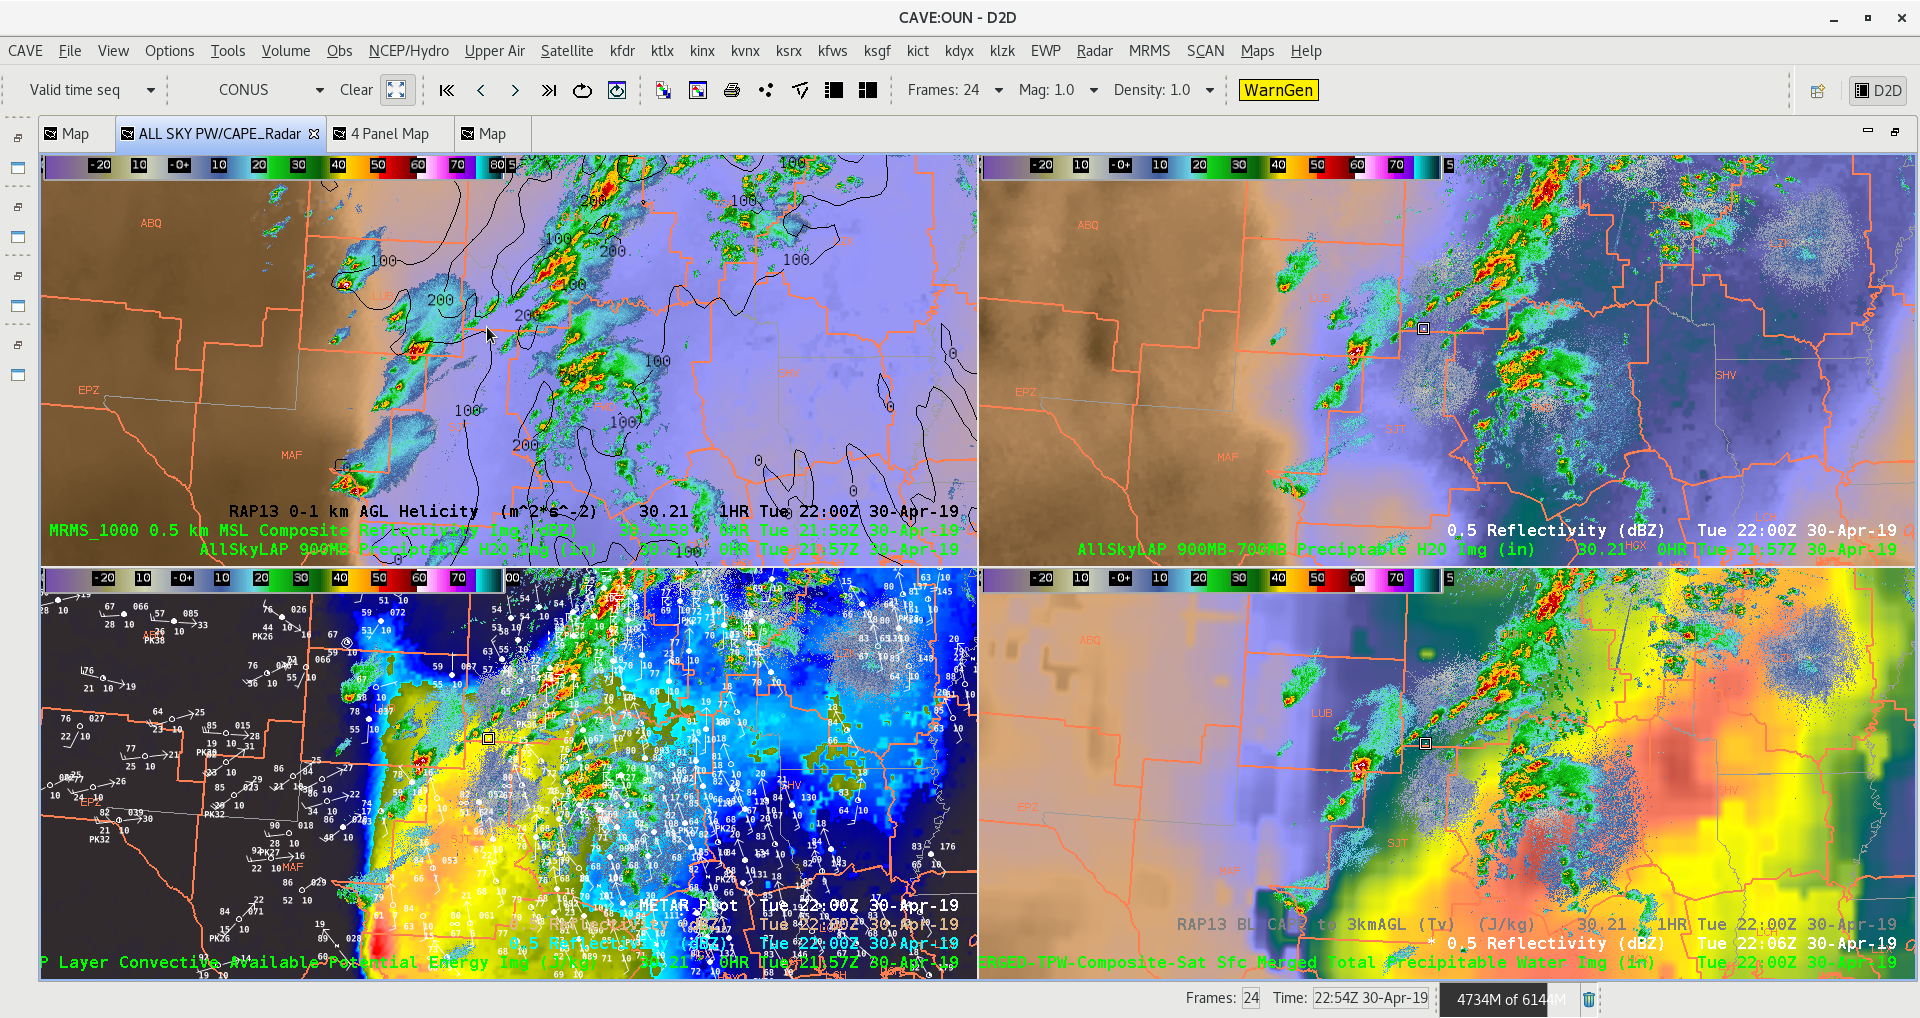
Mesoscale analysis is MUCH improved with ALL SKY products. It gives the forecaster a great visual of where moisture advection is occurring in the layered products. In addition, CAPE and Total PW highlight the more unstable regions with intensifying storms from overlaid region radar data. -Jake Johnson
GOES-W & GOES-E GLM comparison
Looking at GLM for GOES-W in Full Disk (L) and GOES-E in meso sector (R) the flash extent density and average flash area compare well to one another. Max FED values were 62 and 64 fl/5-min respectively. They also showed similar overall footprint with even the smallest flash values. Parallax is obvious with the peak values separated by ~15 mi at this longitude.
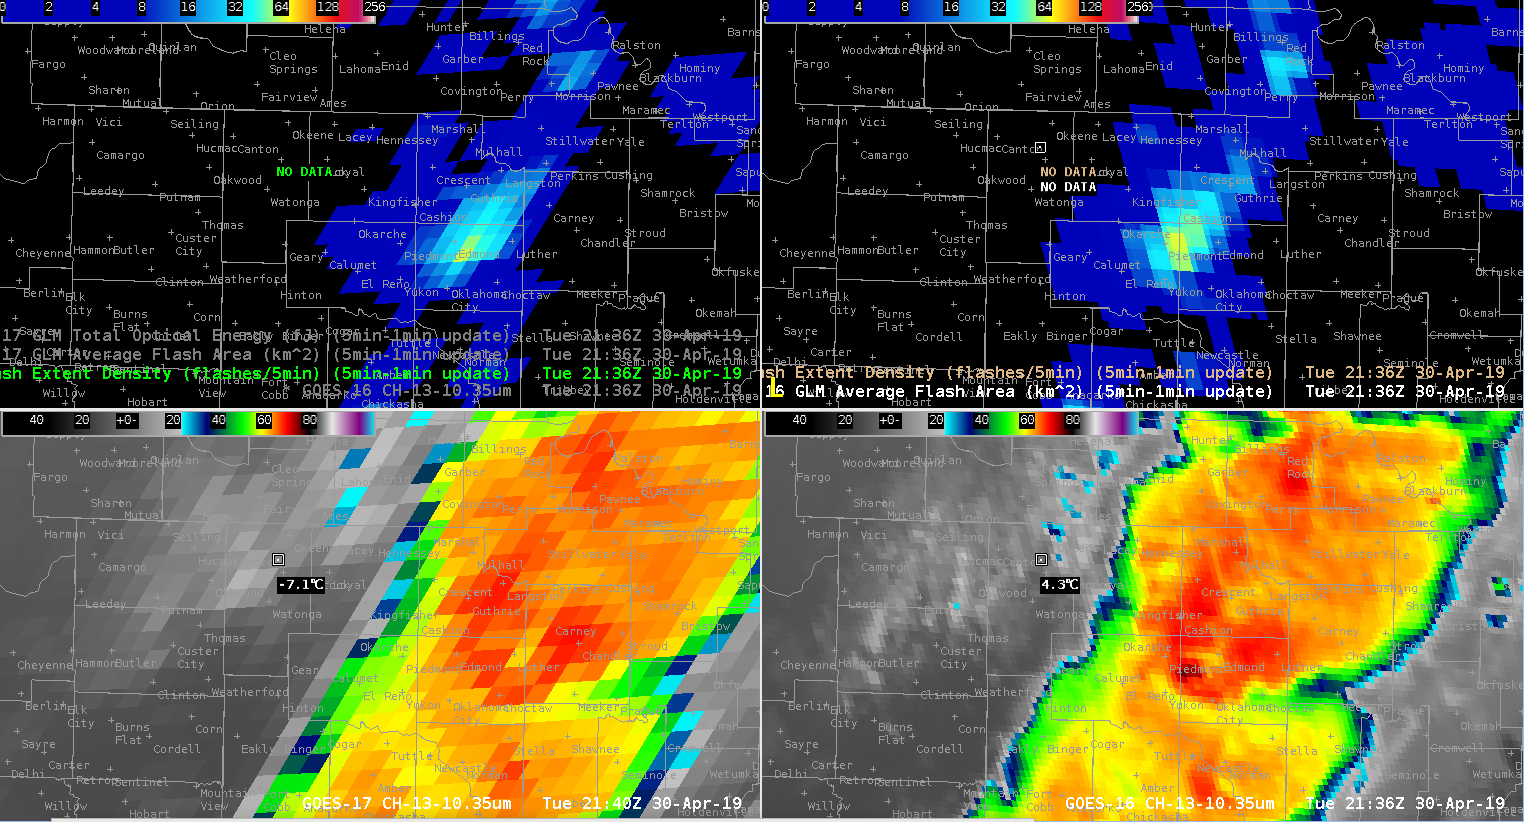
GLM FED from GOES-W full disk (UL), GLM FED from GOES-E meso sector (UR), 10.3 um from GOES-W full disk (LL), 10.3 um from GOES-E meso sector (LR)
— S Coulomb
CPTI in Ranges for Analysis
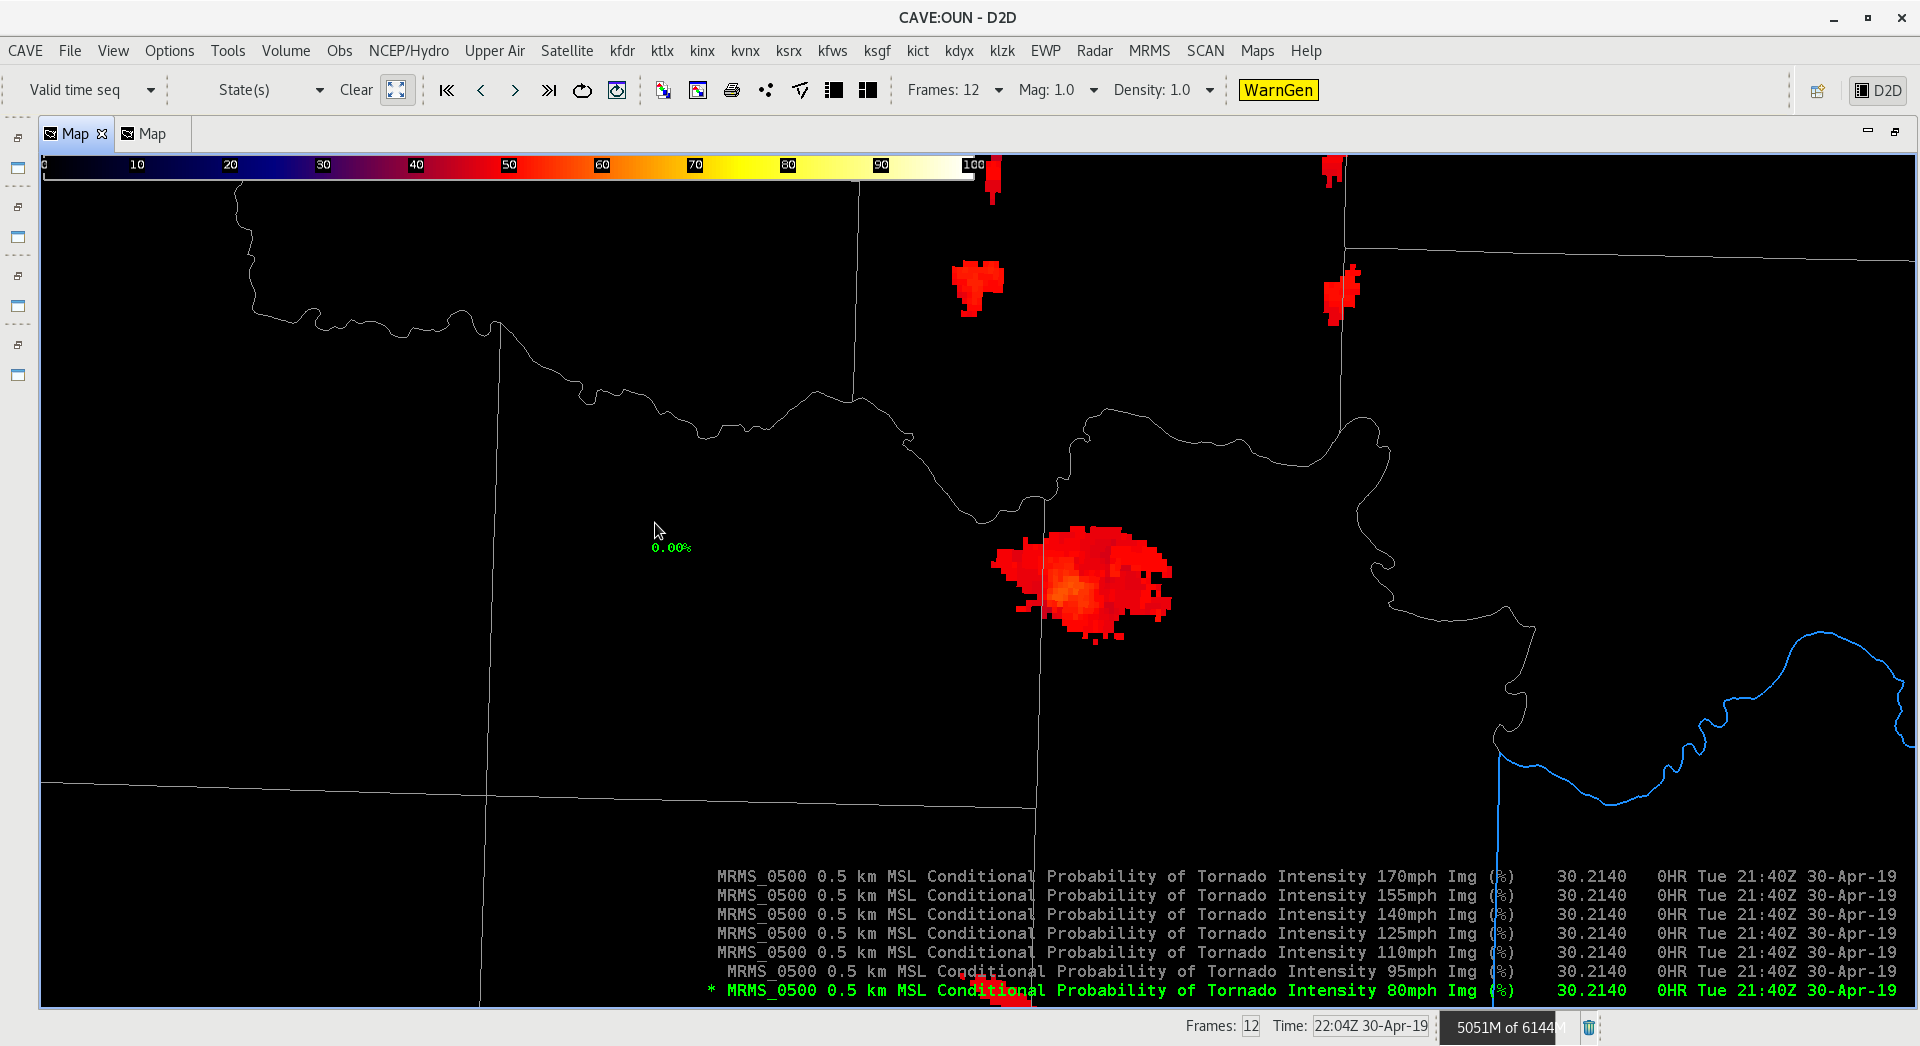
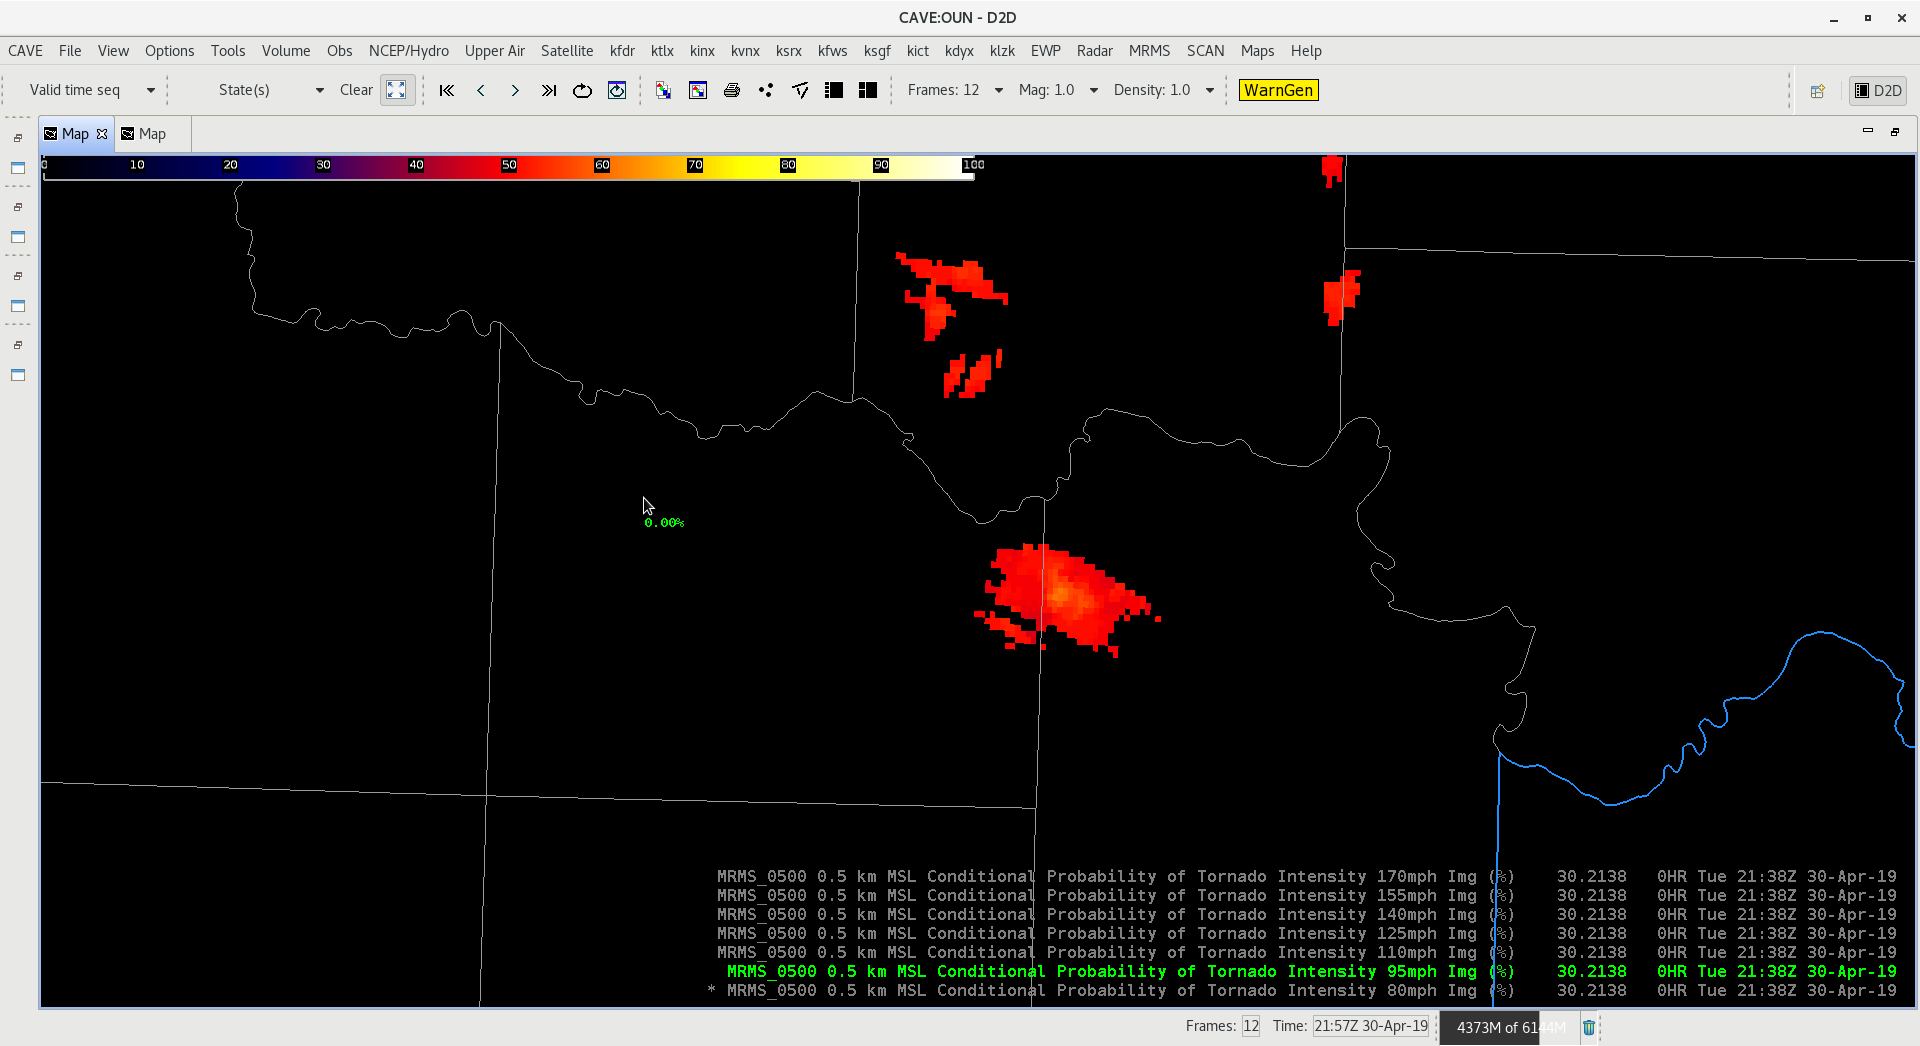


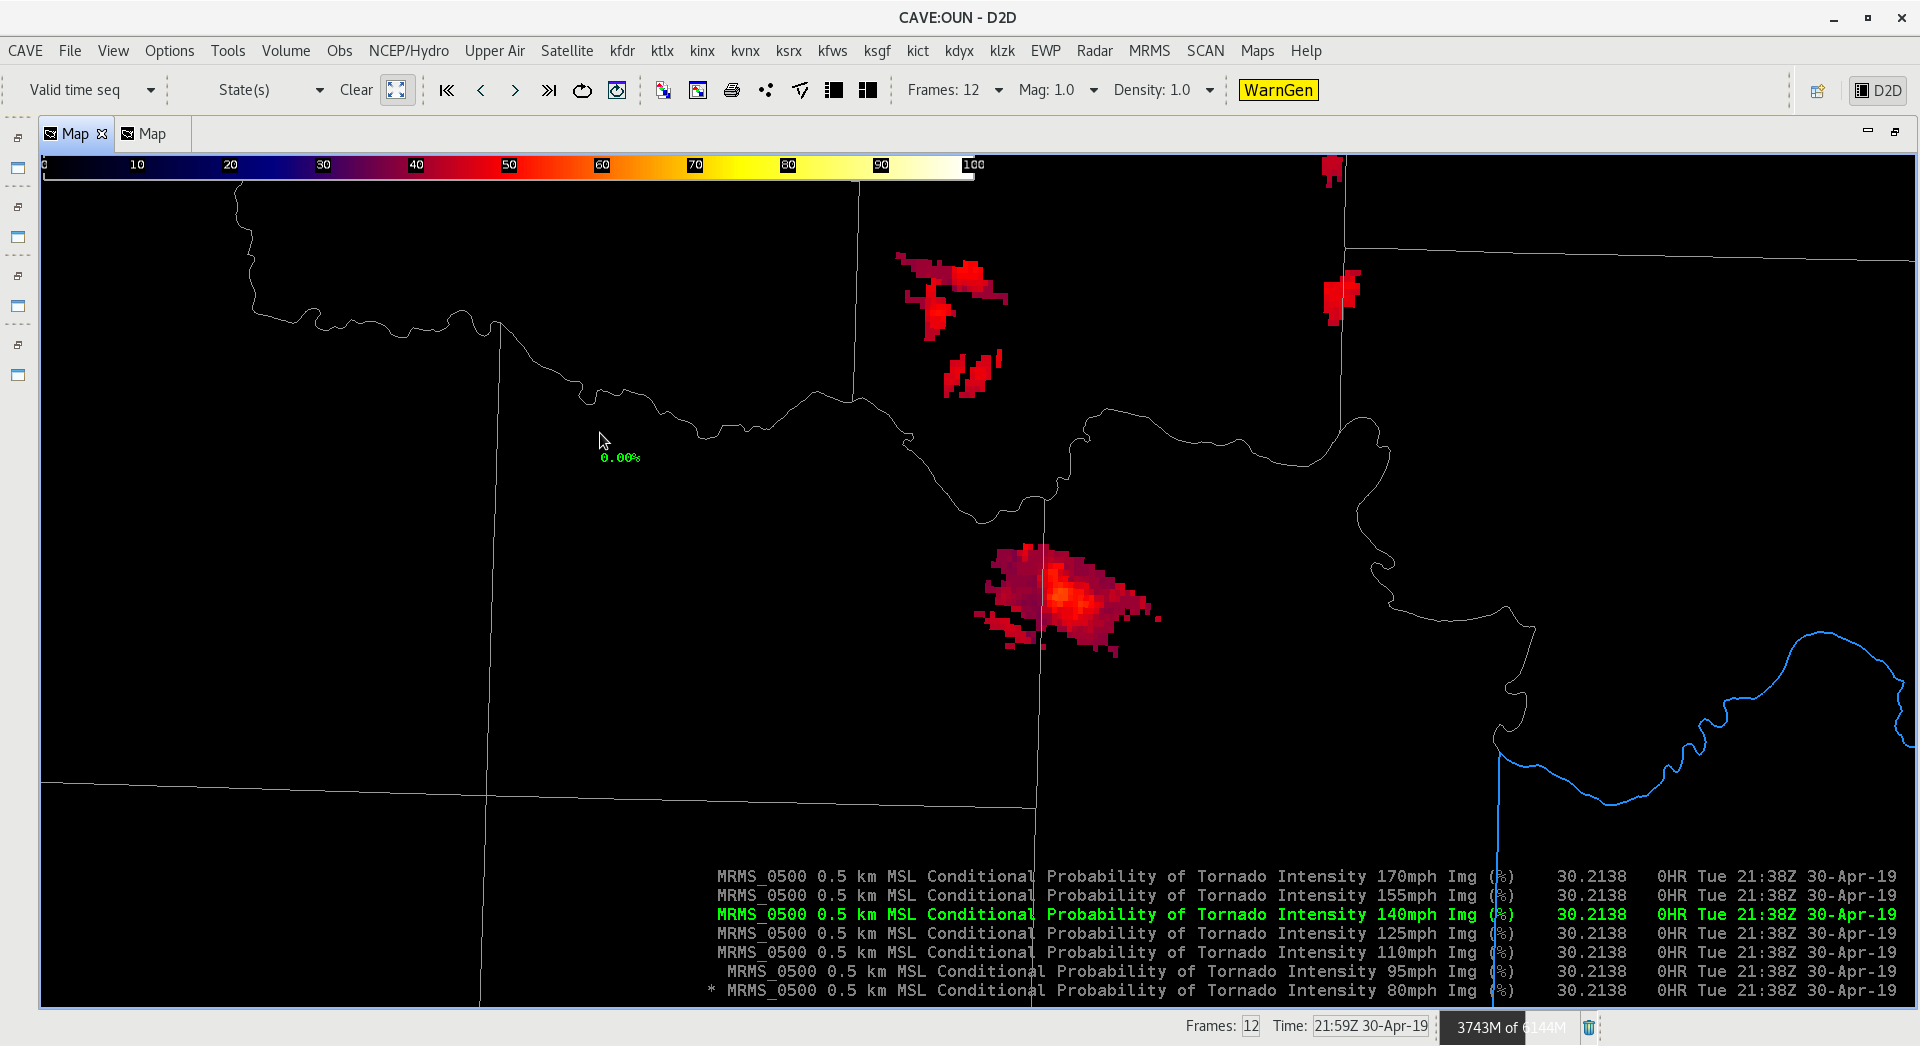
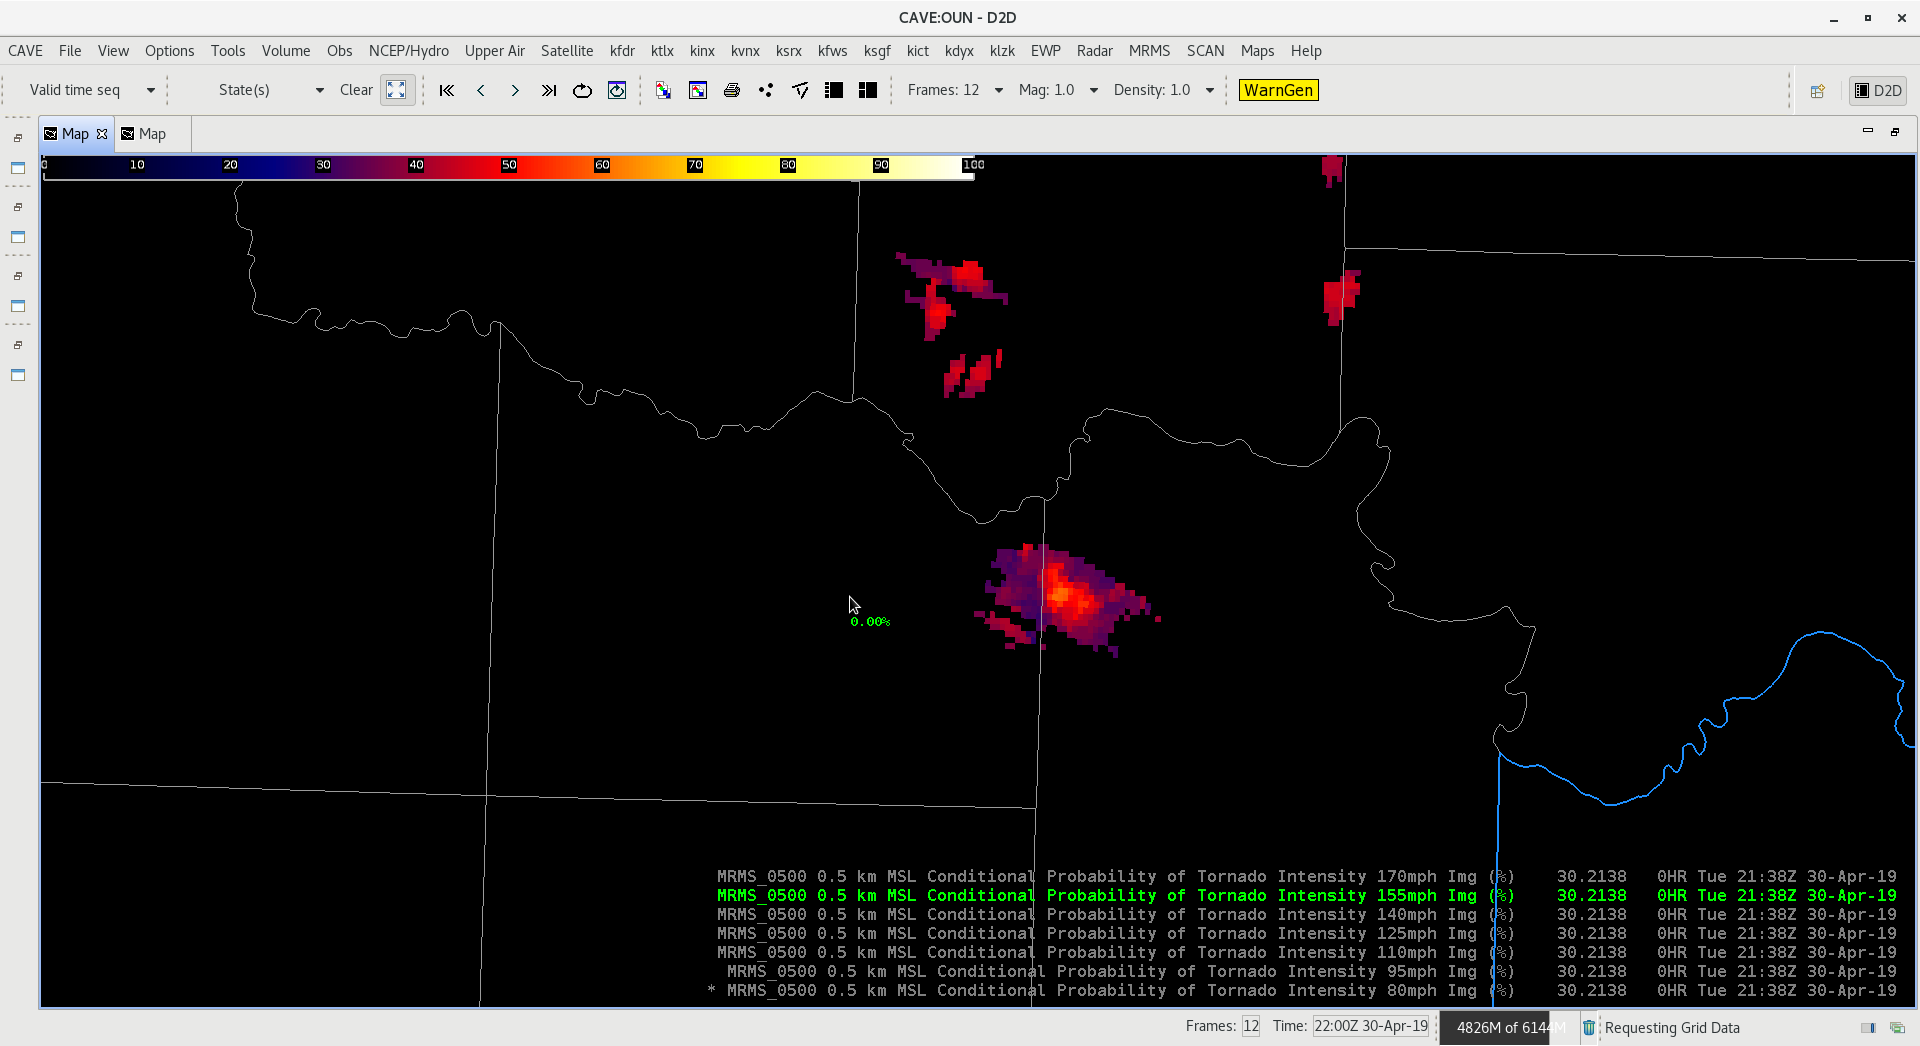
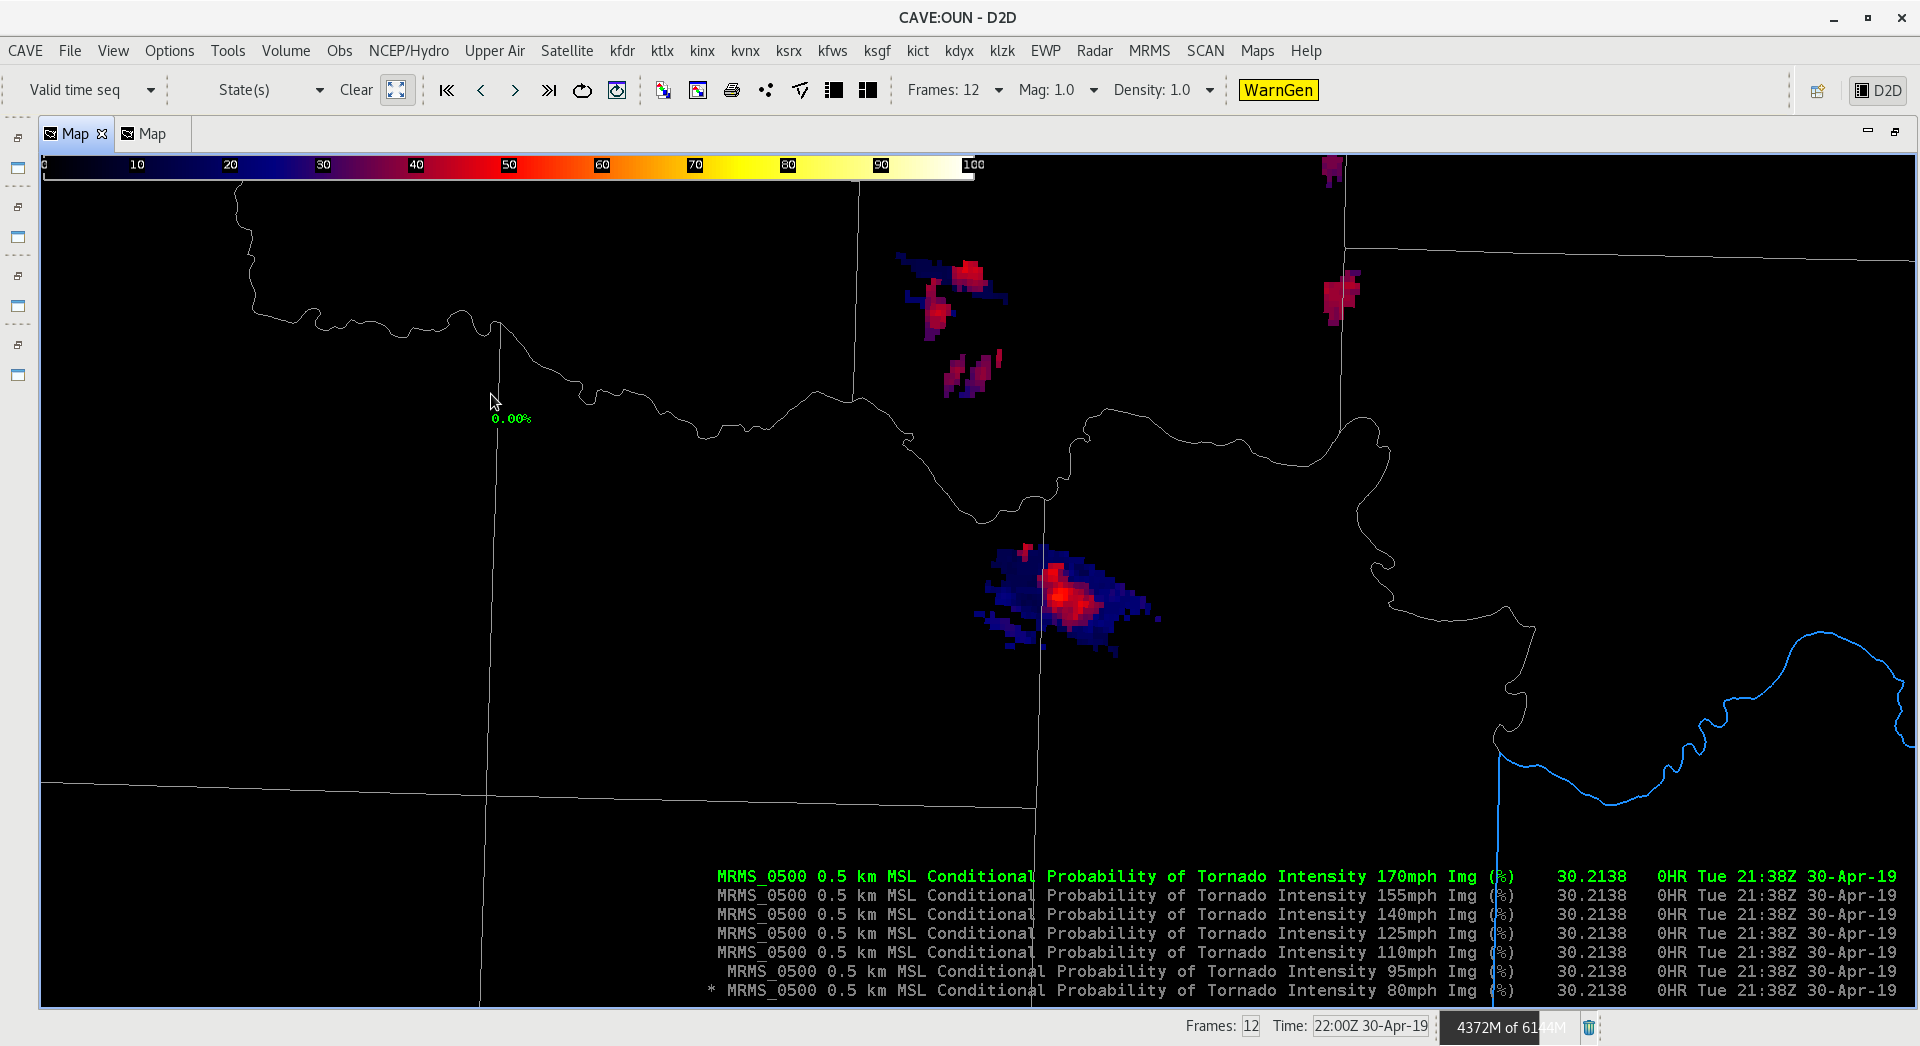
CPTI product shows very little change in the probabilities from one level to the next, therefore i recommend doing ranges with this analysis. This should highlight the threshold ranges of interest in a better way.
For example: Cat 1 (80-110mph), Cat 2 (125-155mph), Cat 3 (170+ mph)
-Jake Johnson
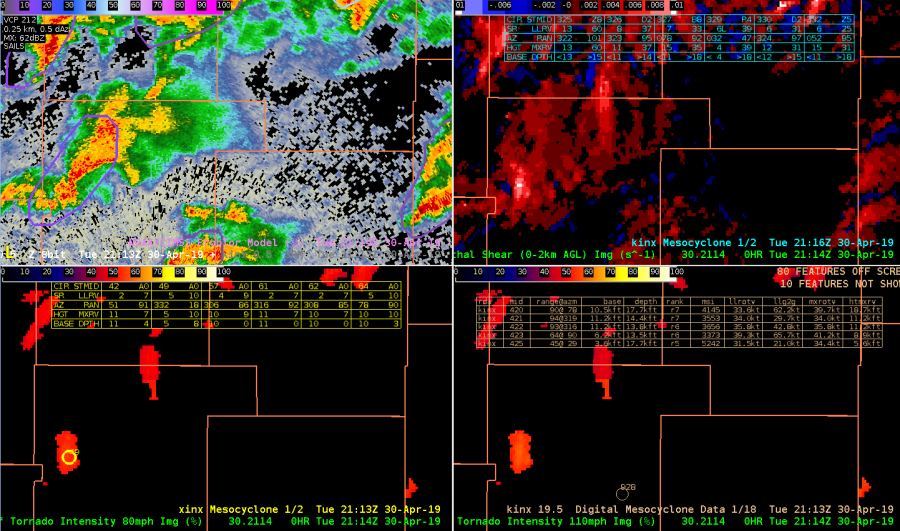
Cell merger – AzShear, CPTI and DMD comparison
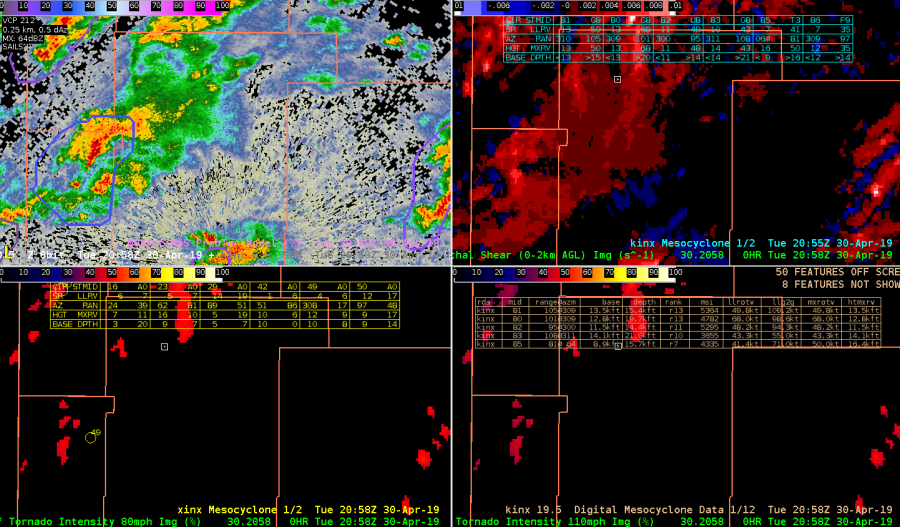
Gonna take a look at SC merger noting two small SC storms WNW of KINX radar @ 2058UTC. Prob TOR with these storms ~ 25% at this time with generally weak AzShear with stronger northern storm.
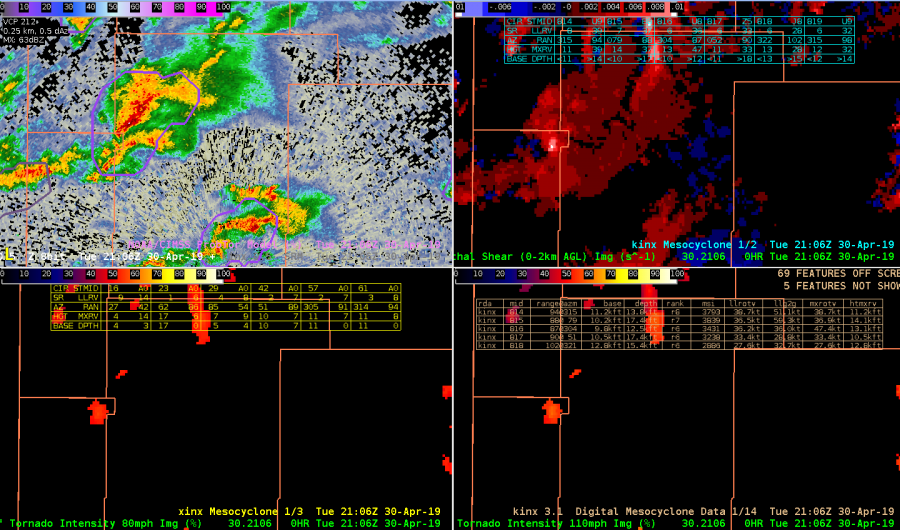
2106 UTC – just before storm merger see uptick in Azshear (0-2 km) with slight increase in CPTI products (50-52 %). DMD output not providing any useful information on these storms at this time probably. ProbTor ~ 10%
After merger @ 2114 UTC although not much change in AzShear, CPTI probabilities do increase some to 55 to 60%. Note that only the XDMD mesocylone algorithm displays a mesocyclone icon at this time while legacy DMD products do not.
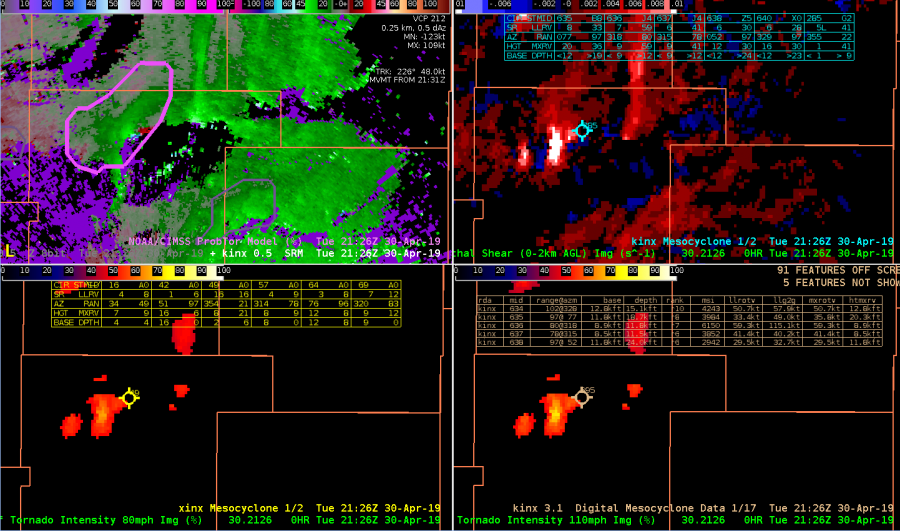
2126 UTC – ProbTor rapidly increased to 77% with marked increase in AzShear. CPTI products also near 70% (110 mph). Now all three DMD products display icon by this time. BUT the XDMD seemed to identify mesocyclone sooner than legacy products. This was encouraging.
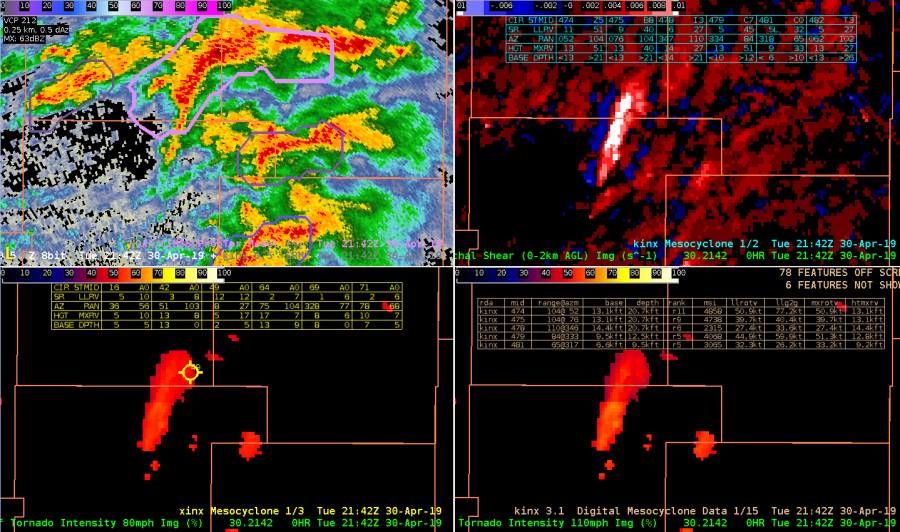
2142 UTC – looks like storm looses organization as inflow may have been disrupted. AZshear becomes elongated with CPTI values falling notably. Encouraging to note the character of AzShear (became elongated ) was consistent with the less organized storm (velocity structure). ProbTor falls to ~ 65%. Note the xDMD algorithm did still correctly identify shear couplet (SRM not shown) where legacy algorithm fails. XDMD performed much better and and had greater temporal continuity than legacy product in this example. In this more complex storm interaction example appeared XDMD was able to better identify and retain areas of shear/rotation compared to legacy.
-Quik TWIP