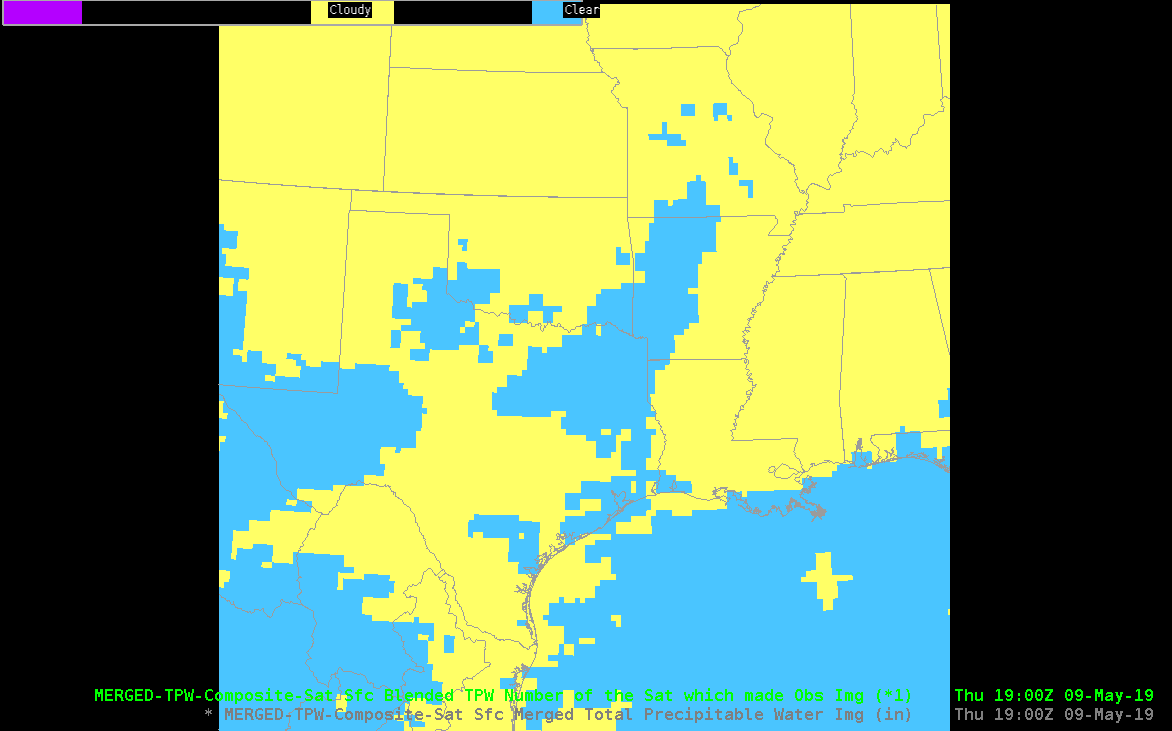
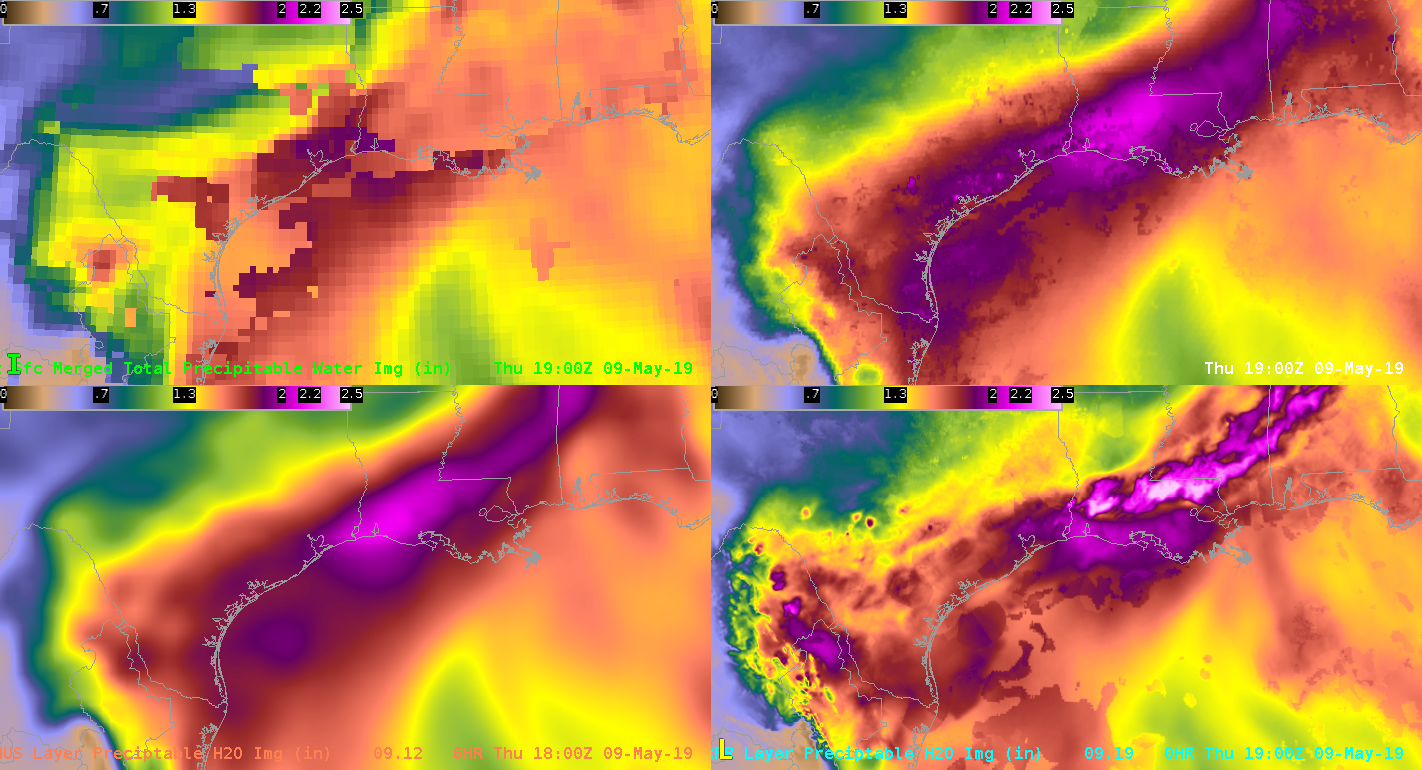
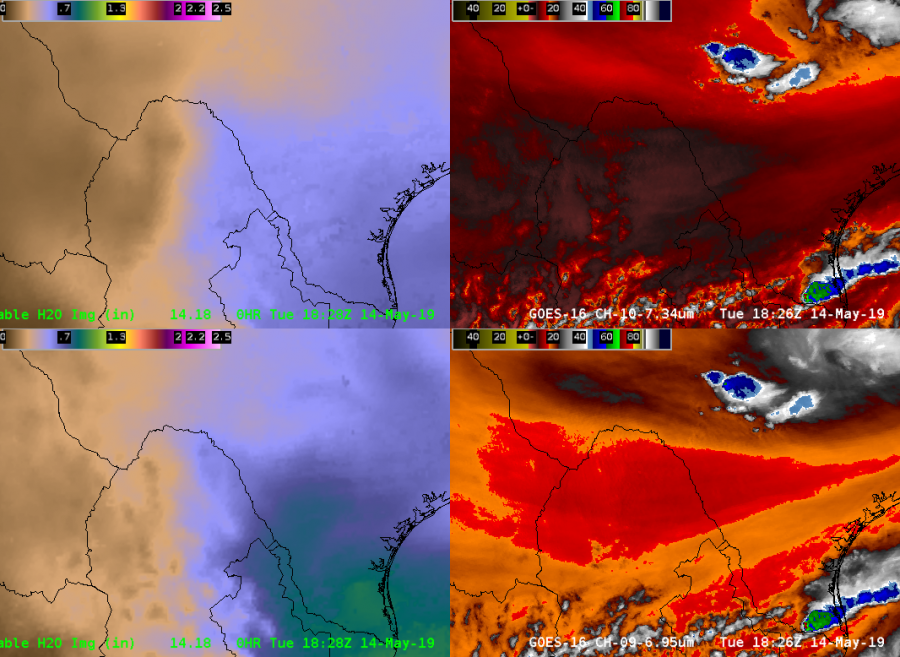
A strong low level moisture gradient showed up on the Sfc- 0.9sigma AllSkyLAP image early in the afternoon south of the Big Bend region in Mexico. This could serve as an initiating boundary later in the afternoon.
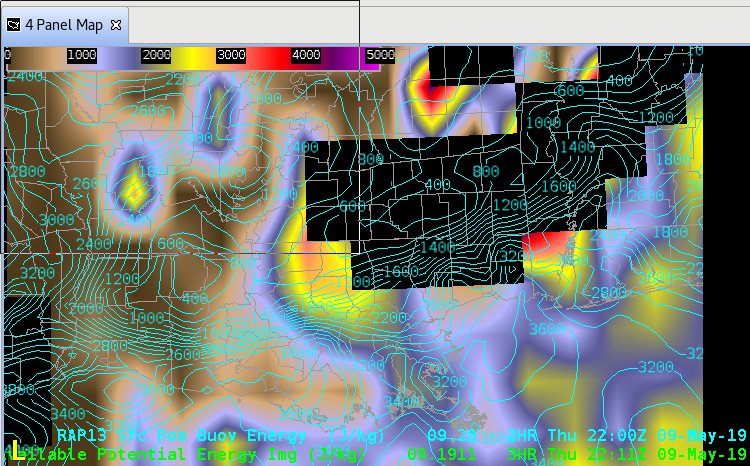
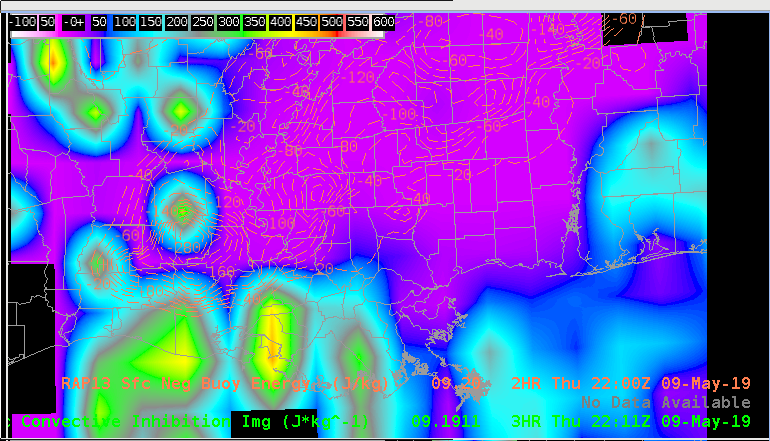
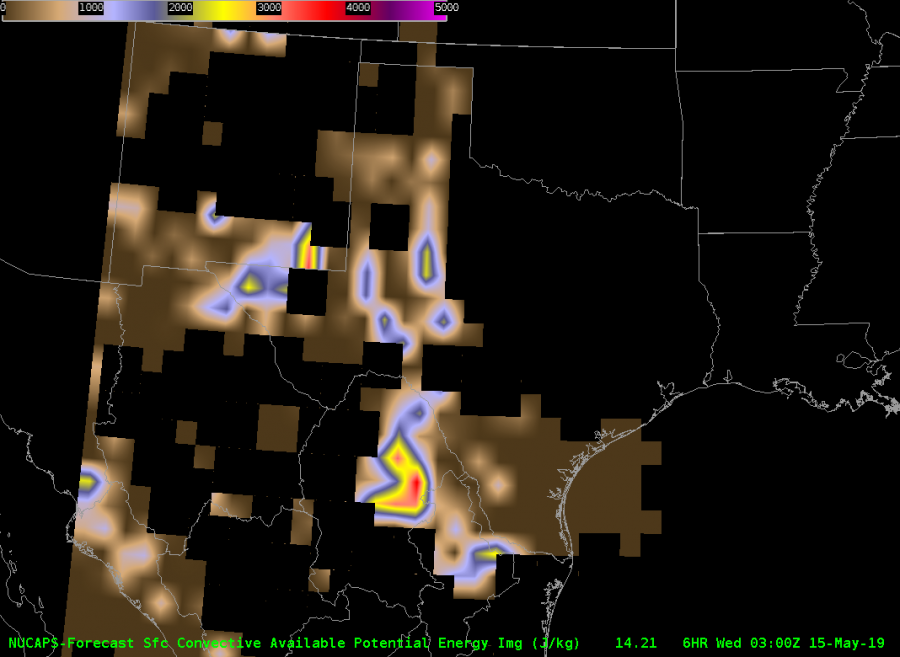
A look at the NUCAPS Forecast CAPE from the ~21Z pass showed over 3000 J/KG of CAPE at the 03Z Forecast hour. Earlier forecast hours (00-02Z) were missing data, however, if you interpolated between available data points, it seemed as though there was a maxima of CAPE in the area. It was noted that a storm developed around 21Z.
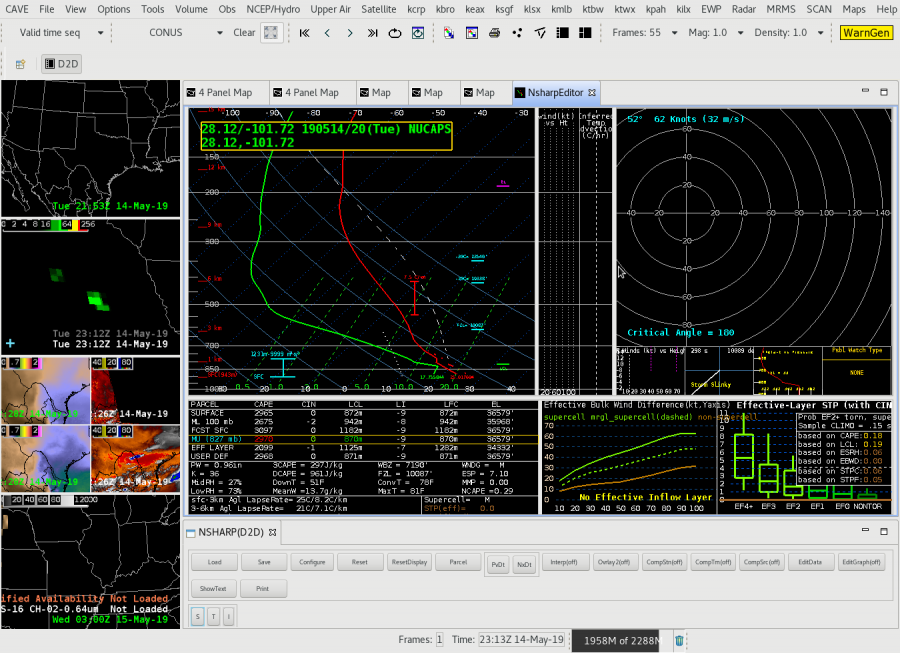
To gain more detail, I clicked on a NUCAPS modified sounding east of the low level moisture gradient in the vicinity of the storm. It’s clear this is a very unstable sounding, capable of producing (at least) large hail. This clued me in on how fast the storm could become severe. Certainly would not have had a special 19-20Z sounding in this area without NUCAPS and would have solely relied on model forecast soundings.
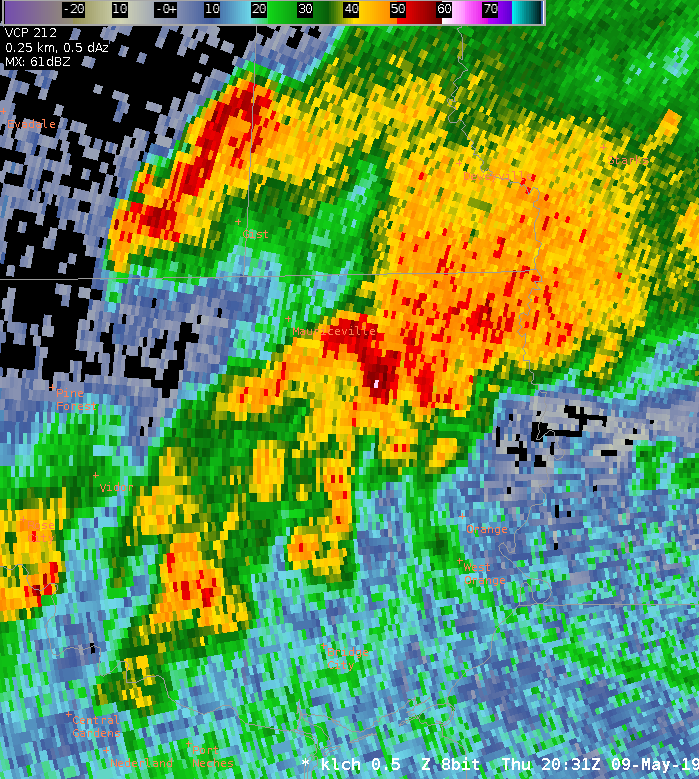
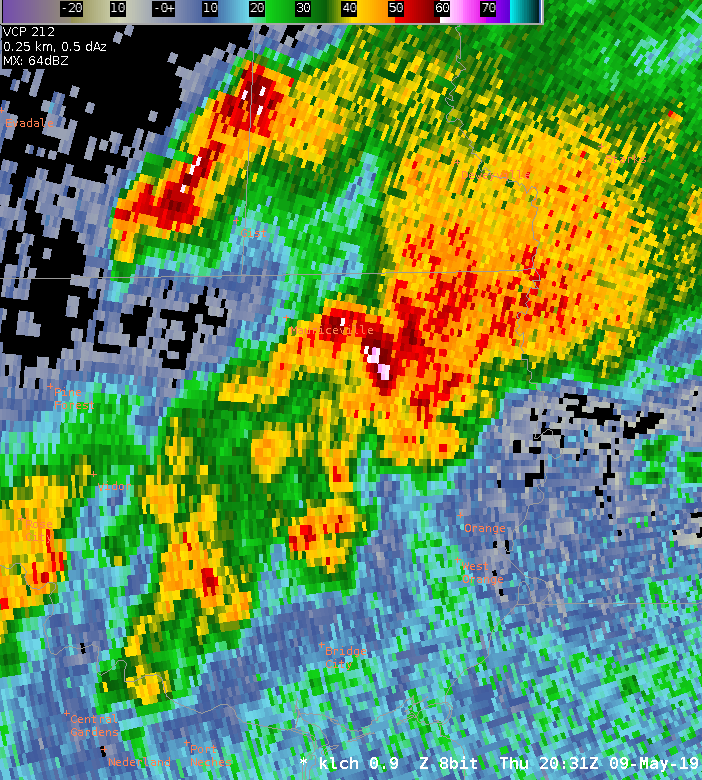
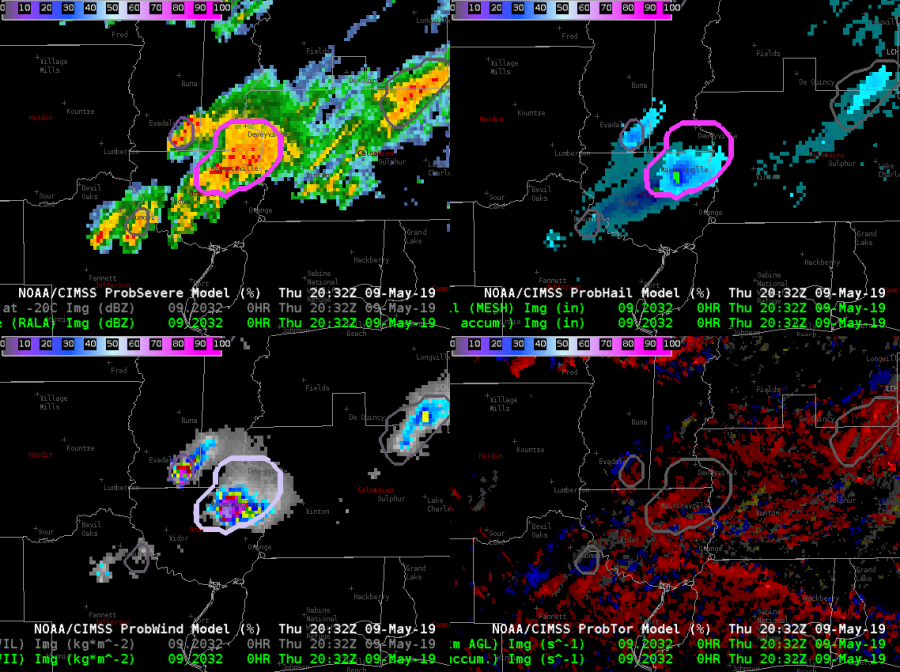
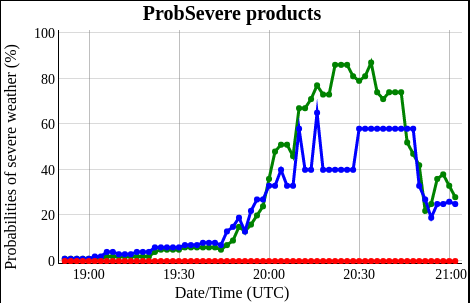
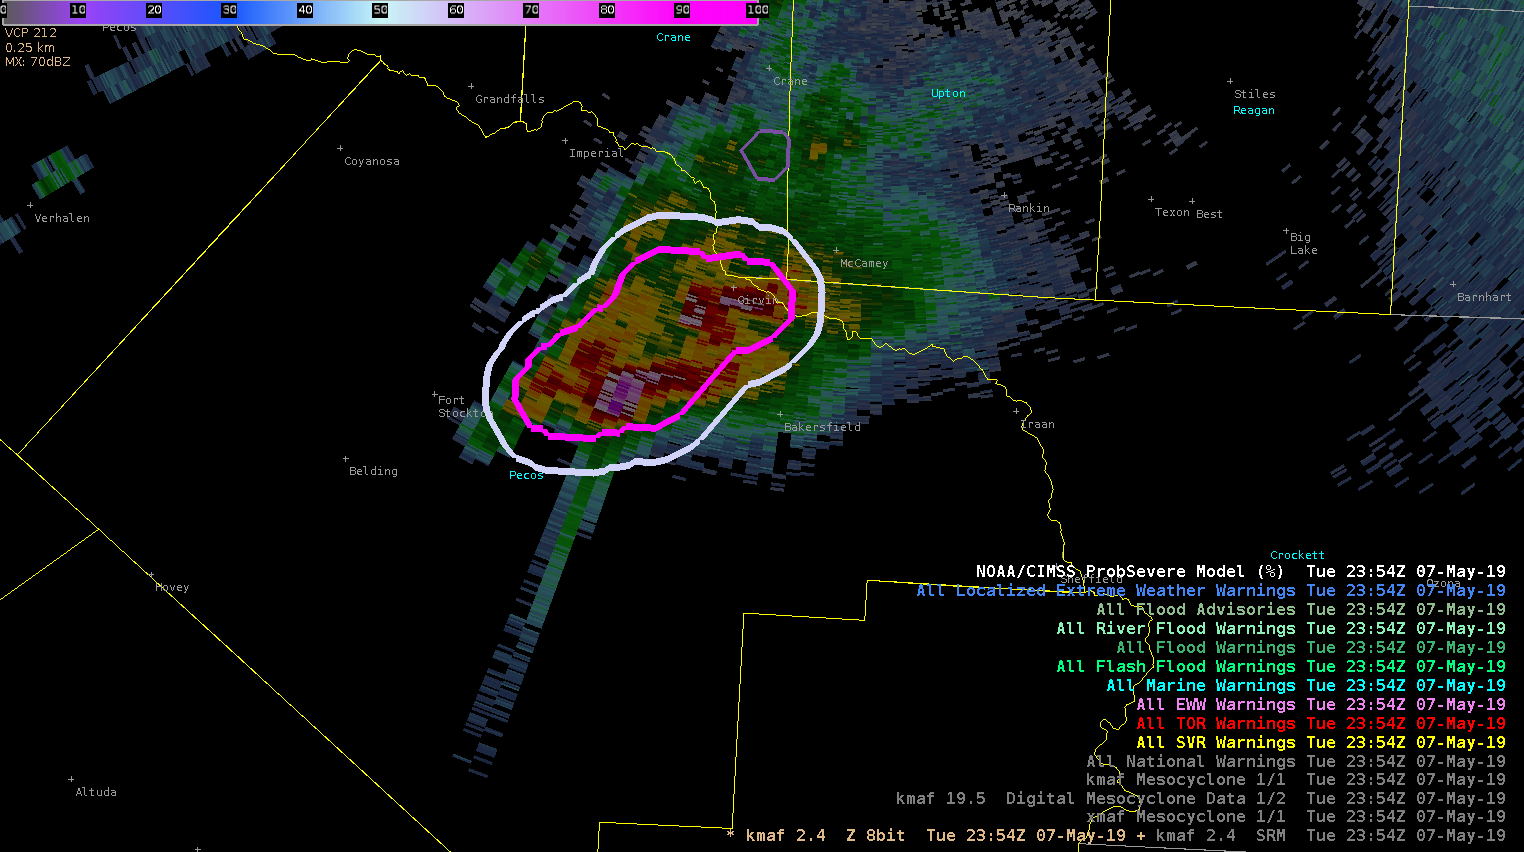
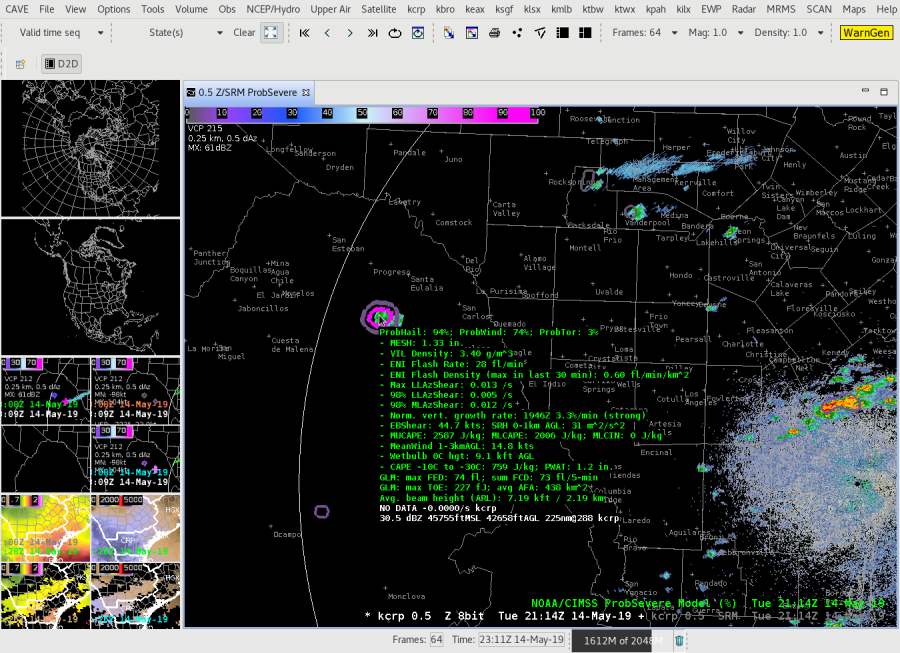
Even though it is far away from the KCRP radar, prob severe quickly showed the developing storm ramp up and have very high severe hail (and wind) probabilities (roughly within 15 minutes of initiation). If the NUCAPS forecast is right, this storm would likely continue into the evening given the abundant instability.
-Tempest Sooner
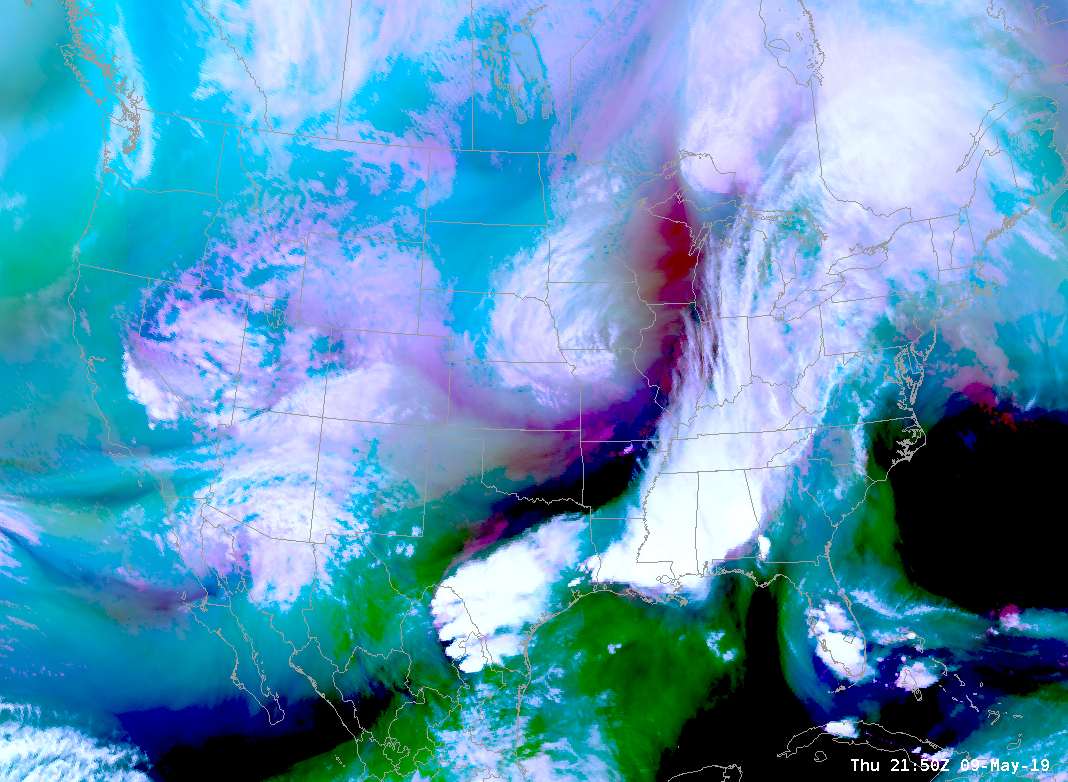
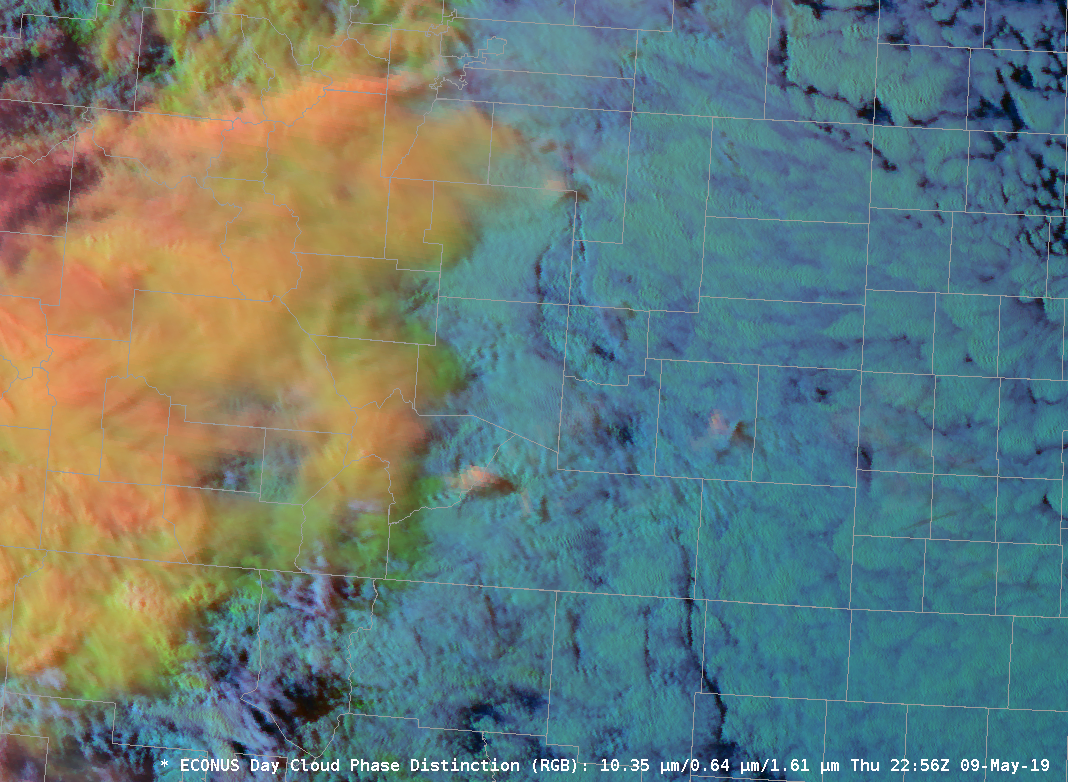 However, I wasn’t aware of some of the RGB combinations that I’ve been exposed to here at the HWT. The features that can be picked out by applying coordinating colortables to multiple channel views is simply astounding. I’ve used the simple water vapor, day cloud phase distinction, day convection, differential water vapor RGBs this week….I’ll be making a phone call to my broadcast weather vendor. I know I’ll need to get some other broadcasters on board with me to lead a charge, but count me in. Until then, I’ll be livin on the CIRA RMMB Slider site!