An official website of the United States government
Here’s how you know
Official websites use .gov A
.gov website belongs to an official government
organization in the United States.
Secure .gov websites use HTTPS A
lock (
) or https:// means you’ve safely connected to
the .gov website. Share sensitive information only on official,
secure websites.
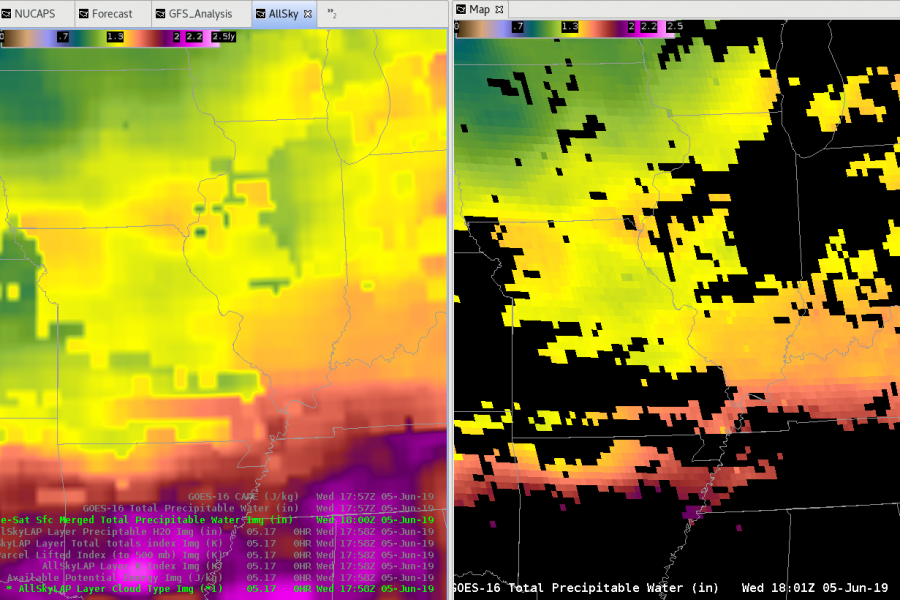
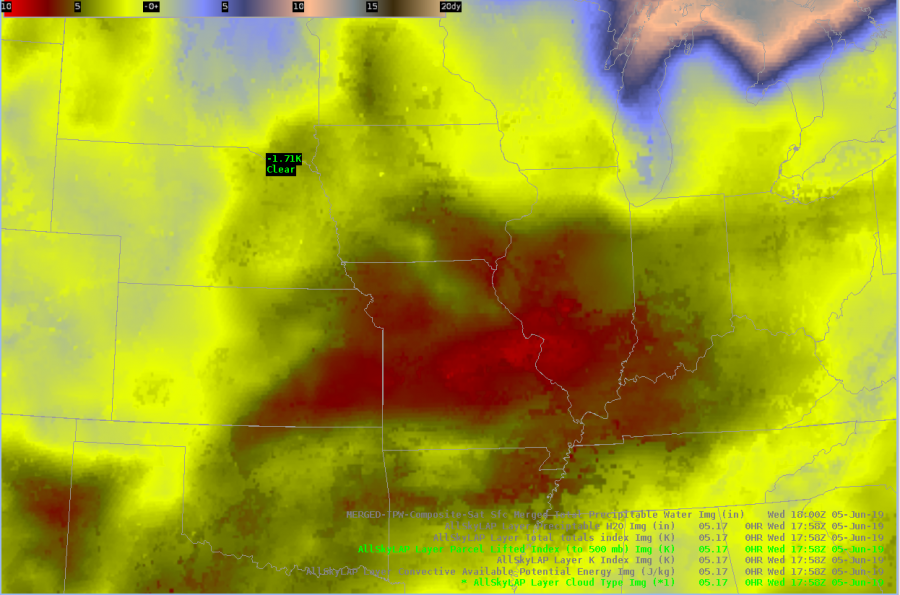
Below is a comparison of two different TPW products (AllSkyLAP layer Precipitable water and Merged TPW Composite Sat Sfc Merged Total Precipitation Water) compared to RAP Analysis from the SPC Mesoanalyst page.
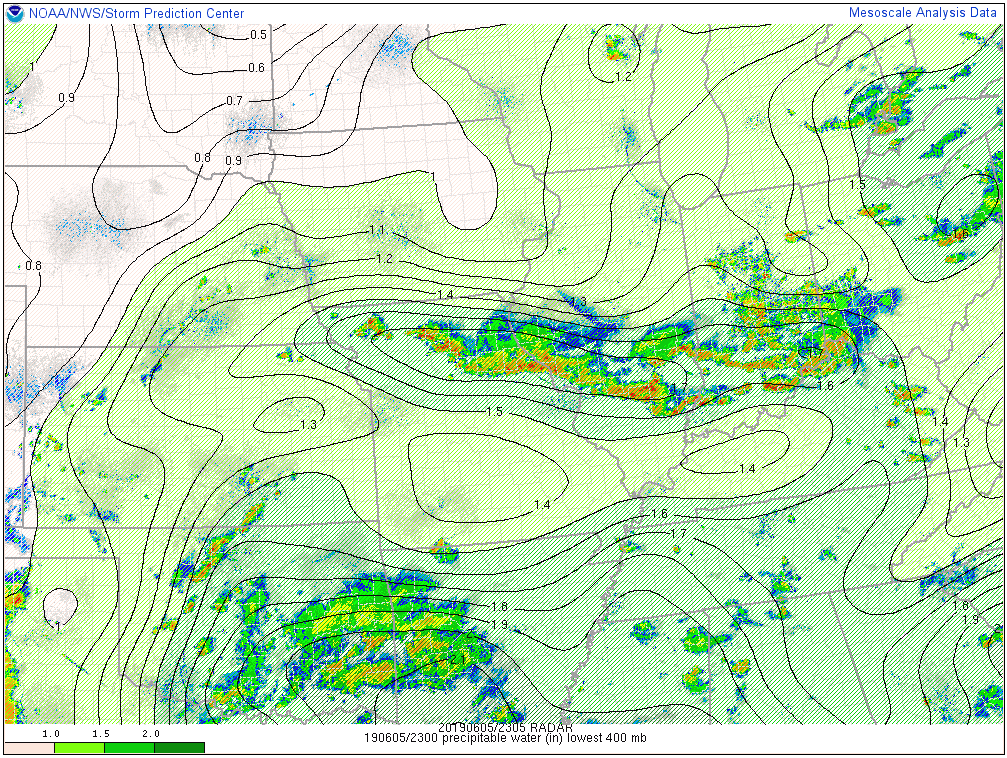
Control group: SPC Mesoanalysis Precipitable Water
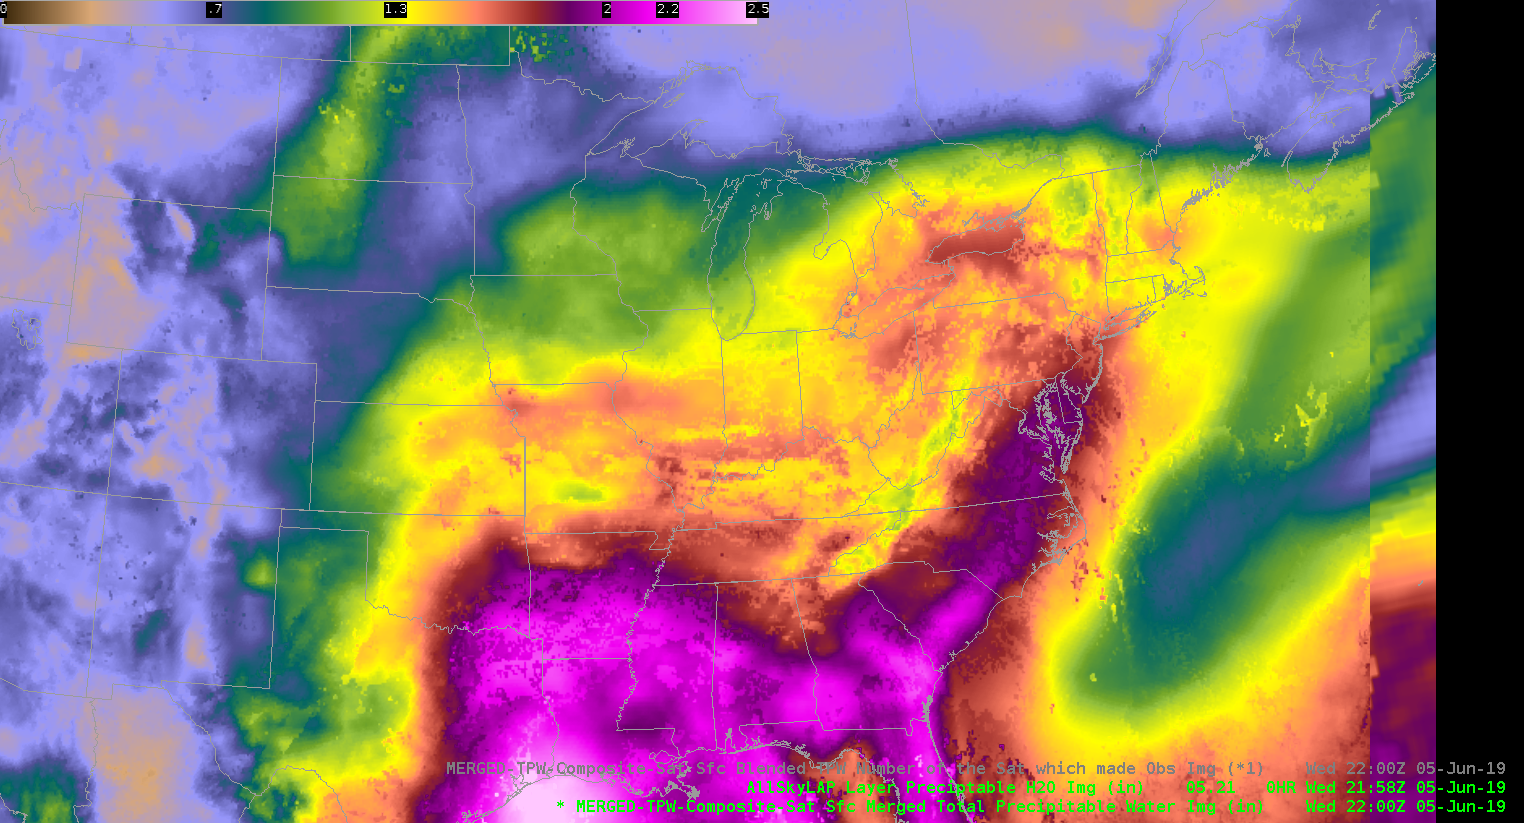
The AllSkyLAP product (below) seems to do a better job at “painting the picture,” however, it’s reliance on the GFS model often leads to a delay in PWAT drops in areas of convection. This is highlighted the best across central IL, where RAP Analysis shows PWATs in the 1 – 1.25 inch range while the AllSkyLAP product shows values closer to the 1.5 inch range straight from GFS output.
AllSkyLAP
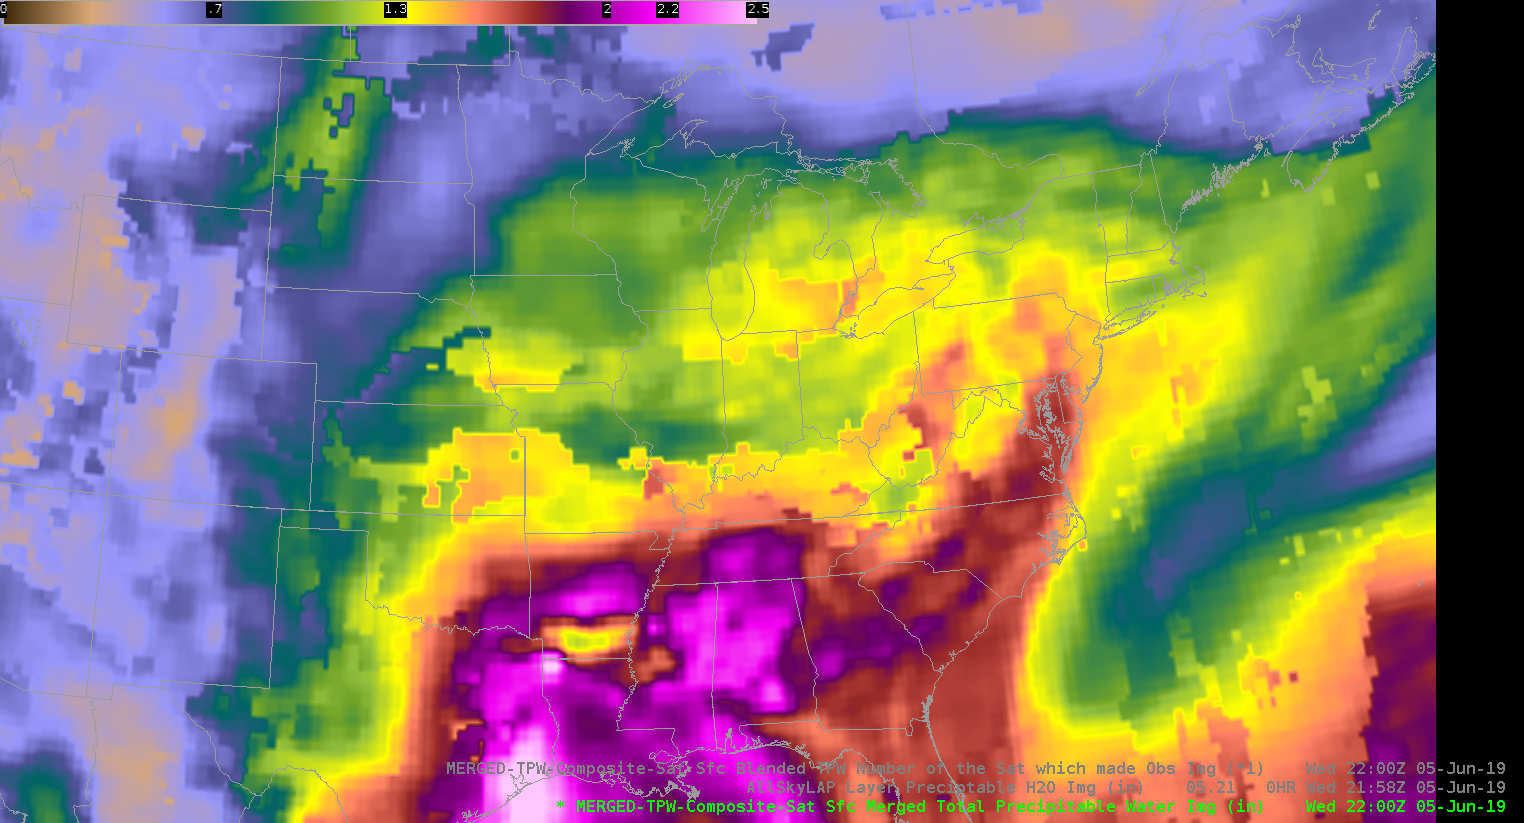
TPW (below) does a better job at accounting for this, at least across the central IL study area, resulting in more realistic 1.1 to 1.3 inch values.
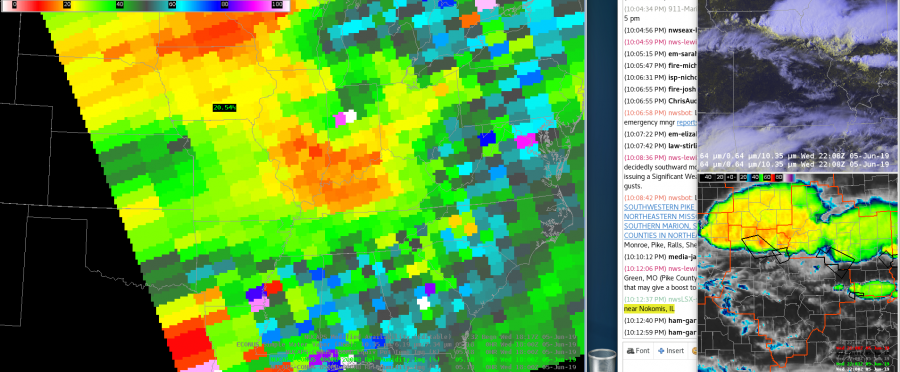
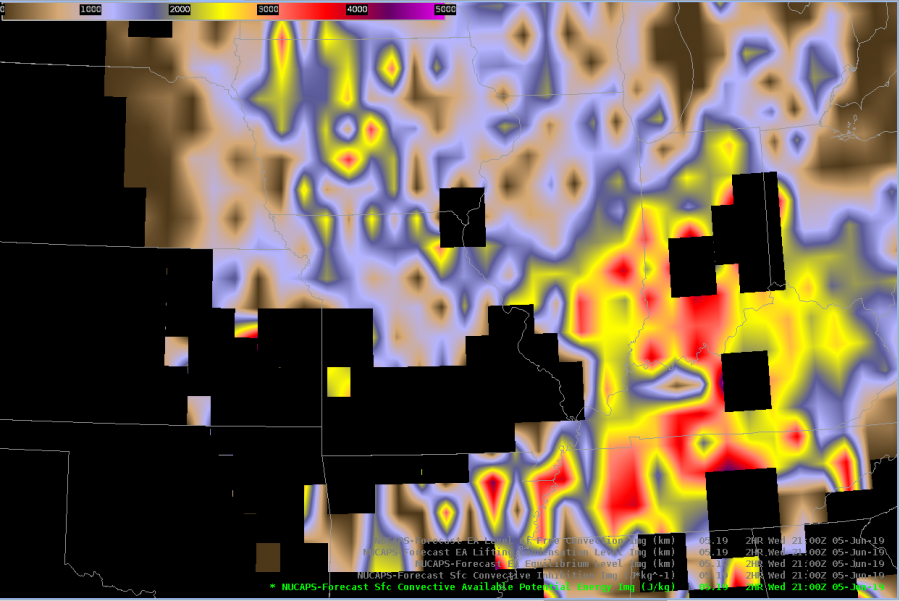
The effective surface cold front remains well north of Illinois, draped west to east across central Wisconsin as of the 22z surface analysis. Further south across the state, two main forcing mechanisms continue to play host to strong to severe convection. The first (southernmost boundary) is nearly stationary acting as the area of primary convergence, while also service as the dividing line between 70 degree dewpoints (south) and mid to upper 60s (north). The second is an outflow boundary loosely associated with earlier day convection, which continues to race southward driven largely by cold pool propagation. This boundary is anticipated to overtake the primary boundary over the next few hours, ushering the majority of shower and storm activity south of the Lincoln IL CWA later this evening (Showcased well by NUCAPS forecasts). With ample CAPE (1500 – 2500 J/KG per the 22z AllSkyLAP product) remaining along and south of said boundaries, storms are expected to retain their intensities through the early evening hours. Primary threats will remain damaging wind gusts, large hail, and flash flooding primarily in areas that see repeat thunderstorm convection this afternoon and evening.
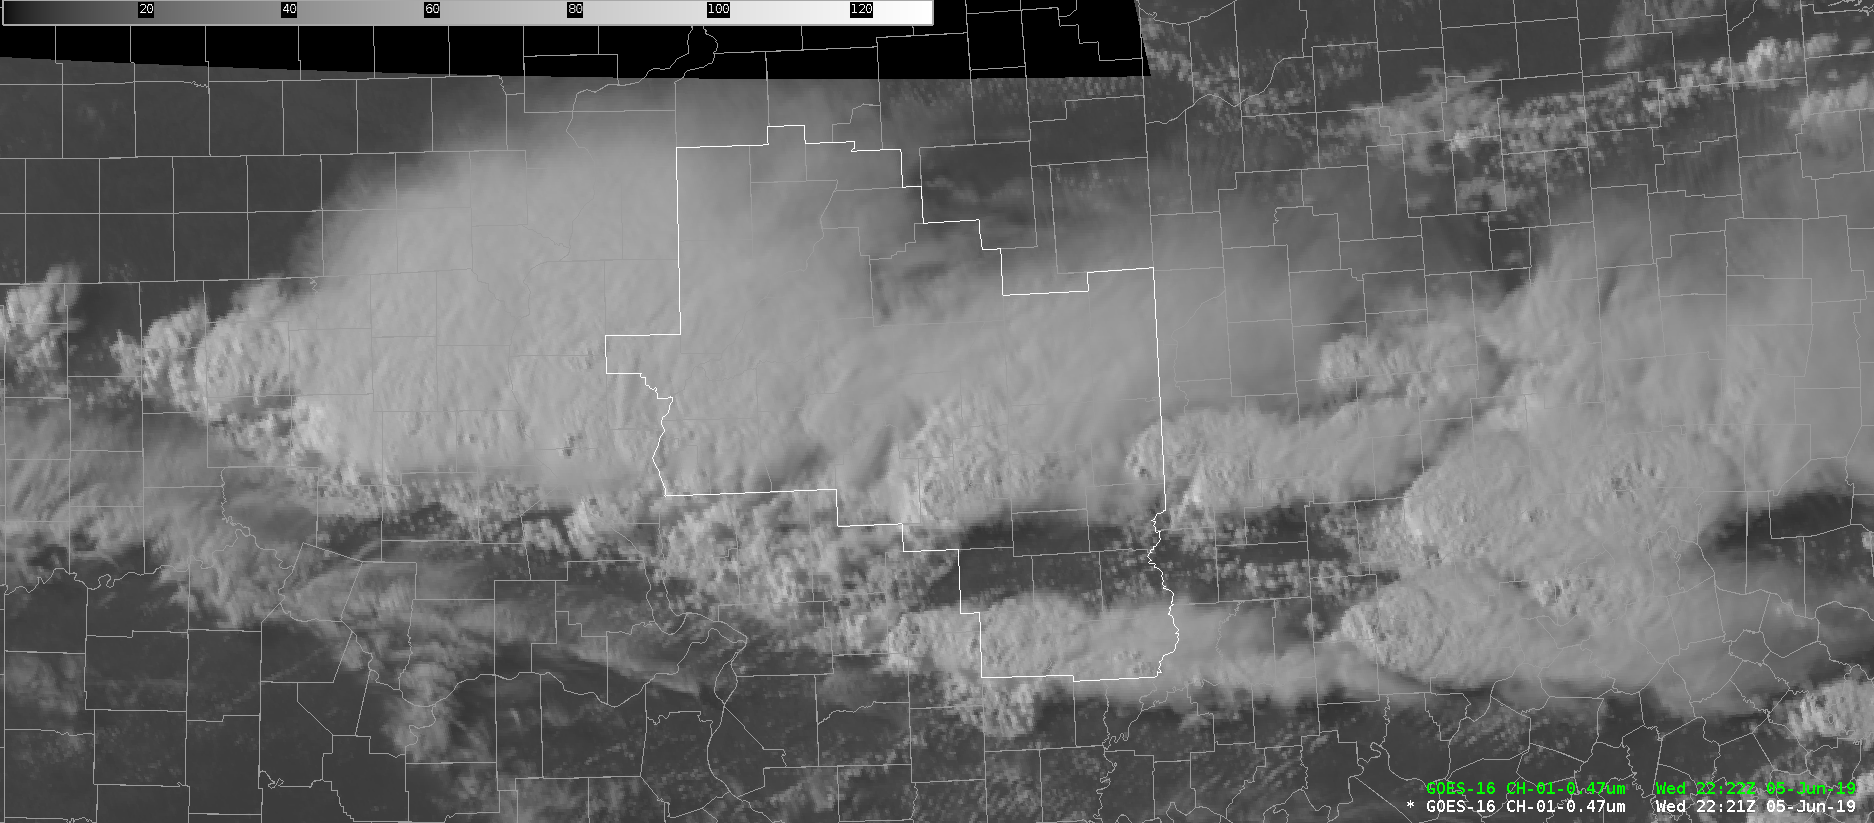
IR and RGB imagery showing outflow coming out of the storms in the eastern LSX area not firing up additional storms. NUCAPS 400-200 mb RH product shows quite a bit of drier air that the line is pushing into. More moisture is west of the MO/IL line, so that part of the line may have a better chance to maintain themselves/develop new cores ahead of the line along that outflow.
Band of storms dropping in from the north is moving into an environment favorable to at least maintain severe wind gusts as well as some hail potential. AllSky CAPE parameter shows the line moving into airmass with 2500 J/kg, similar to values given by earlier ILX special sounding and recent modified NUCAPS sounding. Latest RAP shows DCAPEs up to 1400 J/kg, indicating good potential for severe wind gusts. Had a couple of reports of blackout conditions from blowing field dirt along I-55 near Litchfield.
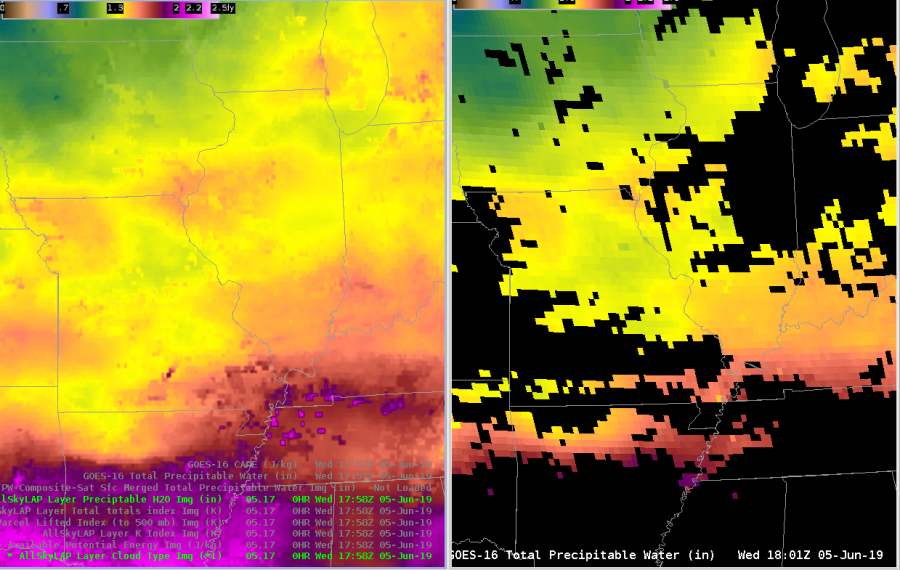
Total PW looks good from the operational version (minus the blacked out data, of course). It is a little blotchy on the merged TPW (left). A similar comparison below of the AllSky TPW and Operational product.
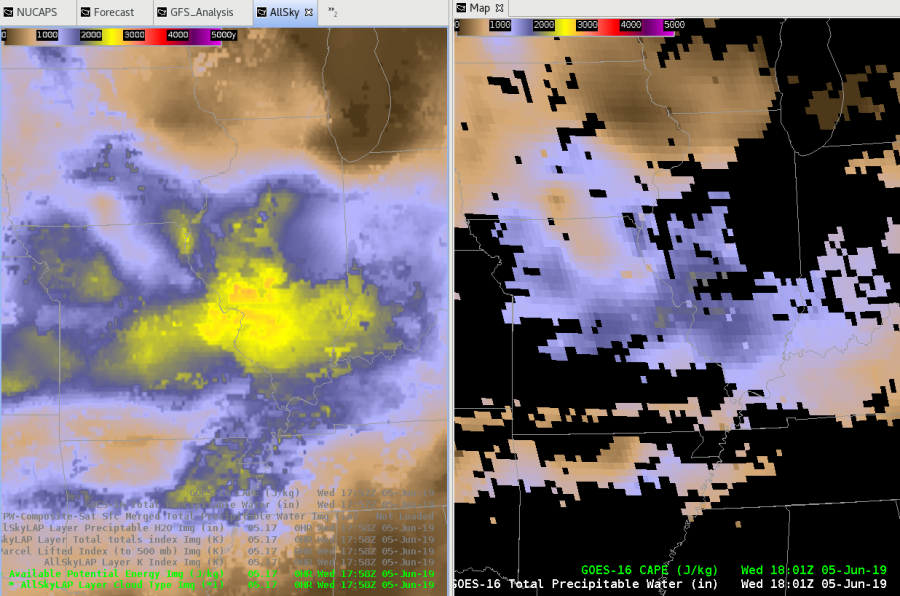
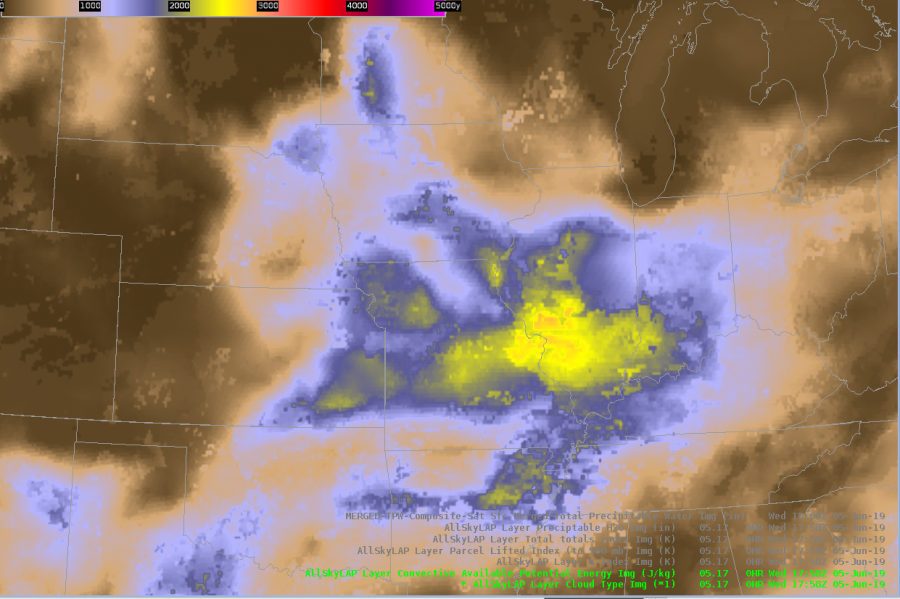
CAPE is a different story.
AllSky calculations are mostly in a clear airmass, as you can tell by the operational product not being blacked out. Peak values on the right are in the 1700-1800 J/kg range, whereas points on the left peak at 2600-2800.
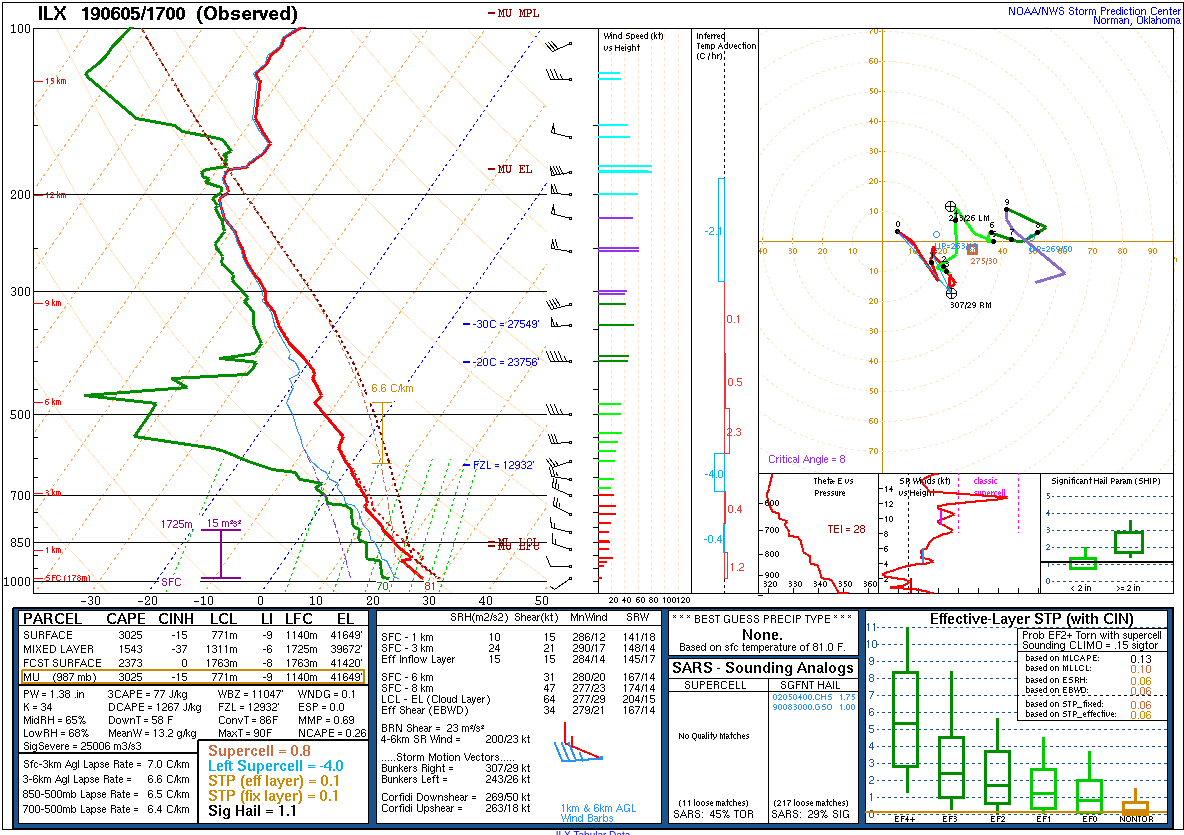
Modified NUCAPS sounding near ILX is pretty similar to KILX special sounding taken at 17Z! MUCAPES both around 3000 and LI -9.
Values similar to AllSky at 18Z.
Those CAPE values near 2500 J/kg…also similar.
This similarity gives us some confidence in new forecasts, especially in clear sky regions out ahead in the AllSky data.
The forecast NUCAPS CAPE does not show much to the south of our line…and based on clear skies and warm conditions to the south would tend to lean away from this forecast.
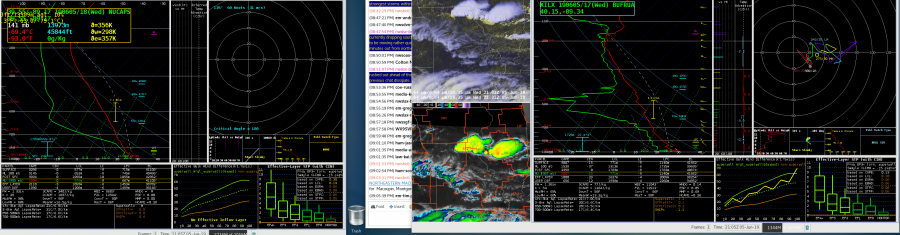
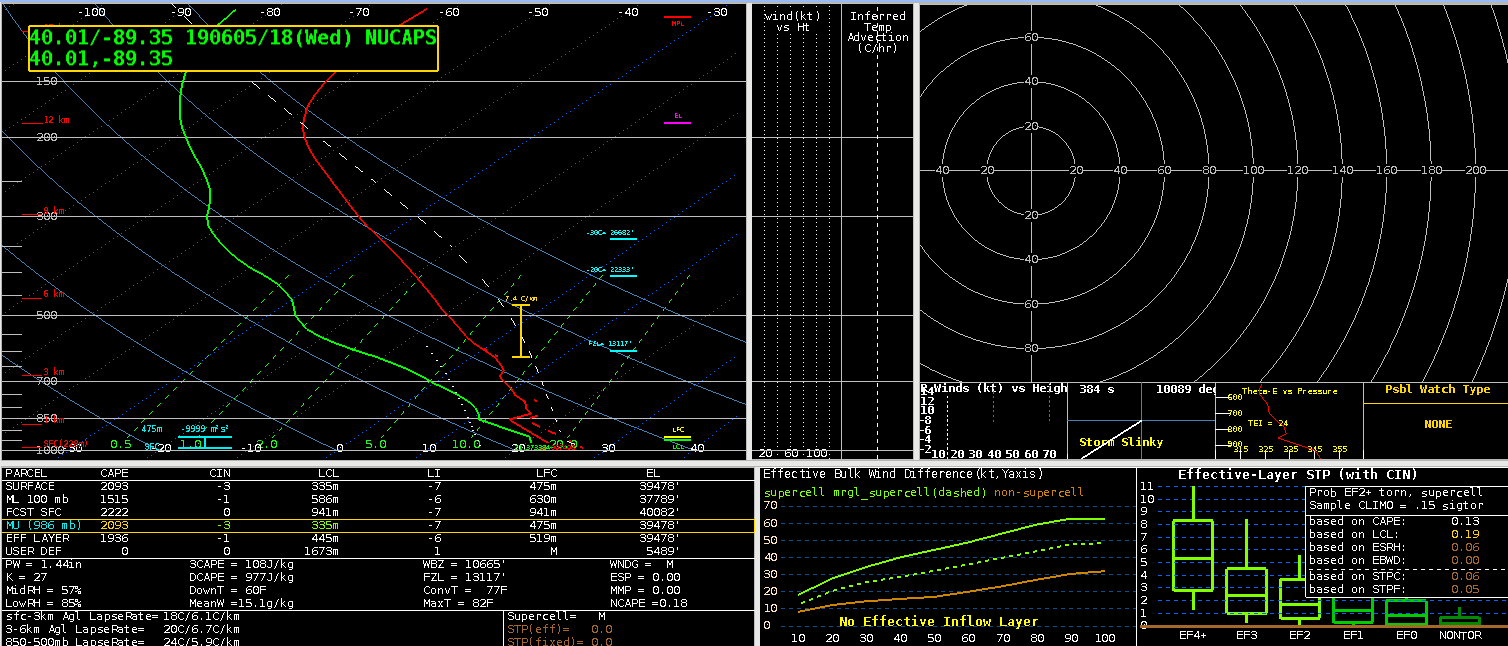
Above is a special sounding released by the ILX office around 17z on June 5th, 2019. Below is the output for the NUCAPS and sequential Modified NUCAPS sounding from around the same time and as close to the same area as possible.
The NUCAPS pass pictured above was primarily in a cloud-free environment behind an old outflow boundary to its south and ahead of a developing line of convection to its north. Visually, it tended to underdue the CAPE values in the environment, especially in the low to mid levels.
The modified NUCAPS sounding (above) did show some skill in incorporating more accurate boundary layer conditions, which in turn, upped the CAPE values considerably (almost 2x in some cases). This brought the values into better agreement to the in-situ observation from NWS ILX with the exception of the SFC based CAPE which remained considerably underdone.
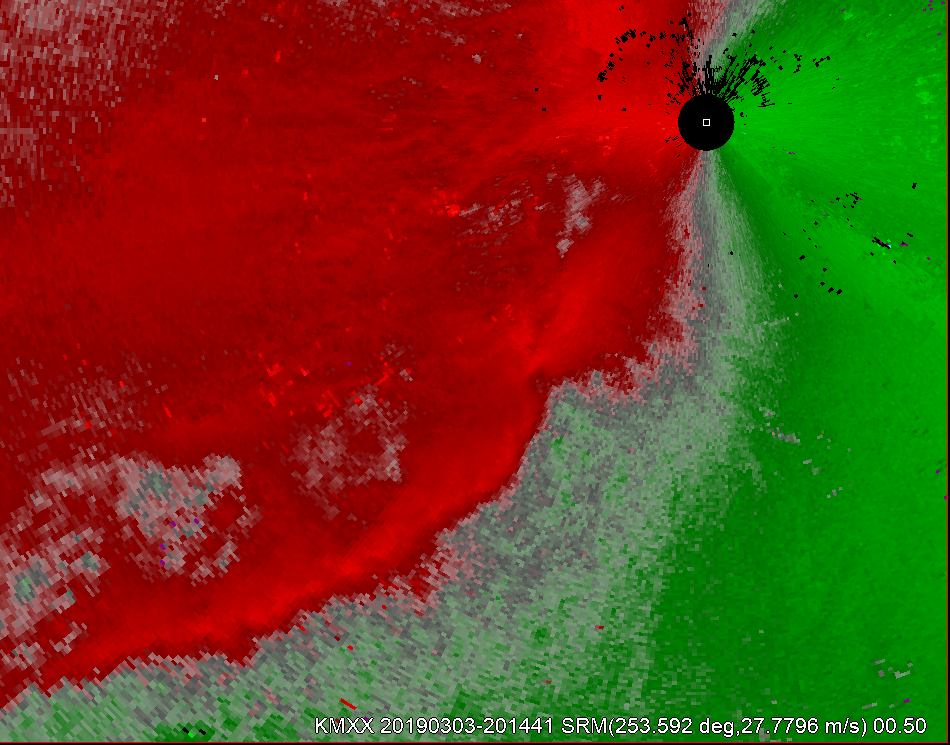
At 2014z the MXX radar showed a line of convection extending to the southwest of the radar location. SRM depicts convergence along the line but it is limited since it is down the radial. There are some notches in the reflectivity, and some wiggles in the convergence line, but there are not direct areas of rotation at this time.
2014z 0.5 reflectivity.2014z 0.5 SRM.
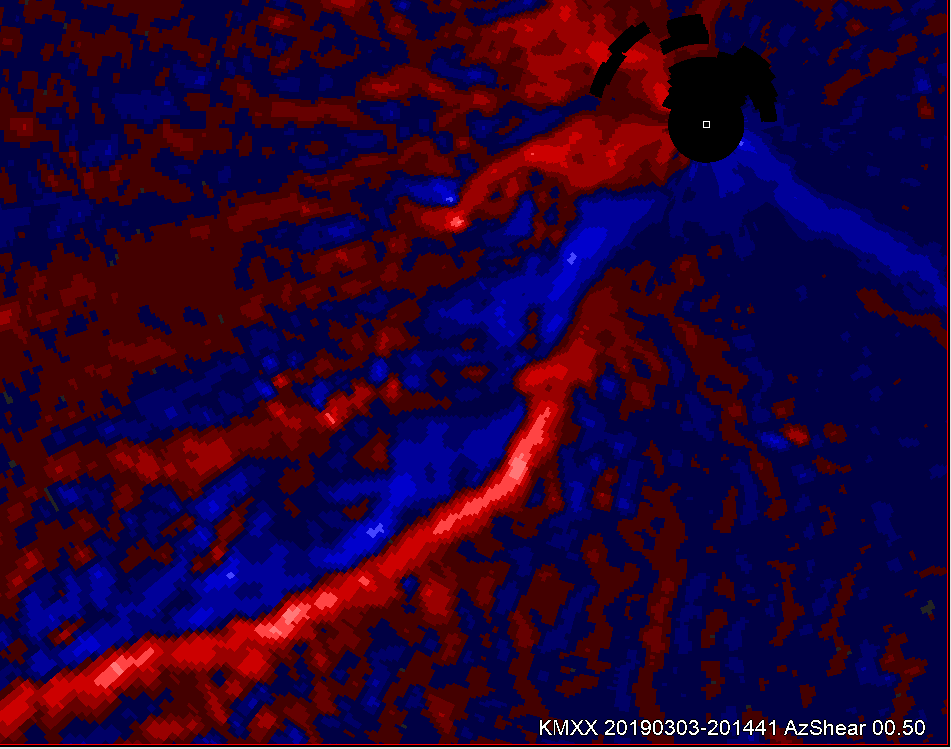
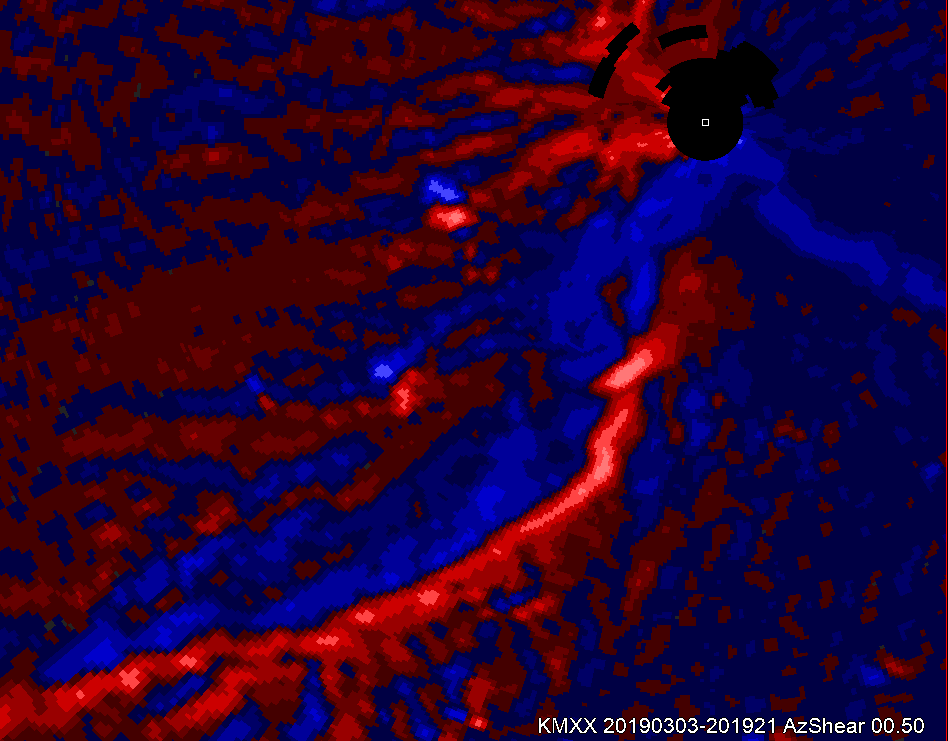
The single radar azimuthal shear supported the idea of a convergent line with a corridor of slightly positive values along the line.
2014z 0.5 AzShear
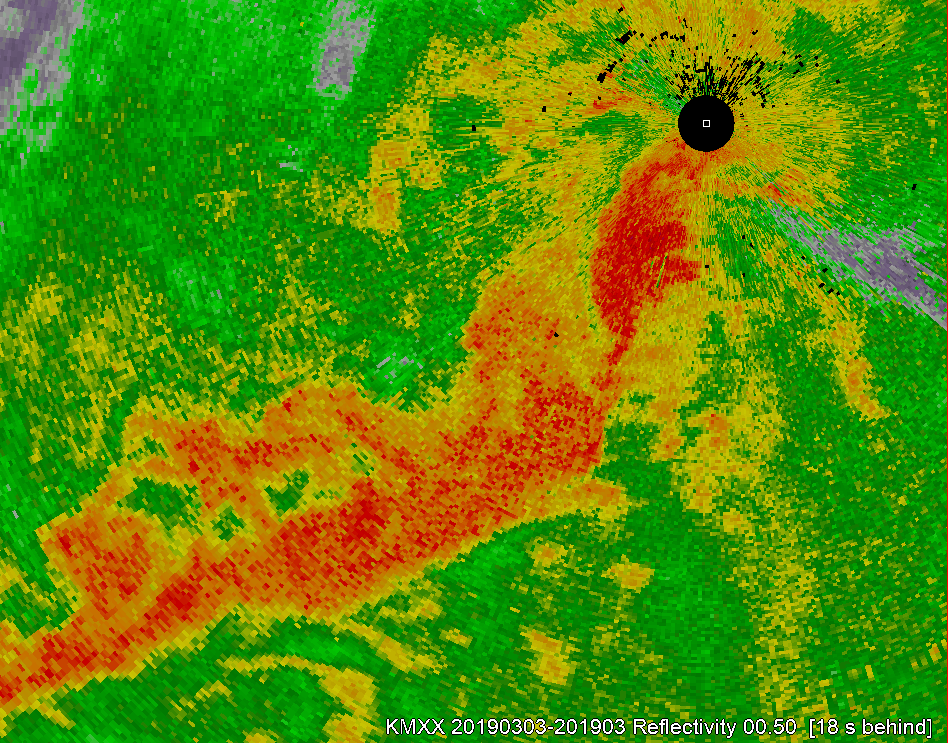
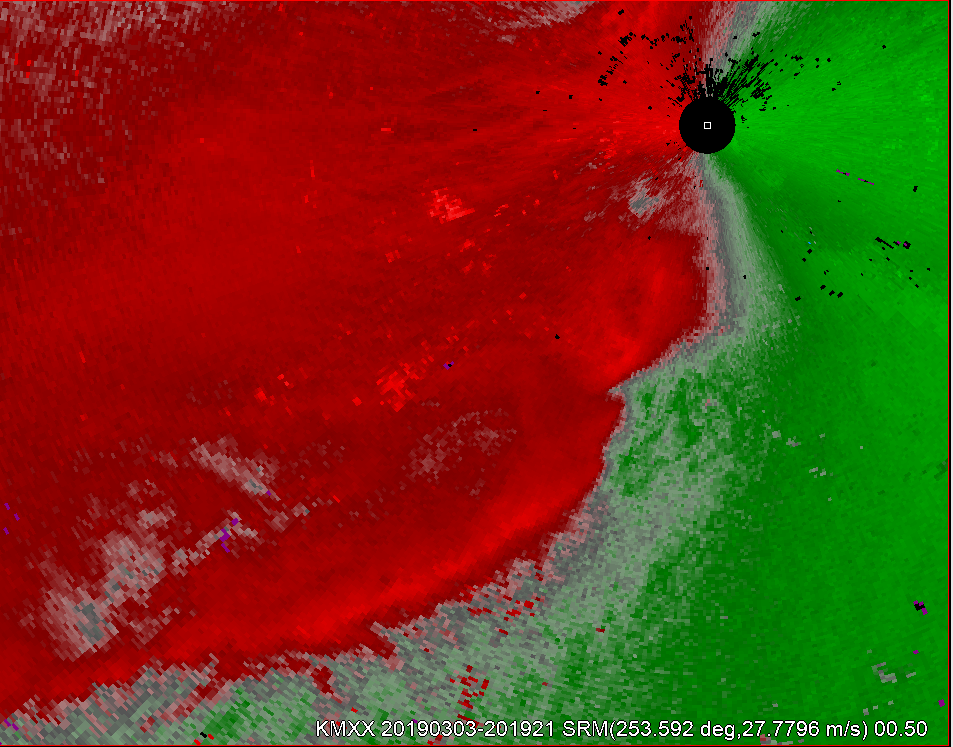
Stepping ahead 5 min some changes appear to be ongoing immediately to the SSW of the radar. The low-level reflectivity depicts that there is some discrete nature to the cell on the northern portion of the line. Of note, this does appear the be occurring near a surface low per the analysis, and upstream of a tornadic supercell. At this same time a kink does develop within the convergence line on the low tilt SRM.
2019z 0.5 reflectivity.2019z 0.5 SRM.
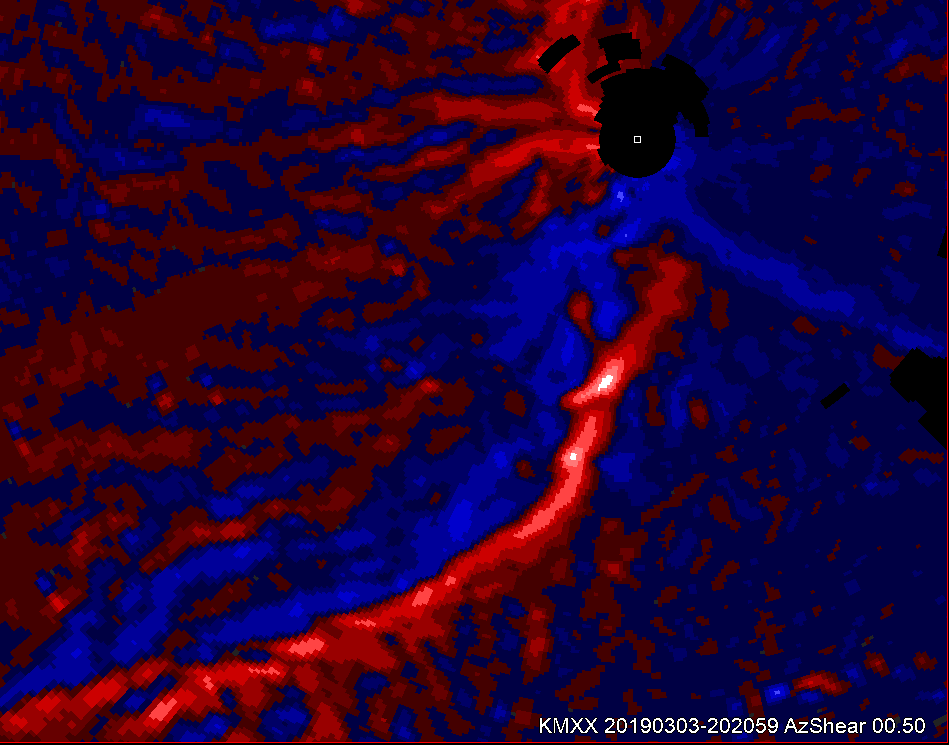
At the same time, the AzShear product shows some enhanced values at the northern end of the line that have become somewhat discrete from the remainder of the line. However, there are some enhanced values immediately south of the aforementioned area.
2019z 0.5 AzShear
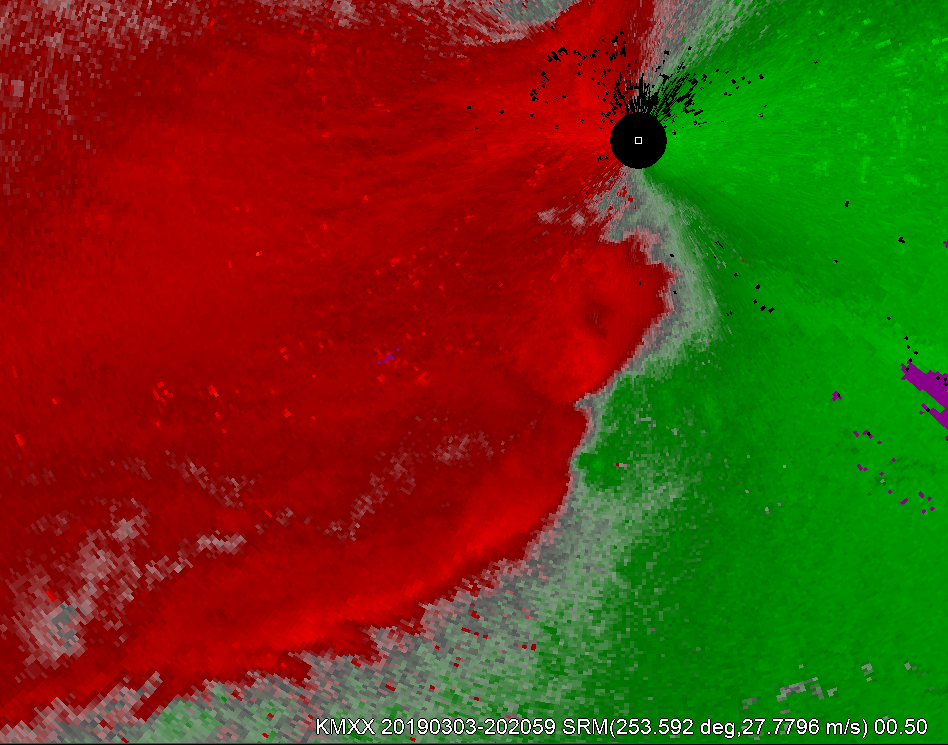
Advancing ahead about 2 min, the two areas become more enhanced in the AzShear product. At the same time the SRM does continue to show a kink in the line with the northern area of interest, and some weak and broad circulation on the southern area of interest.
2021z 0.5 AzShear2021z 0.5 SRM
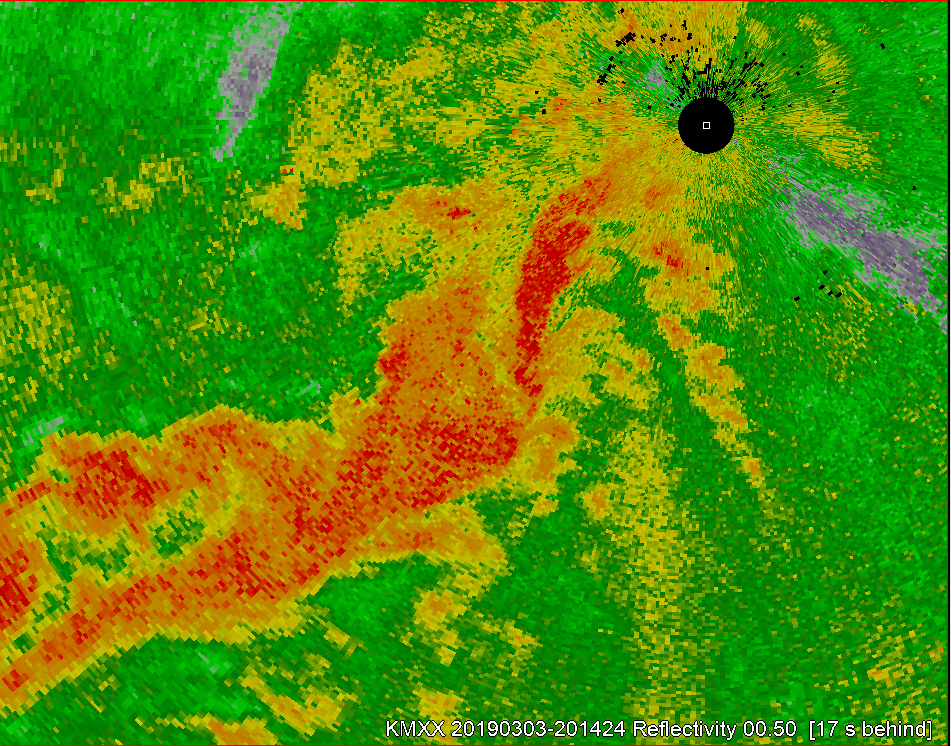
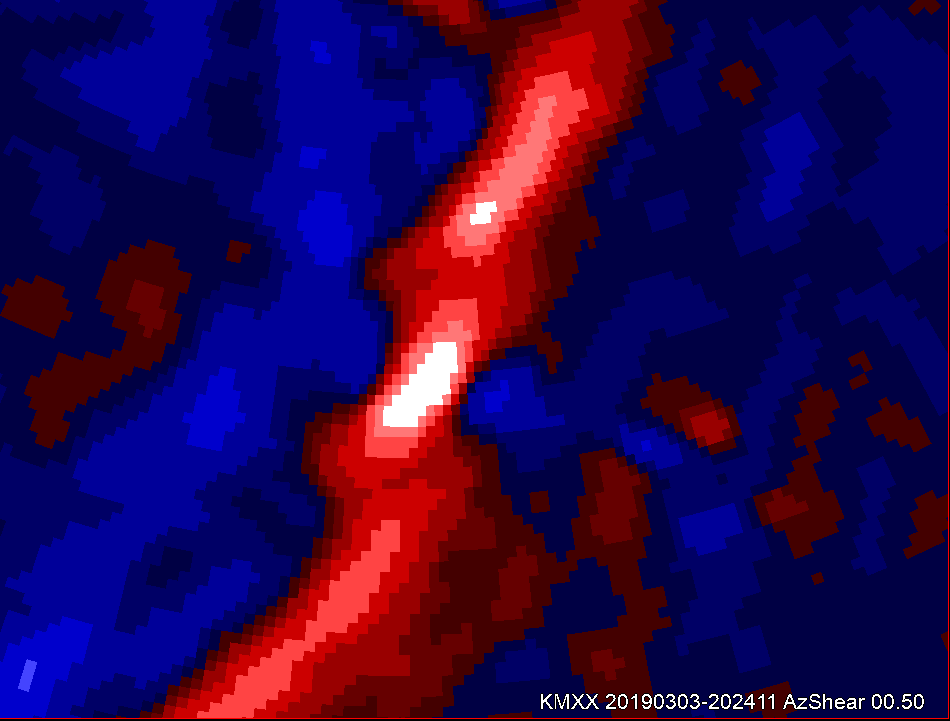
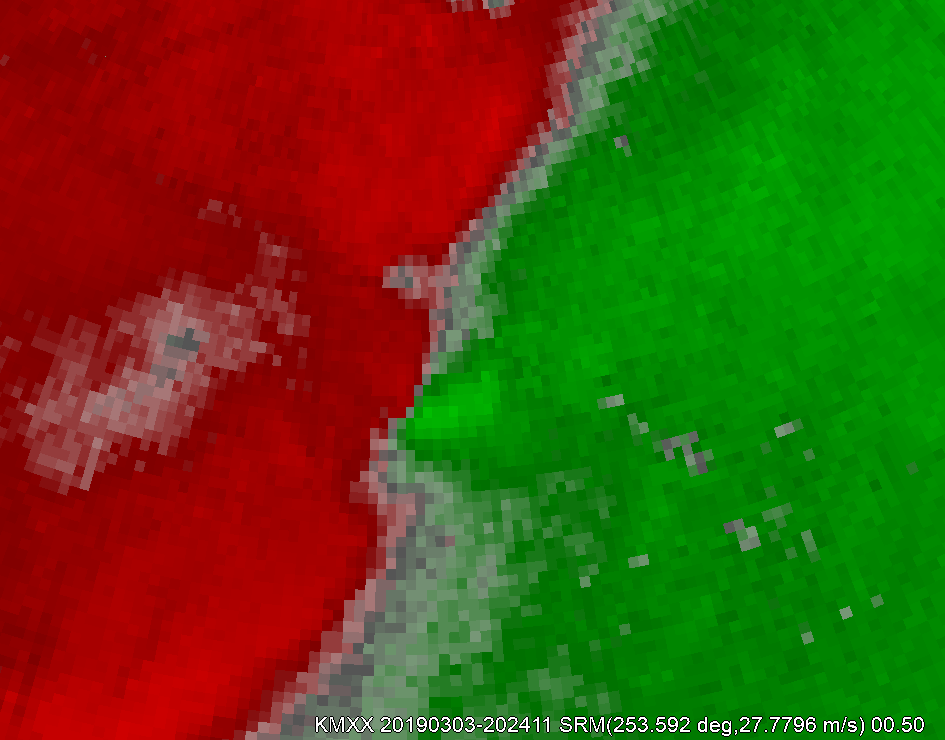
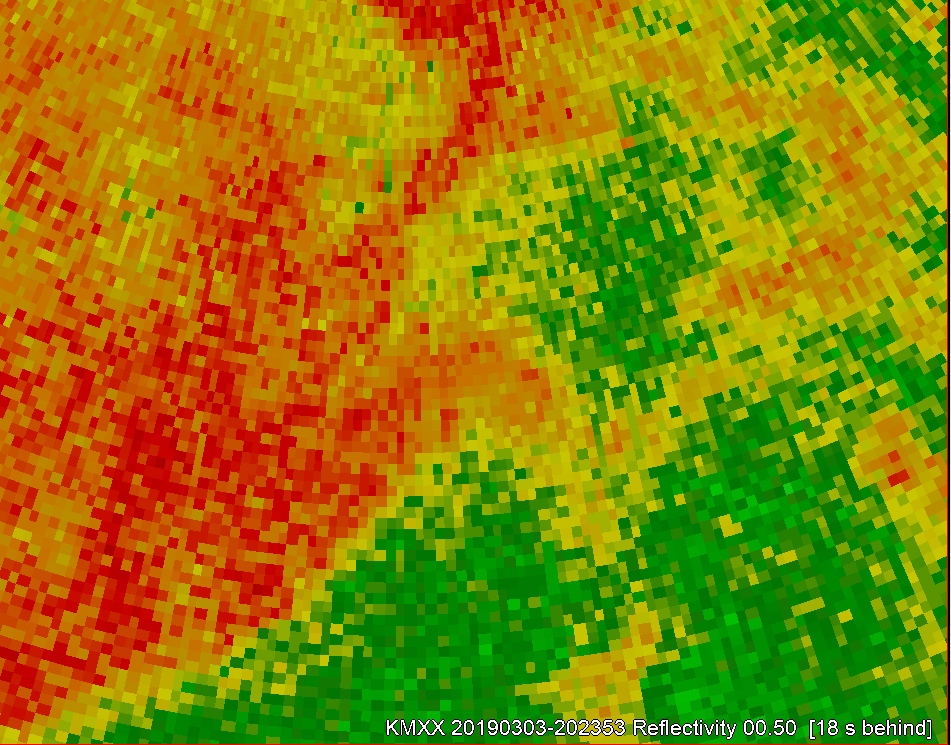
At this time, it is plausible to at least draft a polygon for a tornado warning based on the combination of increasing azimuthal shear and a favorable low-level environment. By 2024z the southern area of interest on the azimuthal shear has become dominant, and there is now a circulation on the 0.5 SRM. The reflectivity also shows high values associated with this circulation. In my opinion, using all three sources of information a tornado warning should be issued at least by this time.
2024z_AzShear2024z 0.5 SRM2024z 0.5 reflectivity
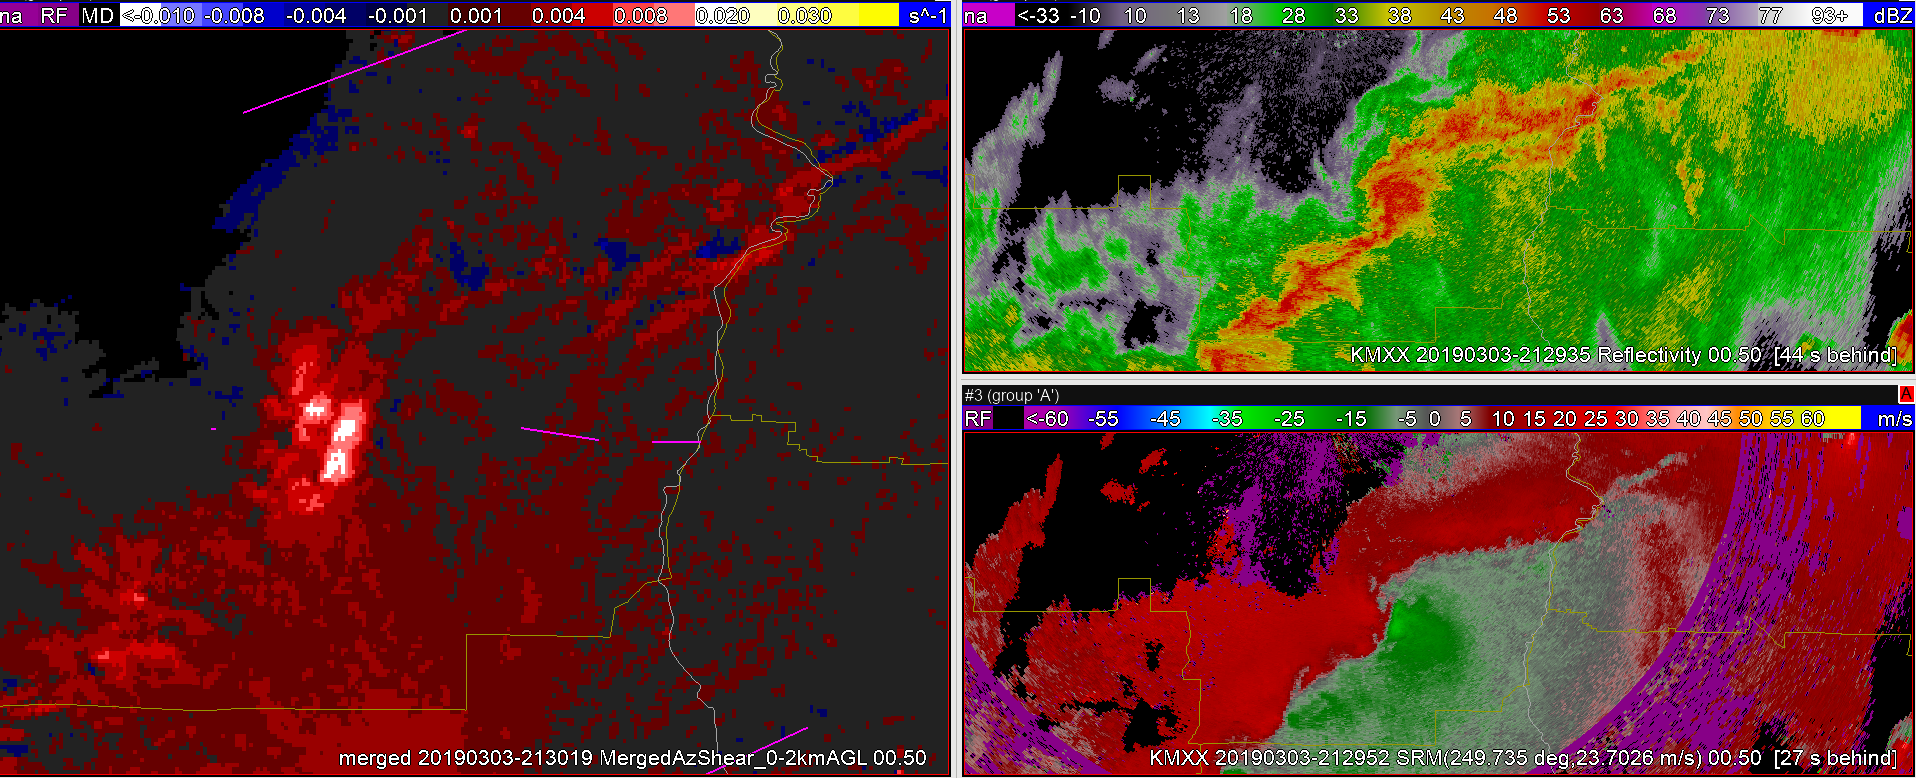
A tornado would develop out of this line shortly thereafter about 2727z and would be rather long-lived. After examining this particular storm in this case I see the single radar azimuthal shear as a ‘confidence builder’ that can be used along-side reflectivity and base velocity or SRM. The azimuthal shear product shows potential in highlighting particular areas of interest, which may provide a few additional minutes of lead-time.
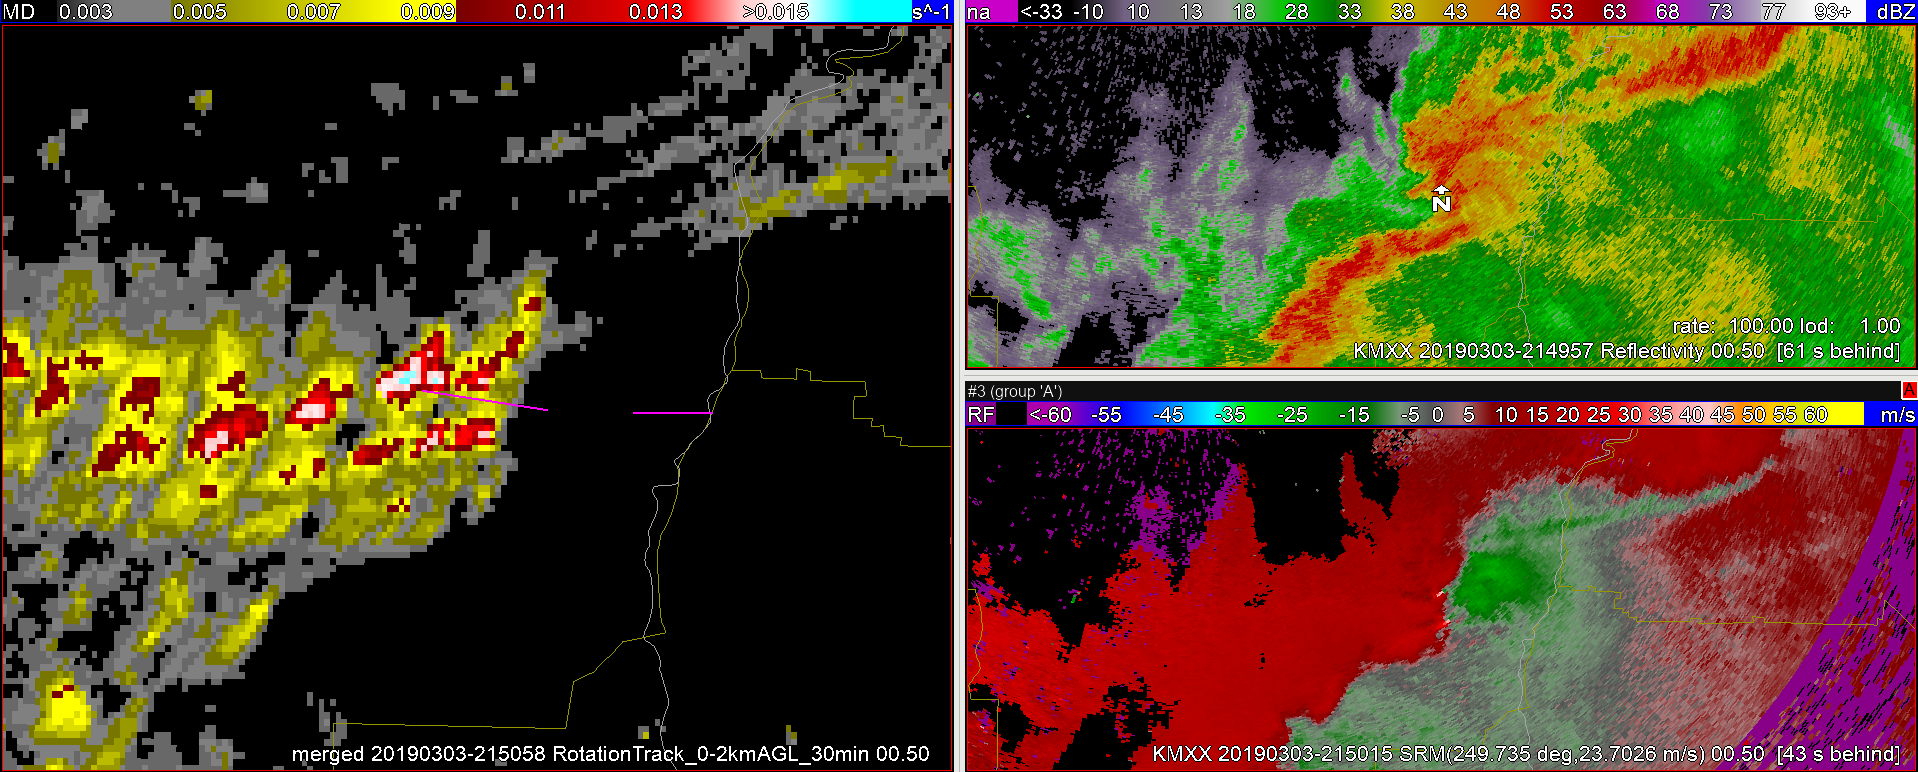
Couplet still is broad on SRM, but reflectivity and 0-2km AzShear still showing signs of organization. With the answer key downstream, perhaps this would be a good time for a tornado warning.
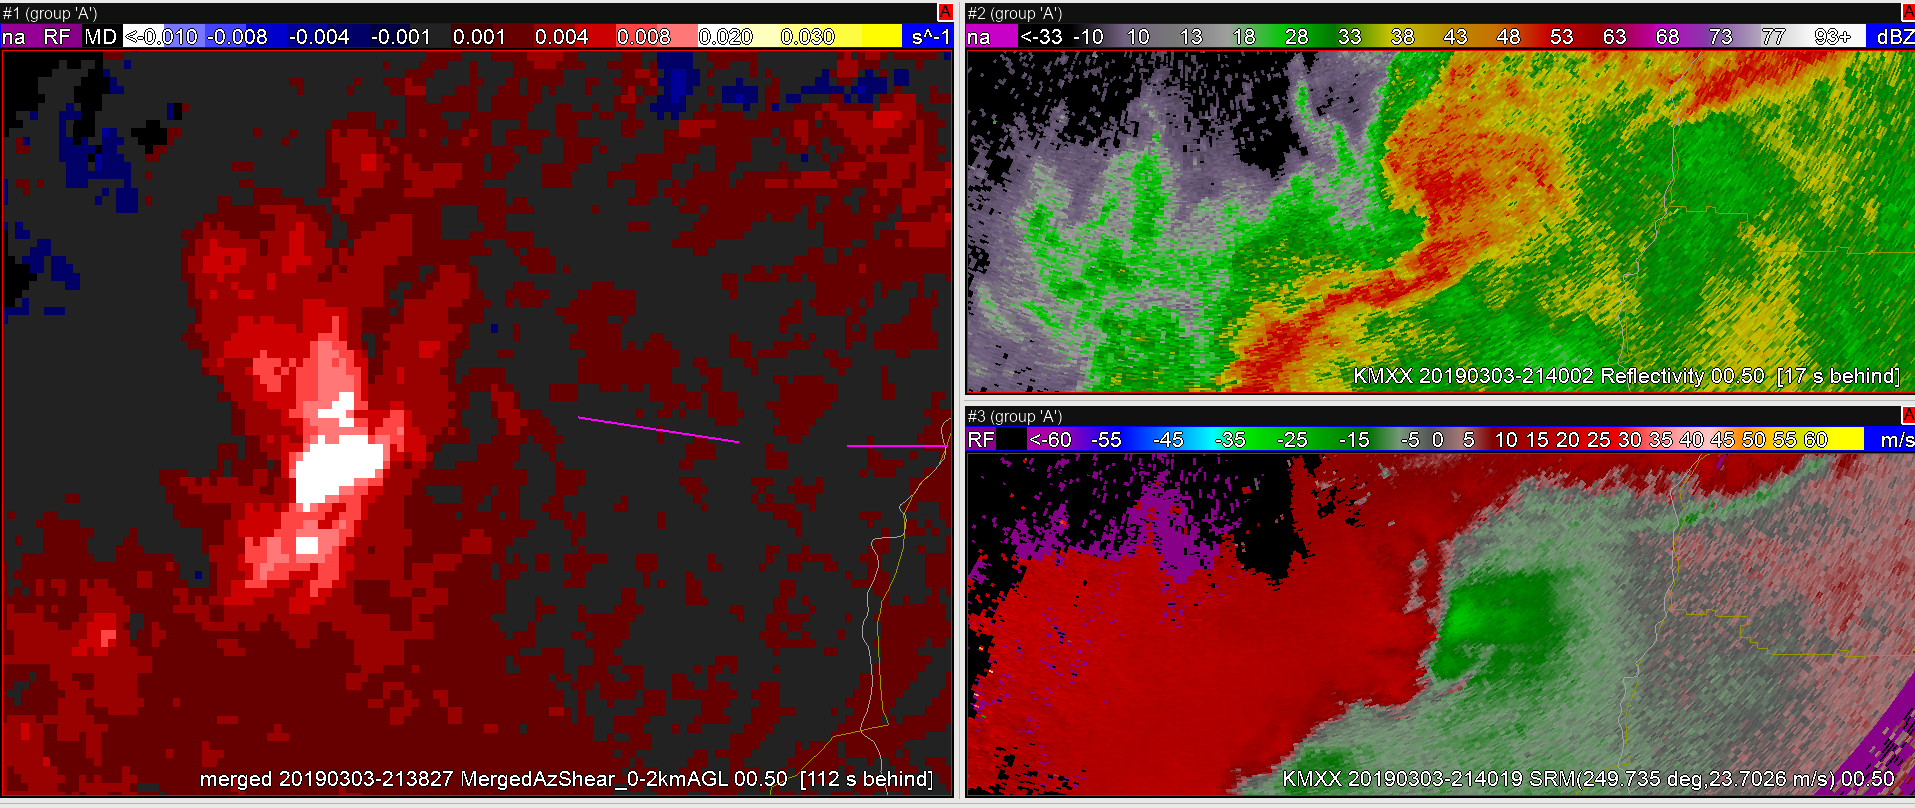
As we go another 10 minutes downstream, the couplet continues to organize along with reflectivity signature. SRM (bottom right below) showing a small gate to gate feature.
Another 10 minutes downstream and we see stronger gate to gate. LLRT product shows that ramp up as well as the other merged AzShear products.