Howdy Y’all! From the TX Panhandle!

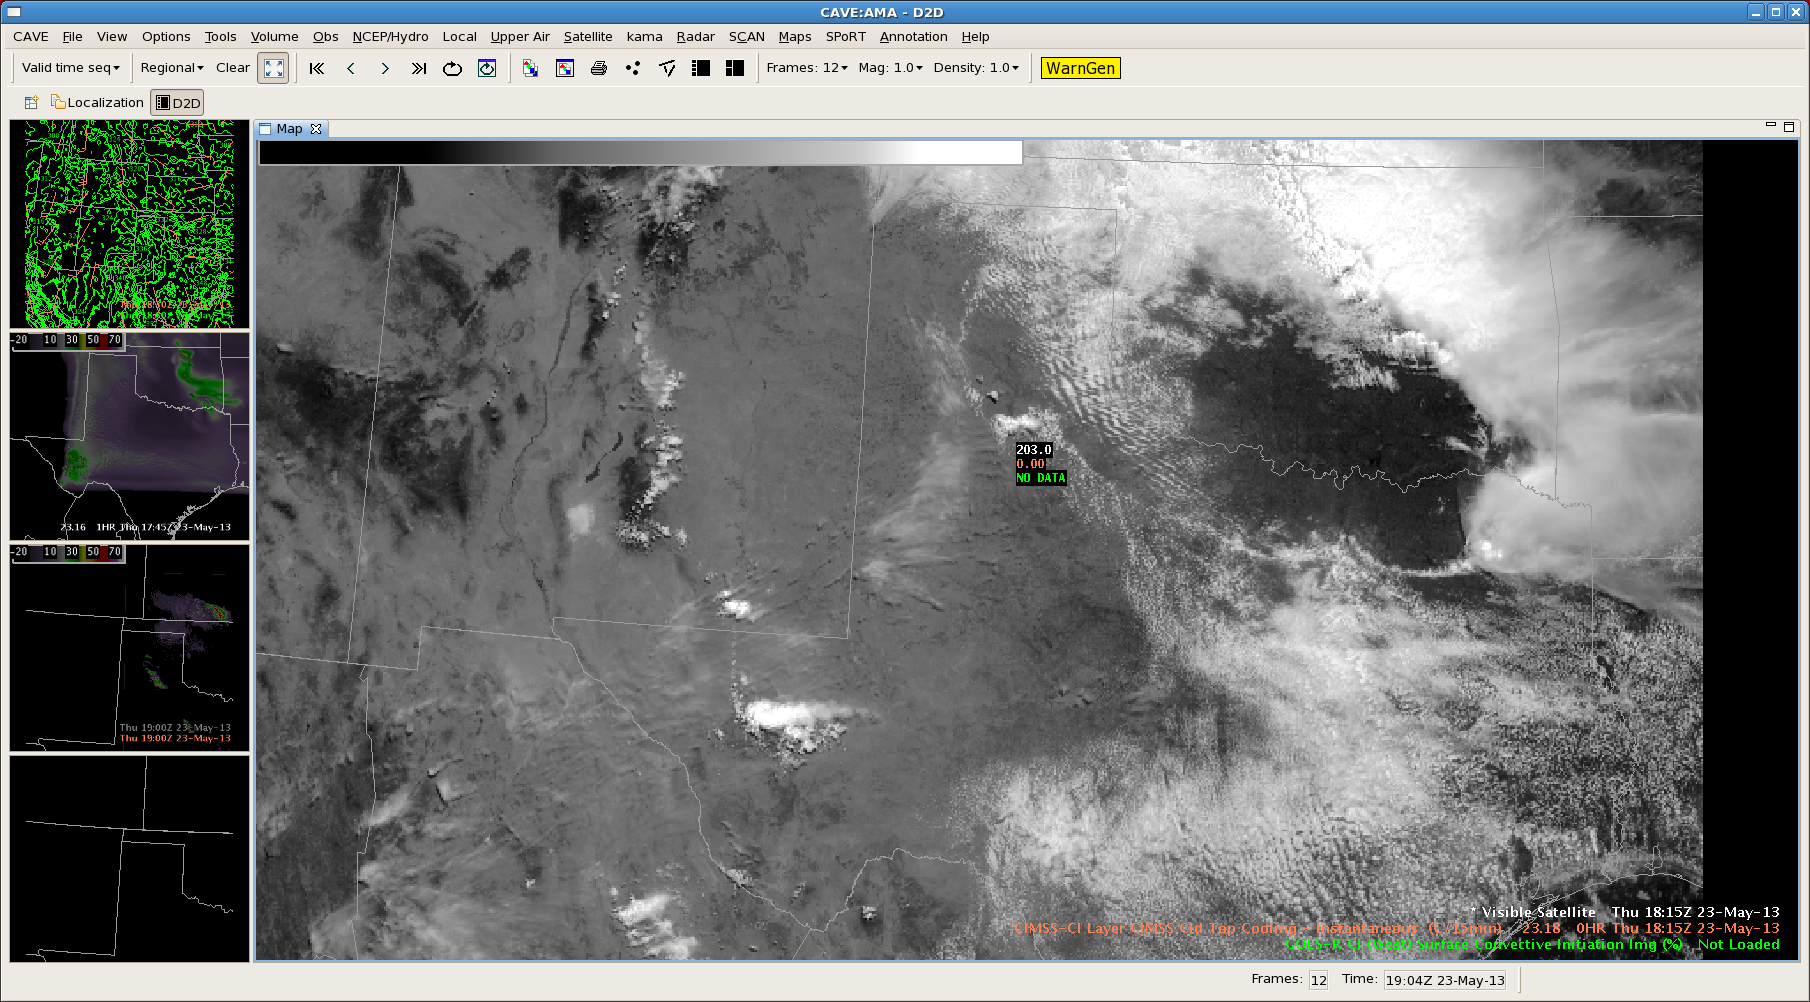
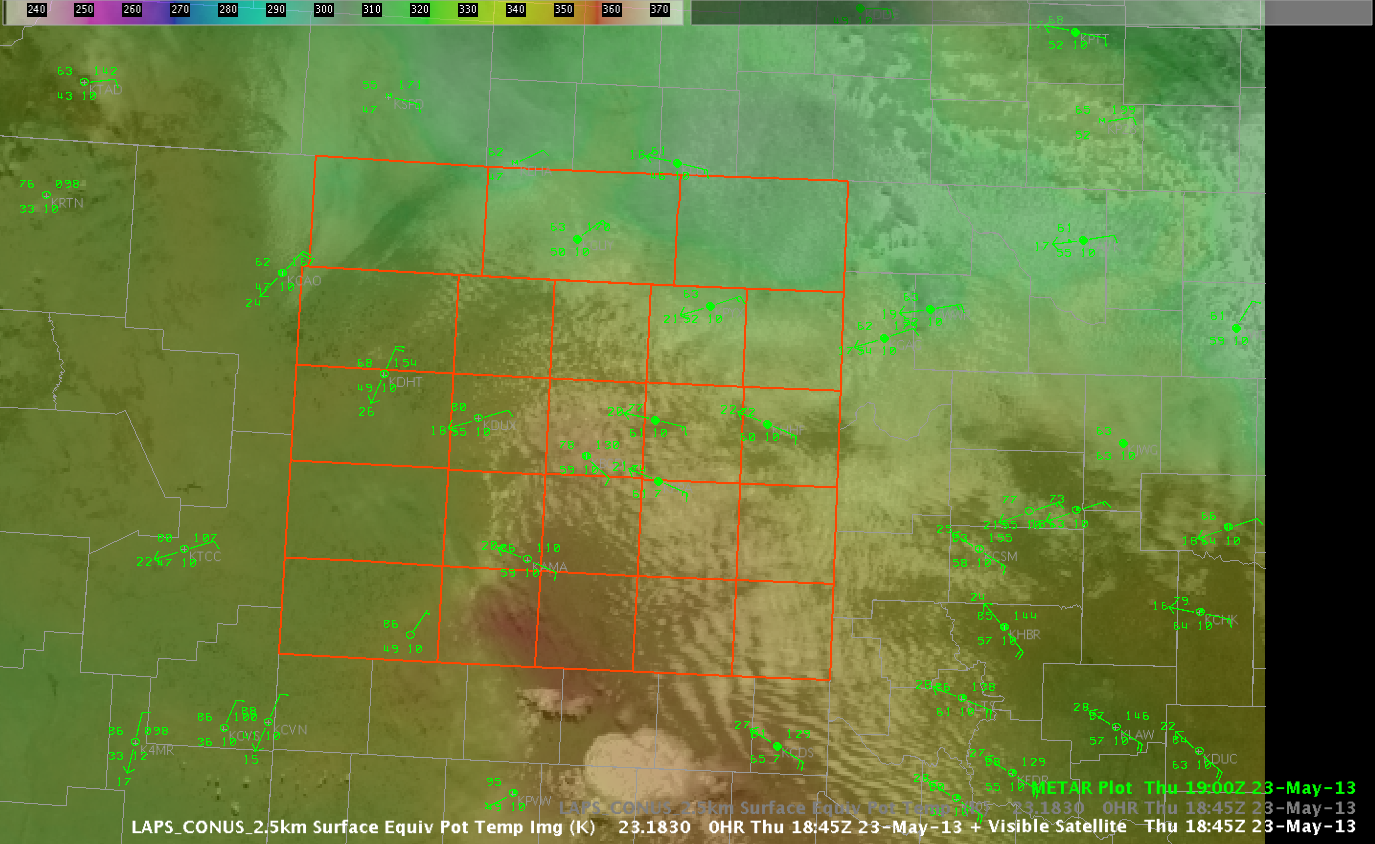
Well, there’s a severe thunderstorm down in the Lubbock CWA and all is quiet here on the northern front…way down south in the TX panhandle that is.  Anyway, an outflow boundary has moved across the area and appears to be settling in west-central portions of the TX panhandle so far.  The image below shows the latest GOES-15 Vis image combined with the 2.5km LAPS theta-e (1845 UTC).  METAR observations are laid atop the image (1900 UTC).  Hopefully, you can notice the reddish colors in the southwest part of our CWA just south of the Amarillo area.   A strong theta-e ridge extends from the Lubbock area into the southern portions of our area per the LAPS data.  So, we’ll be watching that area and the leading edge of the cu field in assoc/w the outflow for development.

LAPS 2.5km Surface Theta-e combined with GOES-15 Vis imagery.  METAR obs are included.
LAPS 2.5km Surface Theta-e combined with GOES-15 Vis imagery. METAR obs are included.


Kris

Tags: None

Initialization in TX Panhandle

Texas panhandle is the area of main focus for the first part of this afternoon. Analyzing CI, as seen below, indicated development was expected to quickly form by 19z.

Image 1 – CIMSS CTC prior to CI around 18z.

beforeCI

Image 2 – Cloud Top Cooling at the time of CI over the central parts of Texas panhandle around 1815z. Values right around -17oC.

afterCI

Image 3 – Vis sat around 1815z, with CI. Vis at 1845z shows the explosion of the storm in the panhandle, with the CTC product thus providing around a 30 mins lead time.

visafterCI

Image 4 – With the radar products unavailable at this time, using MESH and probability of severe hail to show the development of the storm to severe levels.  The CI on CTC developed around an hour prior to the MRMS products reaching severe levels.
meshprobsvrafterCI

Tags: None

Large Hail in Eastern Oswego County, NY…

A very impressive-looking storm produced severe hail in Oswego and Oneida Counties earlier today.  A report of golf ball size hail was received at 2310 UTC near the town of Central Square, which was the largest hail report received while the storm was in the BUF CWA.  Below is an image of MRMS and KYTX radar data at that time.  The MRMS reflectivity at -20C had reached values as high as 71 dBZ at this time!  Additionally, MRMS MESH values had reached a maximum of 3.31 inches.  Interestingly, the HSDA did not indicate the presence of large or giant hail, although there were areas of UK, or uknown classification.

MRMS data valid 2310 UTC and KTYX radar data valid 2312 UTC.  Upper left - MRMS merged reflectivity QC composite, upper right - MRMS reflectivity at -20C Isothermal level, lower right - MRMS MESH, lower left - KTYX Hybrid Hydro Class (HSDA)
MRMS data valid 2310 UTC and KTYX radar data valid 2312 UTC. Upper left – MRMS merged reflectivity QC composite, upper right – MRMS reflectivity at -20C Isothermal level, lower right – MRMS MESH, lower left – KTYX Hybrid Hydro Class (HSDA)

While severe thunderstorm warnings had been ongoing with this storm since 2144 UTC, the steady increase in MESH and reflectivity values at -20C prompted me (the warning forecaster) to issue a new thunderstorm warning with a mention of 2-inch hail.  Granted, we never got reports that large, although that doesn’t necessarily mean it didn’t happen.  Anyway, this was the theme on this day…where the MESH appeared to overestimate the size of hail to an extent, and probably more so as the hail became larger, while the HSDA underestimated the size, or else due to some issues with the algorithm was assigning a UK classification.

Kris and Eric

Tags: None

WRF Simulated Satellite at 23 UTC

The WRF simulated satellite image forecast for 23 UTC (top) compared well with the observed IR satellite (bottom) with respect to the mid-level boundary location across Indiana.  However, it did not handle to convection well which formed over PA.  Instead it showed more convection east of the higher terrain across MD and northern VA.

23zWRFsimIRsat

23zIRsat

Tags: None

BGM Warning Using HSDA and MRMS

Isolated severe thunderstorm progressing across north central NY early this evening. MRMS and HSDA along with the local storm reports were utilized in issuing a warning for this storm as it moved from BUF CWA to BGM. MRMS 60 min accum indicated strengthening of the storm as it progressed through the BUF CWA, with reports of between 1 and 2 inches. Both the MRMS and HSDA were both indicative of this.

Issued a severe warning with the increasing trend, mentioning up to 2 inch hail and possible wind damage, with hail being the bigger threat.

Image 1 – Reflectivity with initial warning. Guidance enabled the warning to be issued with plenty of time before even reaching the CWA.

BGMREFLEC

Image 2 – MESH values with 60 min accum indicates hail sizes between 2 and 3 inches. Reports since the warning has been issued have confirmed up to 2.5 inches.

BGNMRMSMESH

Image 3 – Severe hail probability bringing in 80-90% over areas reporting severe hail.

BGMPROBHAIL

Image 4 – HSDA indicating large to giant hail.

BGMHSDA

Tags: None

Oswego County Hailer, Detection, And Interesting Features

The following 4-panel at 2249Z from KTYX shows a nice indication of large hail over Oswego County, NY.  The reflectivity is from 8.0 degrees, with MESH upper right, HSDA lower right, and Dual Pol Correlation Coefficient. (see image below). OswegoHailThe hybrid HSDA was still underestimating this storm, but the 8.0 deg Z, MESH, and CC all show the potential for large hail.

About 20 minutes later, our HWT class leader Greg Stumpf took this four panel off of HSDA on FSI.  Note: Not only the TBSS is very evident, but you can actually see a horizontal sidelobe indicative of power loss and beam spreading occurring higher up in the atmosphere.  Pretty cool stuff!fsi_hsda

Tags: None

Using Legacy With Dual Pol and MRMS For Warning Detection

Regarding the warning for:

EXTREME NORTHERN CAYUGA COUNTY IN CENTRAL NEW YORK…
SOUTHWESTERN OSWEGO COUNTY IN CENTRAL NEW YORK…
EXTREME NORTHEASTERN WAYNE COUNTY IN WESTERN NEW YORK…

We (The Buffalo office guys) noticed an increase in both the MESH and an increasing 50 dbz core on the KZYX Z slice at 4.0 degrees elevation and above 25 KFT. The Hybrid HSDA did show a slight increase, but no LH or GH just yet (the sever type). Nonetheless, the CC Dual Pol product indicated low values indicative of larger hail as well. Here’s the 2214Z 4-panel of all these parameters.

4panelZ_MESH_HSDA_CCHere’s what these parameters looked like from KBUF upstream near Oswego, NY.  Everything mentioned above on the parameters was similar to KTYX.

4-PanelHail

The theme here is using only MRMS and Dual Pol is helpful, but even using base legacy radar data is more helpful when looking from two different RDAs.


Tags: None

MESH Verifies Again

MESH did a great job, and was vital in this warning decision. The 50dbz height was to around 25,000ft AGL and a bit below our Donovan threshold for this area today of 28,000ft AGL. The MESH was indicating the possibility of 1″ hail, while the HSDA was just forecasting hail and not large hail. However there were also a few pixels of over 65dbz at -20C which added to our confidence. Therefore a warning was issued and was verified later on by an LSR. NewHartfordHail2204z NewHartfordHail2207zWesely


Tags: None

New Warning for…Cayuga County!

The storm shown below has undergone rapid strengthening lately.  This time, I used the 30 minute MESH, composited with the MRMS -20C reflectivity to generate the warning polygon.  The 30 minute product was useful for quickly determining a reasonable extent to my corresponding 30 minute warning.  It also showed indeed that the storm was undergoing strengthening.  In addition, at 2216 UTC, the >1 inch hail threshold was breached by the MESH data (actually looking back it was breached at 2214 UTC).

Image 1.
Image 1.  MRMS MESH 30 minute accumulation at 2216 UTC with resulting warning polygon.

At the same time, the -20C Isothermal reflectivity was showing values around 60 dBZ (image 2 below).

Image 2.  MRMS reflectivity of -20C isothermal level, with warning polygon.
Image 2. MRMS reflectivity of -20C isothermal level, with warning polygon.

Kris and Eric

Tags: None