An official website of the United States government
Here’s how you know
Official websites use .gov A
.gov website belongs to an official government
organization in the United States.
Secure .gov websites use HTTPS A
lock (
) or https:// means you’ve safely connected to
the .gov website. Share sensitive information only on official,
secure websites.
Total lightning has a large role in the Experimental Warning Program this year. We are on day 1 of the first week and everyone is familiarizing themselves with the various products. I have shown an quick comparison of some of the products that we will be evaluating throughout the week.
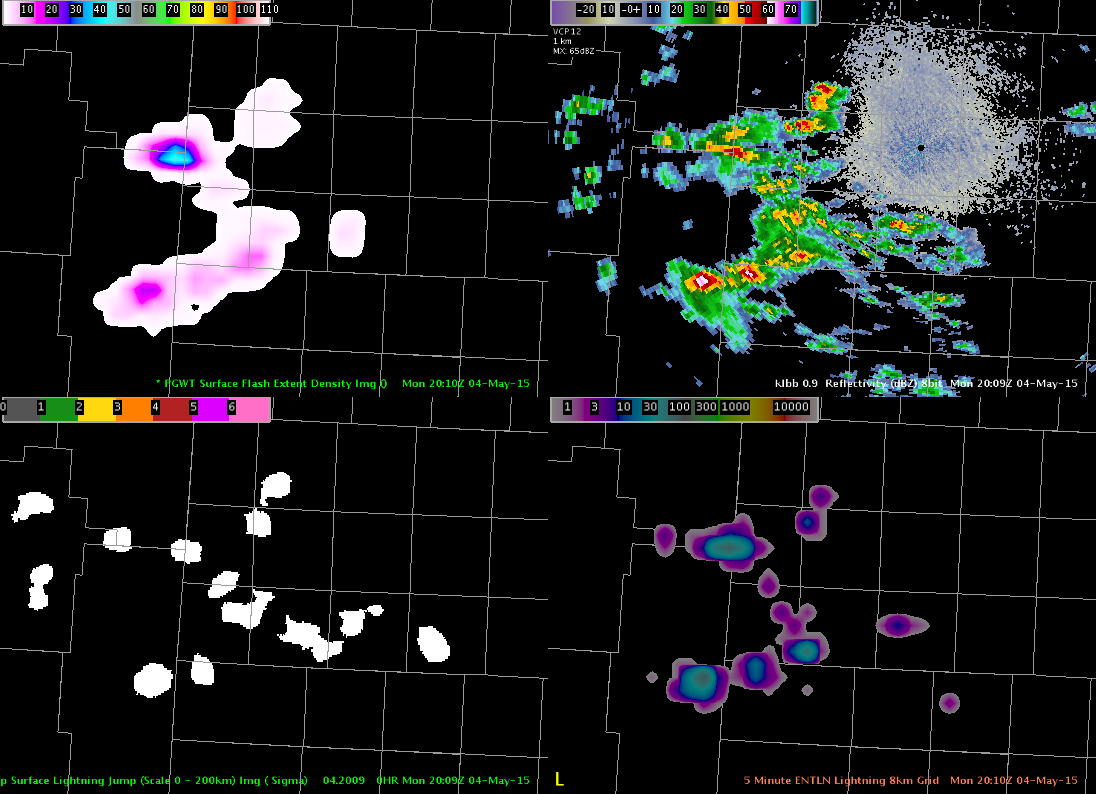
The storms cooperated by moving into the West Texas LMA domain (Lubbock county warning area) allowing for the first views of the NASA SPoRT pseud-geostationary lightning mapper (PGLM) this year. The image shows the PGLM (upper left), radar reflectivity (upper right), the lightning jump showing the sigma level change using Earth Networks data (lower left), and the Earth Networks total lightning over a 5 min summation and put on an 8 km grid.
The PGLM is showing a maximum value of 41 flashes over a 2 min window with the Earth Networks showing ~40 flashes over a 5 min window. The lightning jump indicated the storm in the north as having a 1-sigma change, which is not enough to indicate severe weather is imminent. The PGLM gives another view of spatial extent of the lightning, which is particularly evident in the northernmost section. The main advantage of Earth Networks is the coverage, unlike the small domains from the lightning mapping arrays that are used to derive the PGLM.
Lightning observations from the 2 min PGLM (upper left), radar reflectivity (upper right), lightning jump algorithm (lower left), and Earth Networks 5 min data on an 8 km grid.
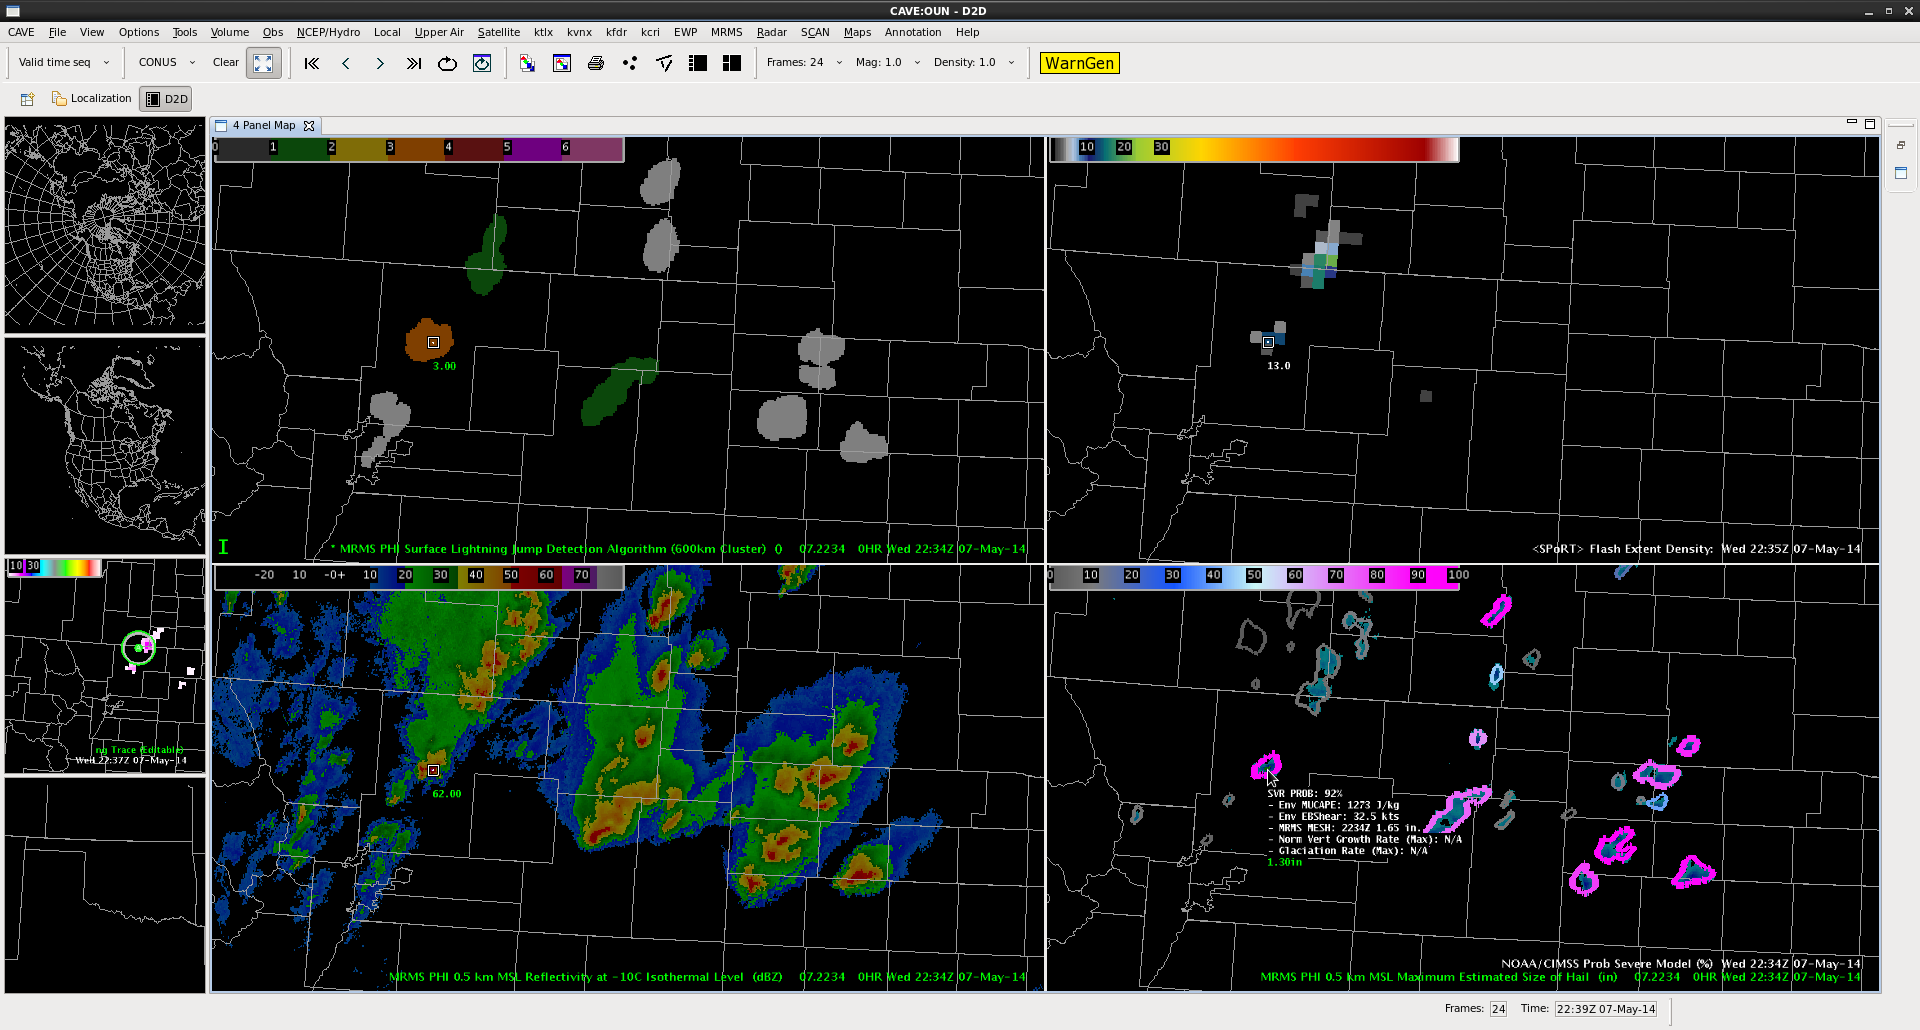
A wider look at the lightning jump grid at 2234 UTC of the NE Boulder CWA… All tracked storms (with greater than 10 flashes per min and within the 150 km LMA domain) are shown. Three tracked cells show some type of sigma jump at this same time. Two in green – 1-sigma (or standard deviation) and one smaller cluster, orange, with a 3-sigma jump.
The three-sigma jump storm corresponds with a ProbSevere 92% and MESH of 1.65 in.
-K. Calhoun, Week 1 Coordinator & Lightning Jump PI
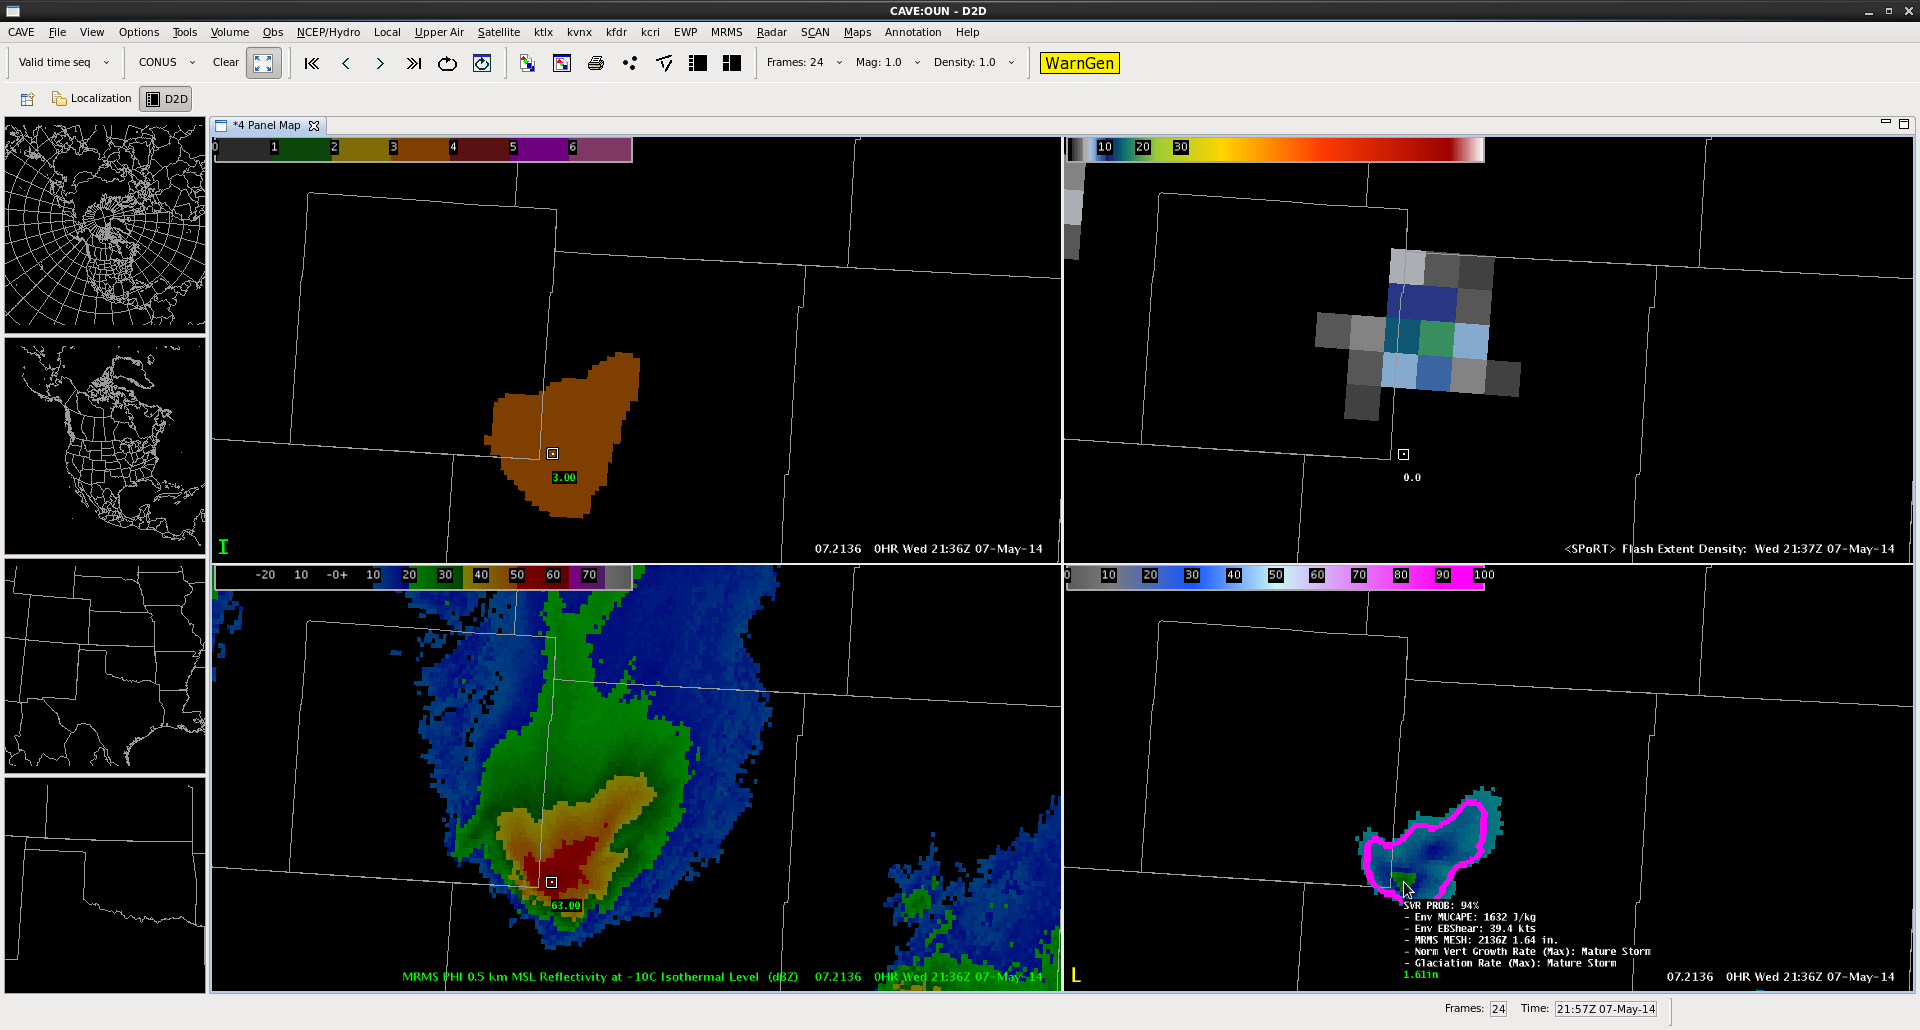
For the first time, we have storms in an LMA domain strong enough to produce images on lightning jump grid.
The four-panel image below contains a 3-sigma lightning jump (top left: orange fill region) the pGLM lightning grid (top right: max flash extent density as high as 18 flashes per min), MRMS reflectivity at -10 C (bottom left), and ProbSevere (94%) overlaid on MRMS MESH (bottom right).
AWIPS2 Screenshot from 2136 UTC on 7 May 2014.
This particular combination has provided a couple ideas for lightning jump algorithm development. (1) inclusion of metadata similar to the mouse-over ability of the ProbWarn product. The mouse over for the lightning jump should contain the current flash rate as well as the degree of jump in sigma. (2) Combination with a product similar to ProbWarn (if not, the ProbWarn product itself. This could provide the forecaster information from satellite, lightning and radar all-in-one product. The advantage this provides is that approaches a forecaster-over-the-loop type product without becoming a “black box” as all the information that is part of the product is also provided as metadata. I look forward to working with CIMSS-WI and other researchers on this type of development.
–K. Calhoun, Week 1 Coordinator and Lightning Jump PI
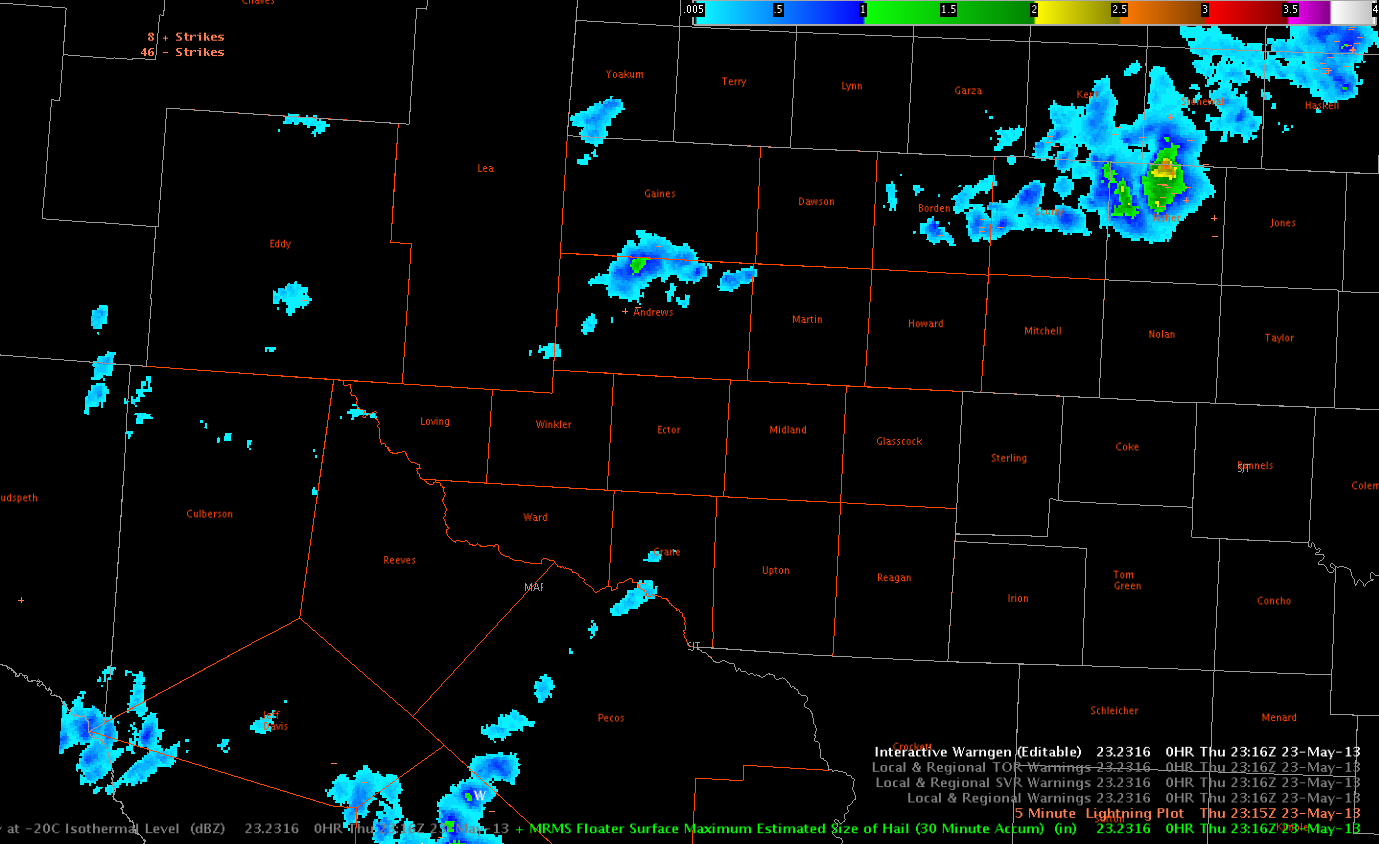
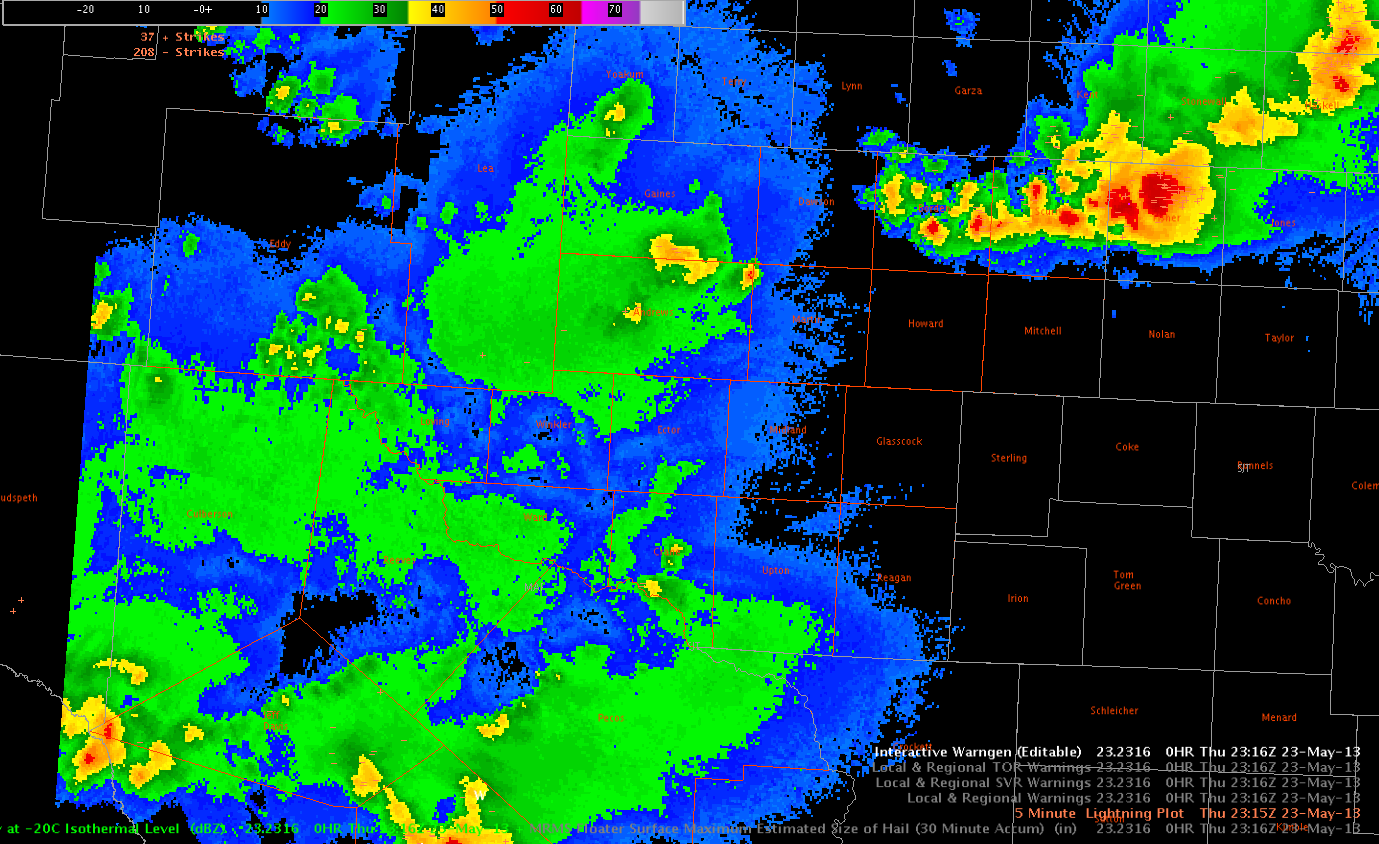
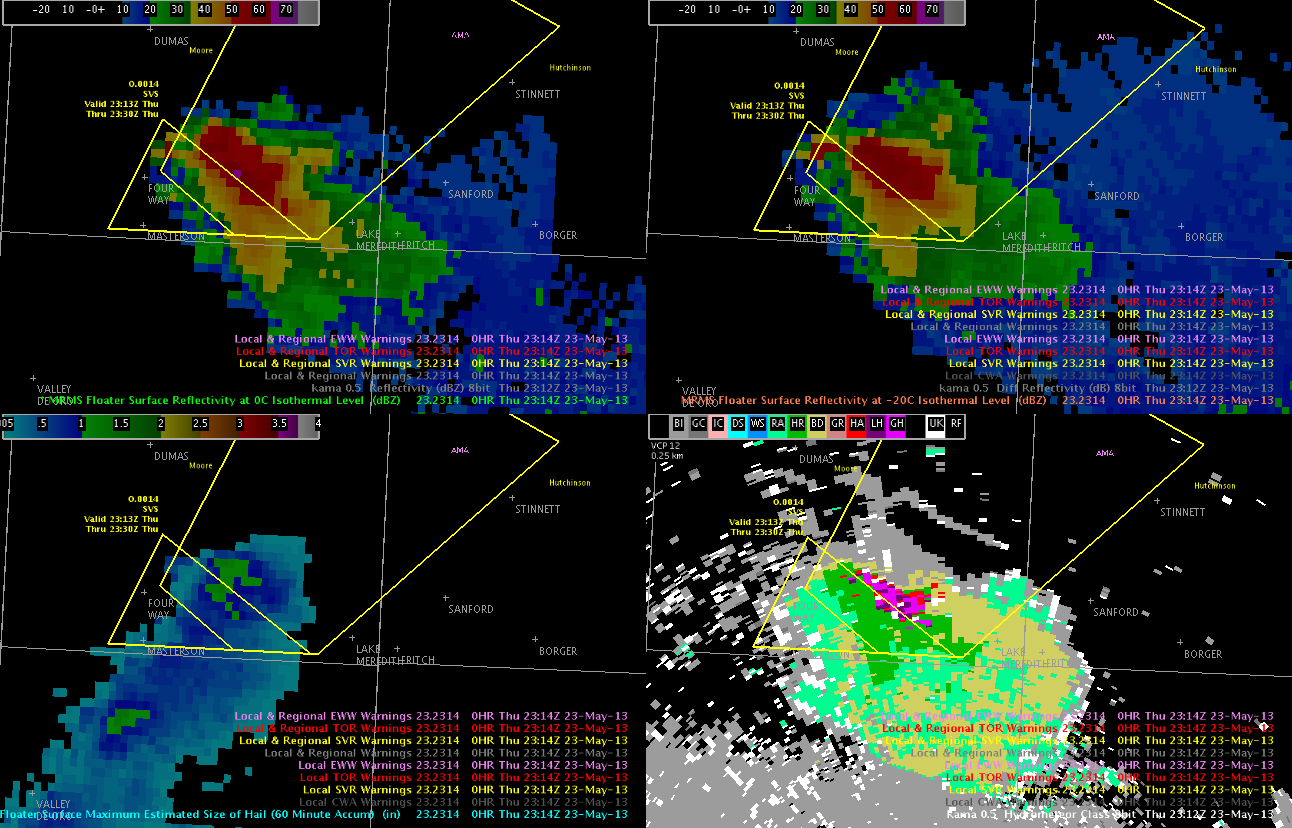
Ok, so it’s always important to have a good understanding of new products before going gung-ho so to speak. I thought I’d blog about something different here. On my warning screen today, I had been looking at the 30 minute accumulation MESH product (or so I had forgotten it was the 30 minute accumulation) and yesterday when we were “in” New York, I had a great deal of success using this product, in conjunction with others. Initially, I noticed a >1 inch value over northern Andrews County as shown in image 1 below.
Image 1. MRMS MESH (30 min accumulation) at 2316 UTC. Notice the >1 inch values over northern Andrews County.
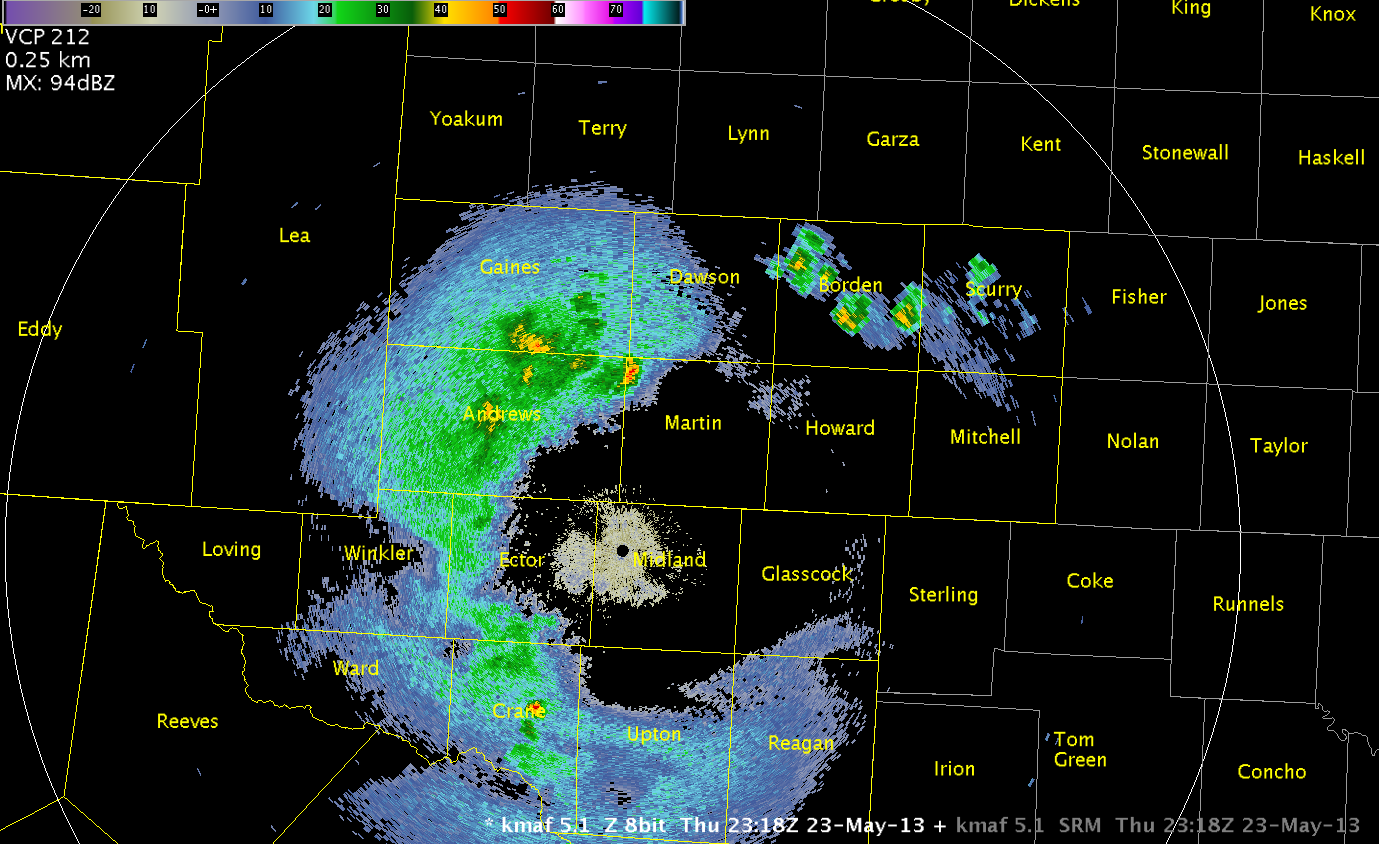
My old warning had expired and I started to prepare a new warning (I was blogging and was late keeping up with things =P ), but then thought it would probably be proper to more closely scrutinize some other data. I switched over to the MRMS reflectivity at -20C and noticed the values were relatively low for this cell at the time, with vales generally below 45dBZ in this same area (image 2).
Image 2. 2316 UTC MRMS reflectivity at -20C. Notice the relatively low values in northern Andrews County.
So, what did I do next? I went back to the data I knew best and was most familiar…the all-tilts. At the nearest time (2318 UTC), I noticed relatively low values of dBZ even near the 20kft level in this area, which corresponded to the MRMS reflectivity at -20C data (image 3).
Image 3. 2318 UTC KMAF 5.1 degree reflectivity. At this elevation angle, the radar slice was approx 22 kft AGL at this location in northern Andrews County. Notice generally low dBZ values at this height.
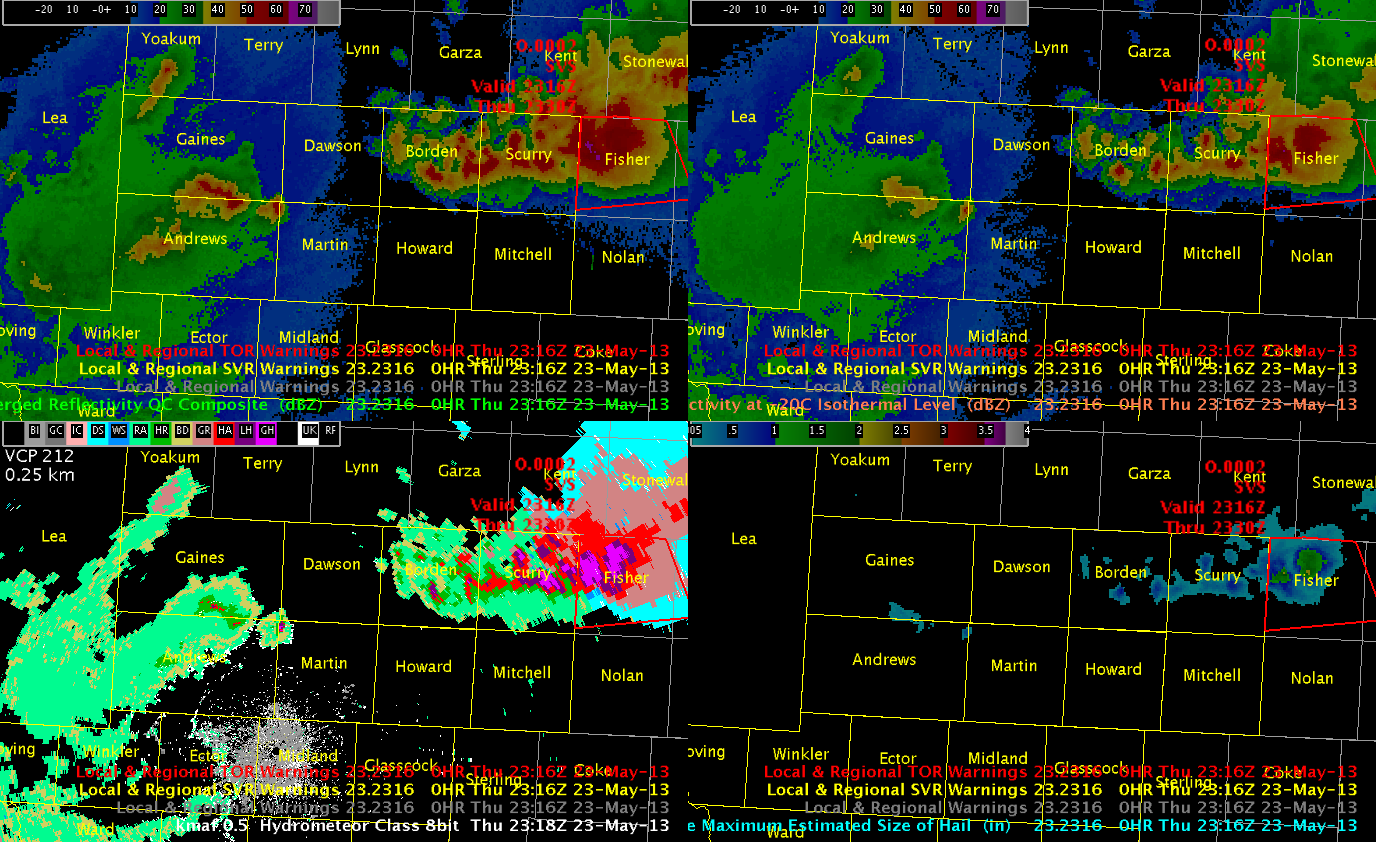
From there I went to my four-panel of MRMS data, which included the 0.5 degree KMAF HSDA (image 4 below). I had gained familiarity with these products fairly well over the past couple of days and wanted a quick sanity check.
Image 4. 2316 UTC MRMS and 2318 KMAF HSDA data, overlaid with SVR warnings. Upper left – MRMS Merged reflectivity QC Composite, MRMS upper right – reflectivity at -20C, lower right – MRMS MESH, lower left – KMAF 0.5 degree HC.
Notice in image 4 above, the low MESH values in northern Andrews County at the time. What? I thought there were values over 1 inch. I went back to my warning screen and noticed that I had the 30 minute accumulation of MESH. I had simply forgotten. However, this had almost resulted in a faulty warning. Now, it could have been the HWT environment. Would I have been so quick to react and careless in an actual operational setting? Probably not. However, this does bring to mind the importance of making sure to look at products carefully, especially new products with which the forecaster may not always be familiar. Yesterday, when we were “in” the BUF office, I had used this product in addition to the MRMS reflectivity at -20C to actually form my polygons, and it had worked pretty well I thought. But those cells were tracking along nicely. Today, the cells were moving quite slowly. So, the 30-min accumulation product may not have been appropriate to use in conjunction with WarnGen. It was hard to discern any movement or much change in the product since the cells were not tracking along much. That’s why it was hard to determine if the >1 inch MESH had happened recently or much earlier in the 30 minute window. Lesson learned. This product may have been fine for SA purposes and perhaps kept on my non-warning screen. These are things to think about for proper warning strategies.
The 50 dbz echo top continues to be one of my favorite parameters for quick and easy interrogation should things get busy. It’s a nice way to see the approximate height of the 50dbz core. Height of the 50dbz core above -20C is also a nice touch to analyze those really big storms that may need more significant hail wording.
The MESH and HSDA were both doing a good job with this storm. We did not get any hail reports, but that is likely due to the rural locations where the storm was tracking. Seeing the MESH indication of 1 inch hail and the HSDA forecast of large hail added confidence in the warning decision making process and it only took a few seconds to glance at these products. Therefore, there was still time to go through a complete review of base reflectivity and SRM data in all_tilts. The algorithm hail trends reflected what one would expect based on all_tilts base data.
The mid level rotation track was a nice way to view the life of this storm. Initially there was good mid level rotation, but this rotation begins to weaken with time and the warning was allowed to expire early. The decision to expire the warning early was based primarily on trends within MESH, HSDA, and 50dbz echo tops. But the loss of rotation was icing on the cake for letting the warning expire. (Jeremy Wesely)
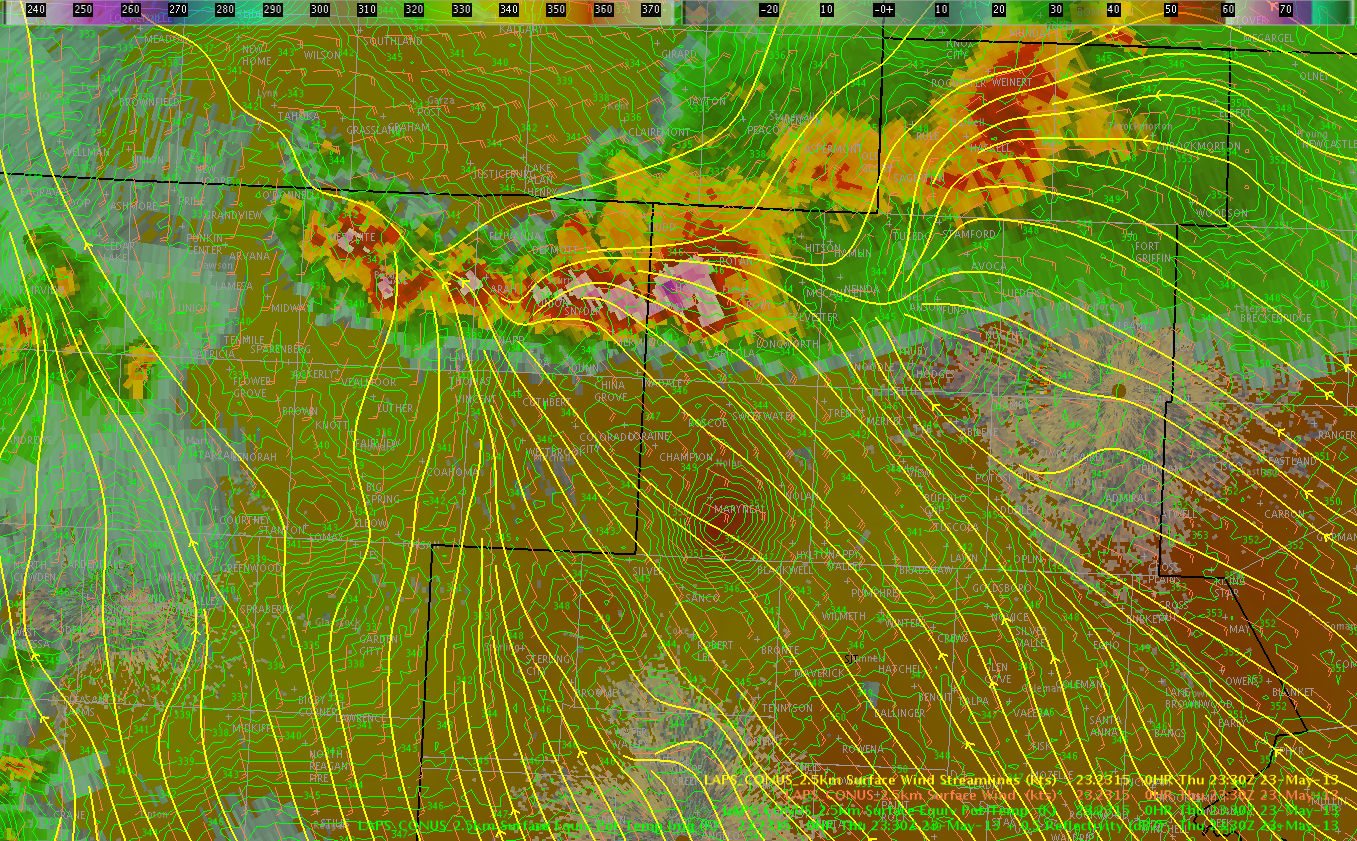
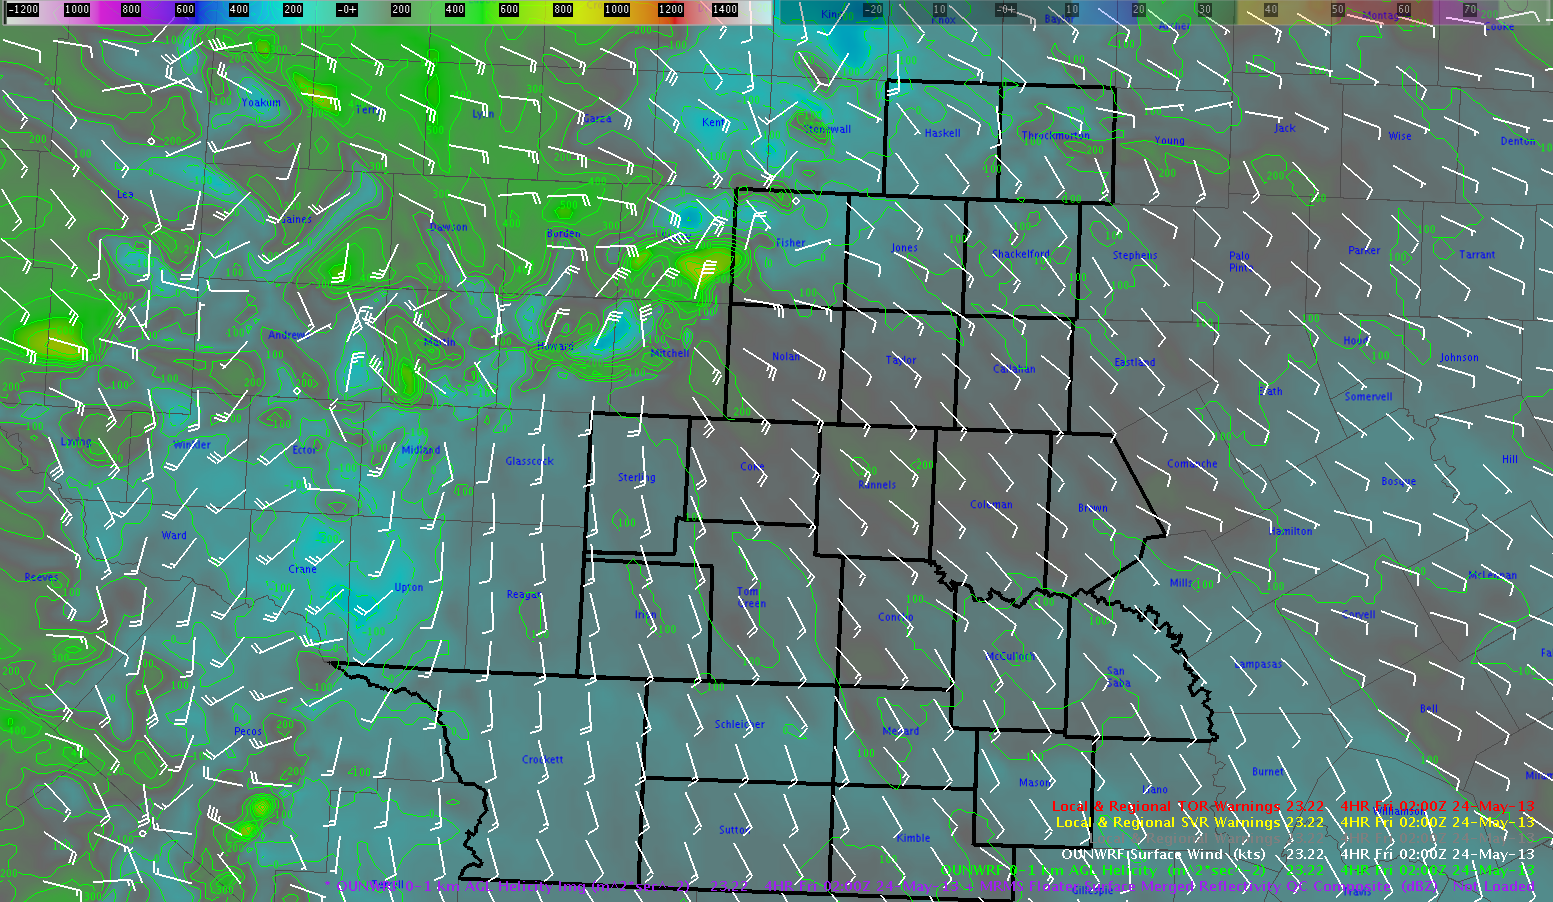
An earlier cell merger helped enhance low-level rotation and produced a reported tornado near Rotan in Fisher County TX in SJTs area. The mid-level meso would eventually track SW toward Scurry and Mitchell Counties in the MAF forecast area. The LAPS streamline analysis at 2330 UTC indicated convergence over the northeast portion of the MAF CWA, which appeared to be concentrating higher theta-e values in the location likely allowing the stronger convection to translate west of south.
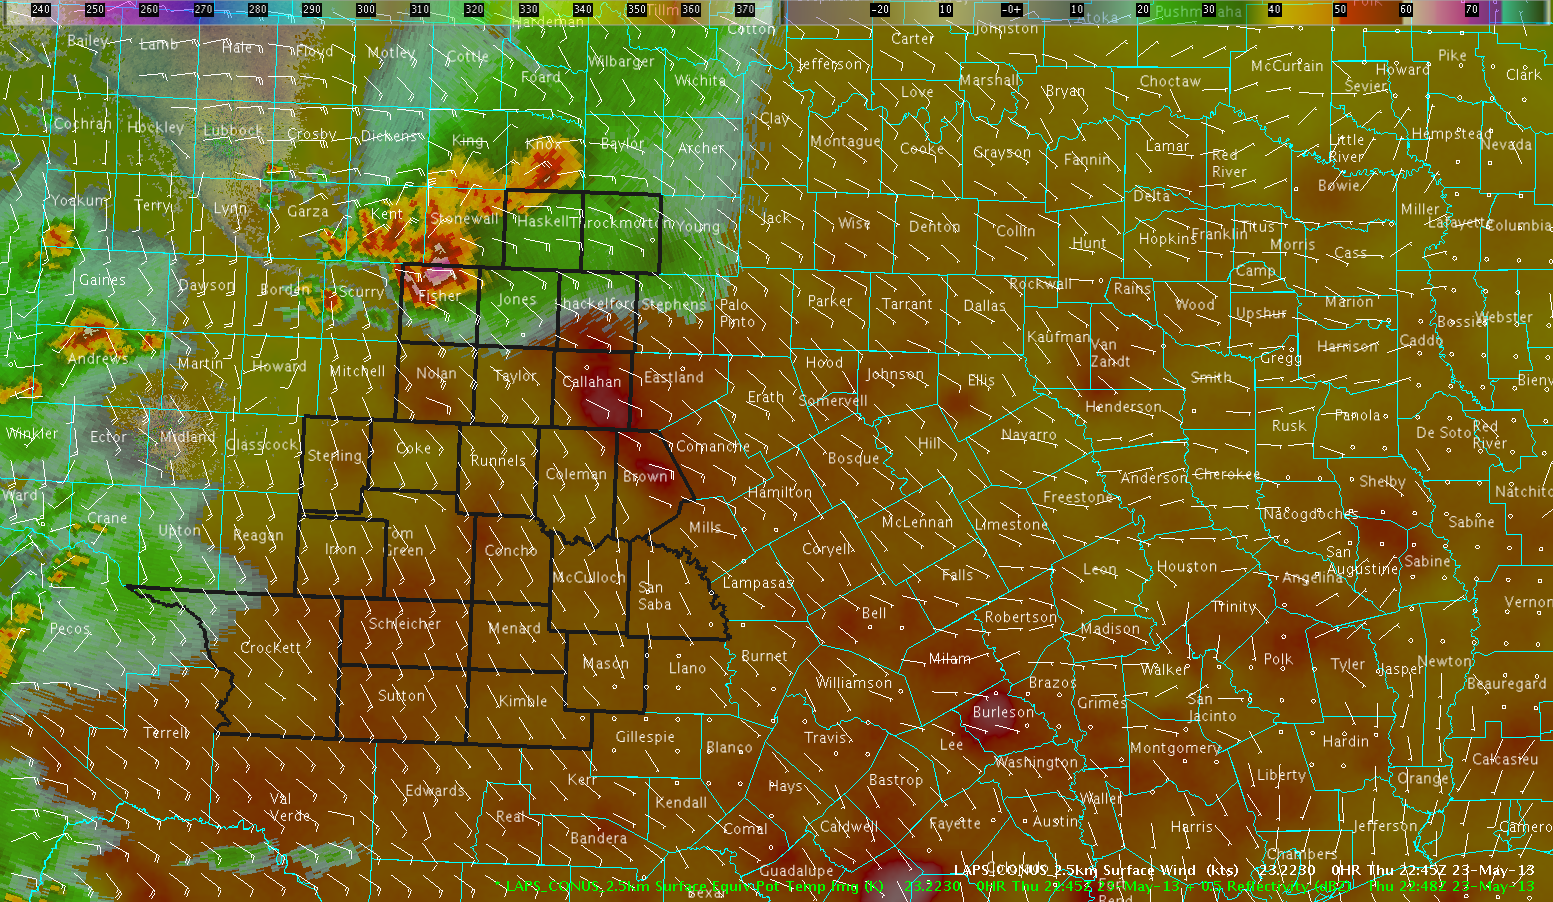
Our first clue was the 2.5KM LAPS Theta-E image with LAPS wind and regional radar overlaid on it at 2245 UTC.The tornadic Fisher Co storm was propagating southward toward the bullseye of Theta-E over Nolan Co, while the rest of the more linear convection with damaging to destructive winds was moving southeast toward an area of high Theta-E extending from Jones/Shackleford countis into Callahan/Brown counties.
There’s a chance this linear complex splits with the better tornadic part moving southward across western San Angelo’s CWA from Fisher south through Nolan and Coke counties where the OUN-WRF 0-1KM SRH forecasts values by 0200 UTC to increase over 200 m2/s2. Meanwhile, the linear activity moving toward Abilene/Throckmorton is moving into an area of 0-1KM SRH less than a 100 m2/s2 for the most part with likely more of a damaging wind/marginal hail threat.
Here is latest MESH and 60 min MESH swatch from the severe activity.
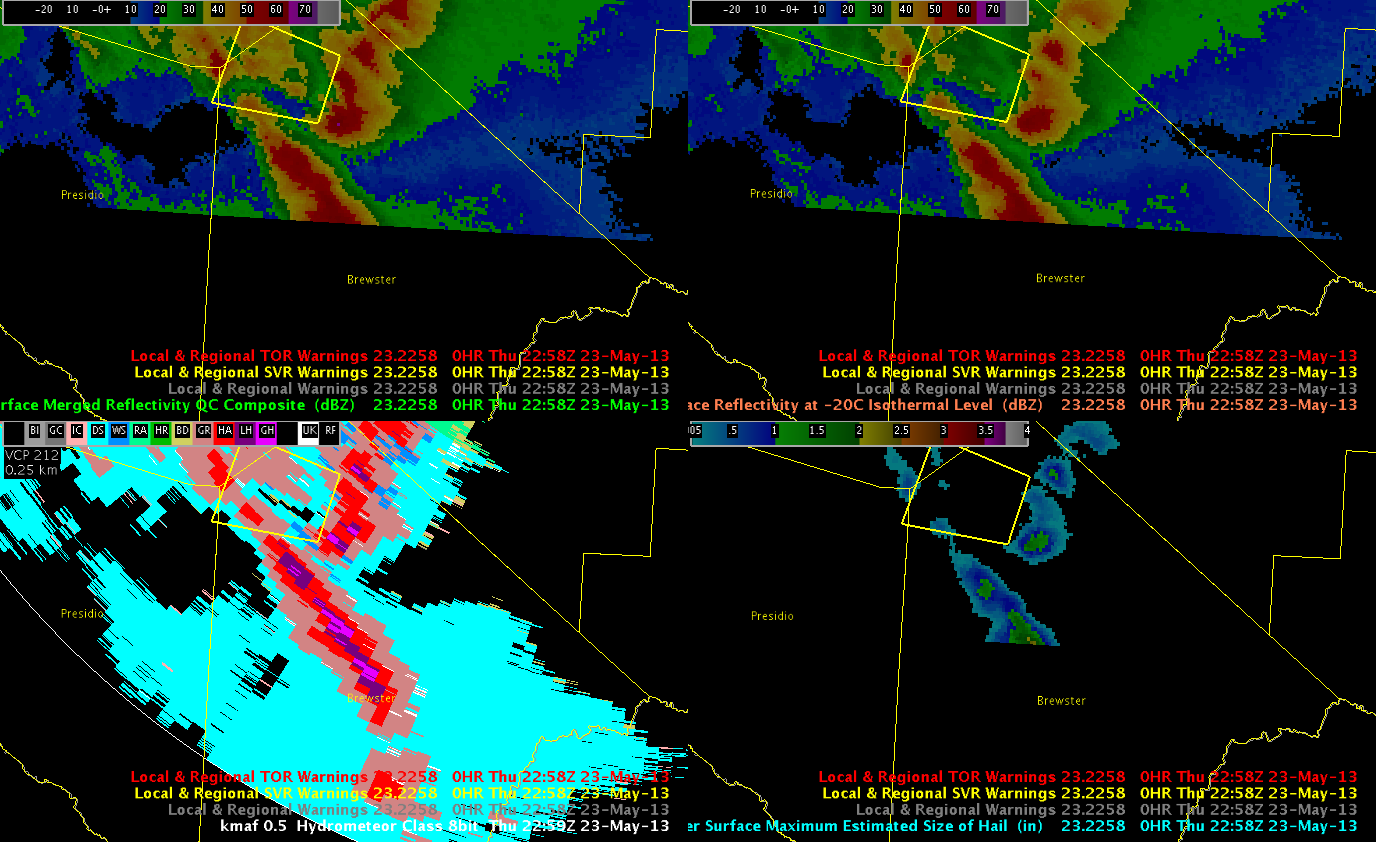
A few more warnings have resulted in the Midland CWA since I switched over. I’ll blog about the most recent. By 2300 UTC I noticed a line of deep convection moving northward through Brewster County, TX. Unfortunately, this area was on the far southern end of our domain today, so I didn’t get HWT specific products until some of the potentially severe portions of these cells may have already been ongoing. Anyway, as you’ll notice, MRMS MESH and HSDA data were indicating potentially severe hail with this line of storms between 2250-2258 UTC. I had to use the KMAF reflectivity data to produce the warning (to see the extent of the line of convection). Nevertheless, you’ll notice that the MESH was as high as about 2 inches in the extreme southern portion of the image. HSDA data at the time was showing a line of categorical giant and large hail.
Image 1. 2258 UTC MRMS and HSDA data, overlaid with SVR warnings. Upper left – MRMS Merged reflectivity QC Composite, MRMS upper right – reflectivity at -20C, lower right – MRMS MESH, lower left – KMAF 0.5 degree HC.
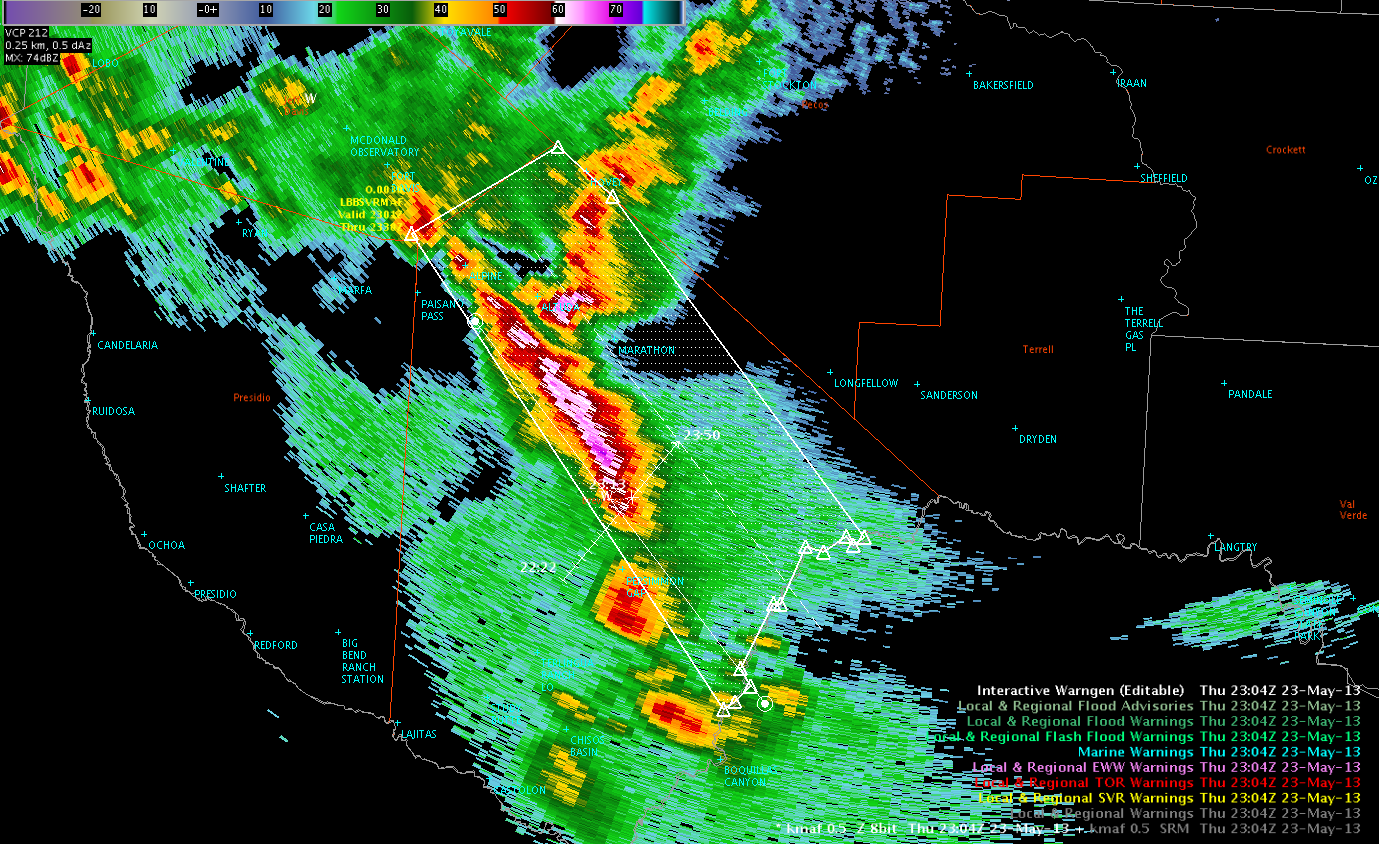
These data prompted me to issue a warning, which went out at 2304 UTC. The following image shows the resulting polygon.
Image 2. 2259 UTC KMAF 0.5 reflectivity and resulting warning polygon.
Any reports so far? No…I’m not real sure to expect any either, but we’ll see.
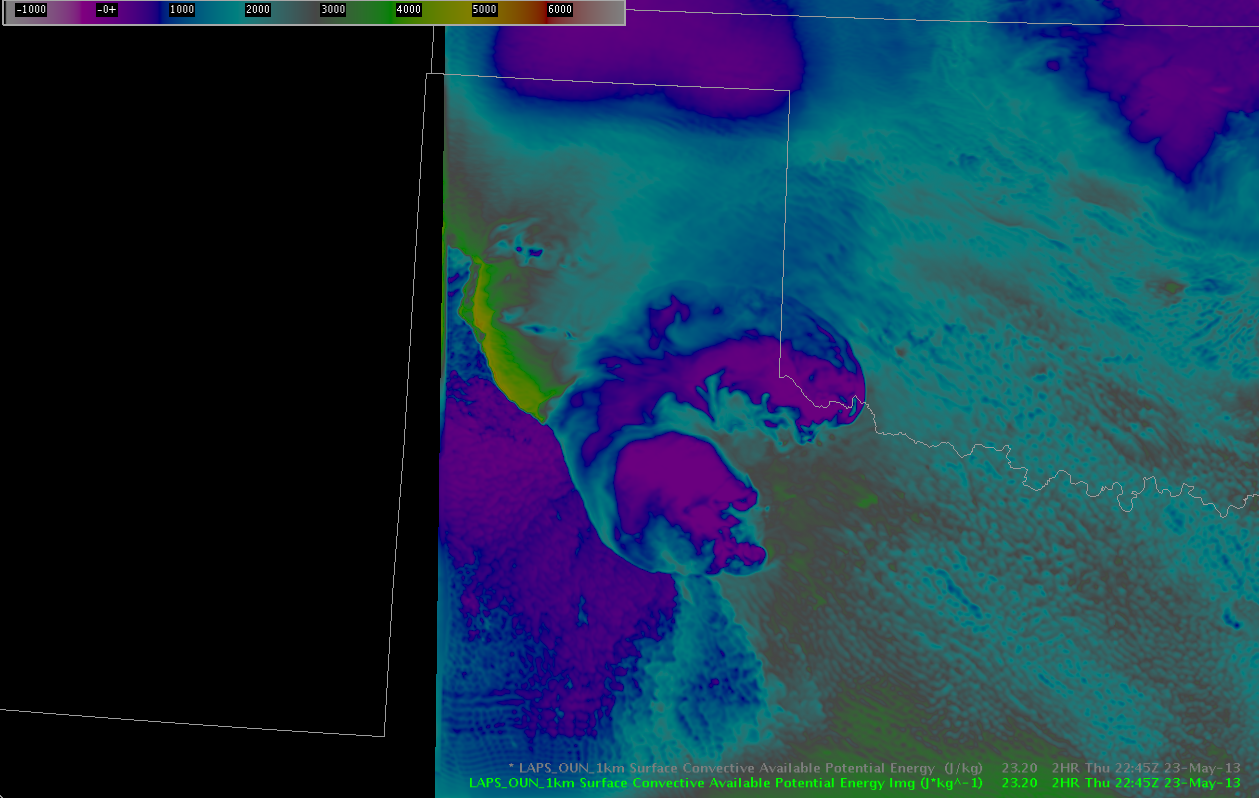
LAPS CAPE fields rather quickly caught onto the idea that the northern LBB/southern AMA area would be dominated by cooler, more stable surface air as a result of outflow from the earlier supercells southeast of Lubbock. The most instability is limited to the far western portions of the CWAs.
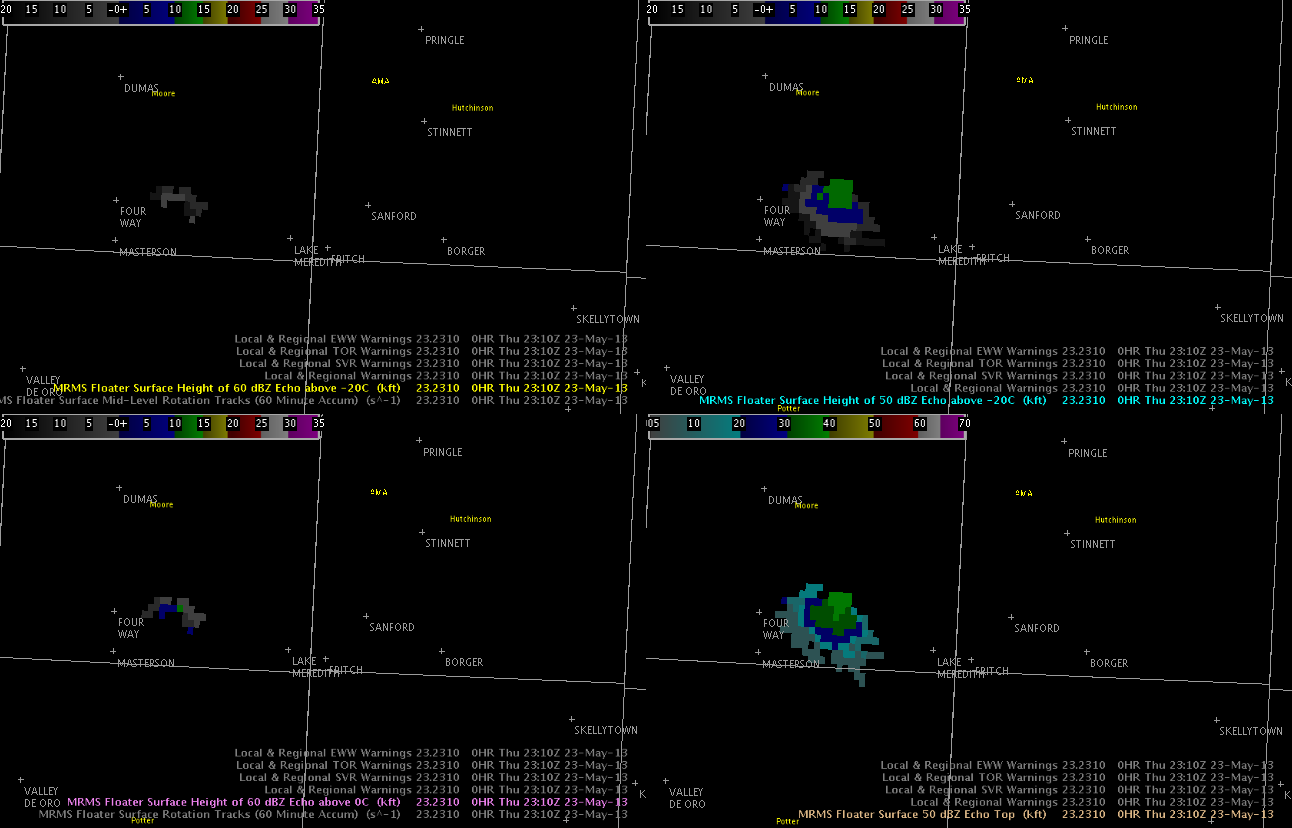
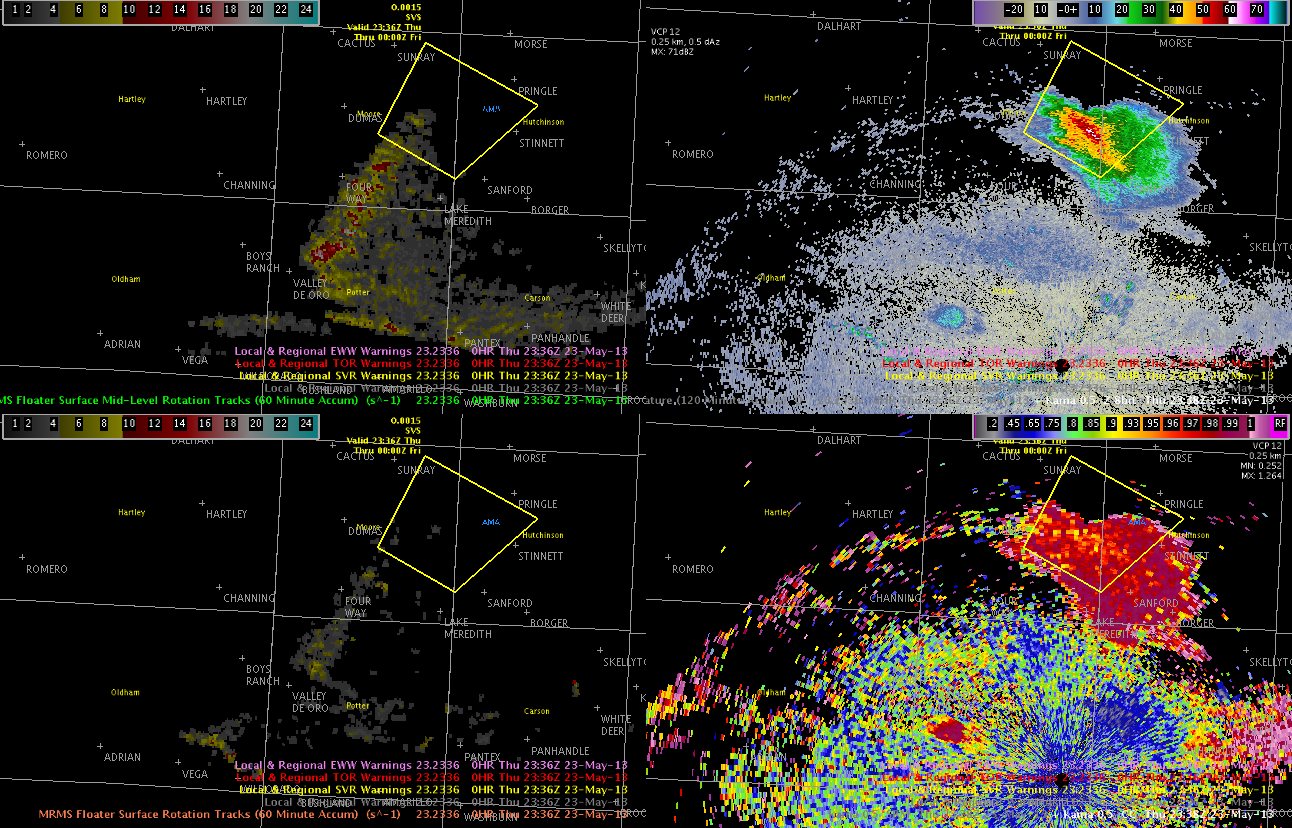
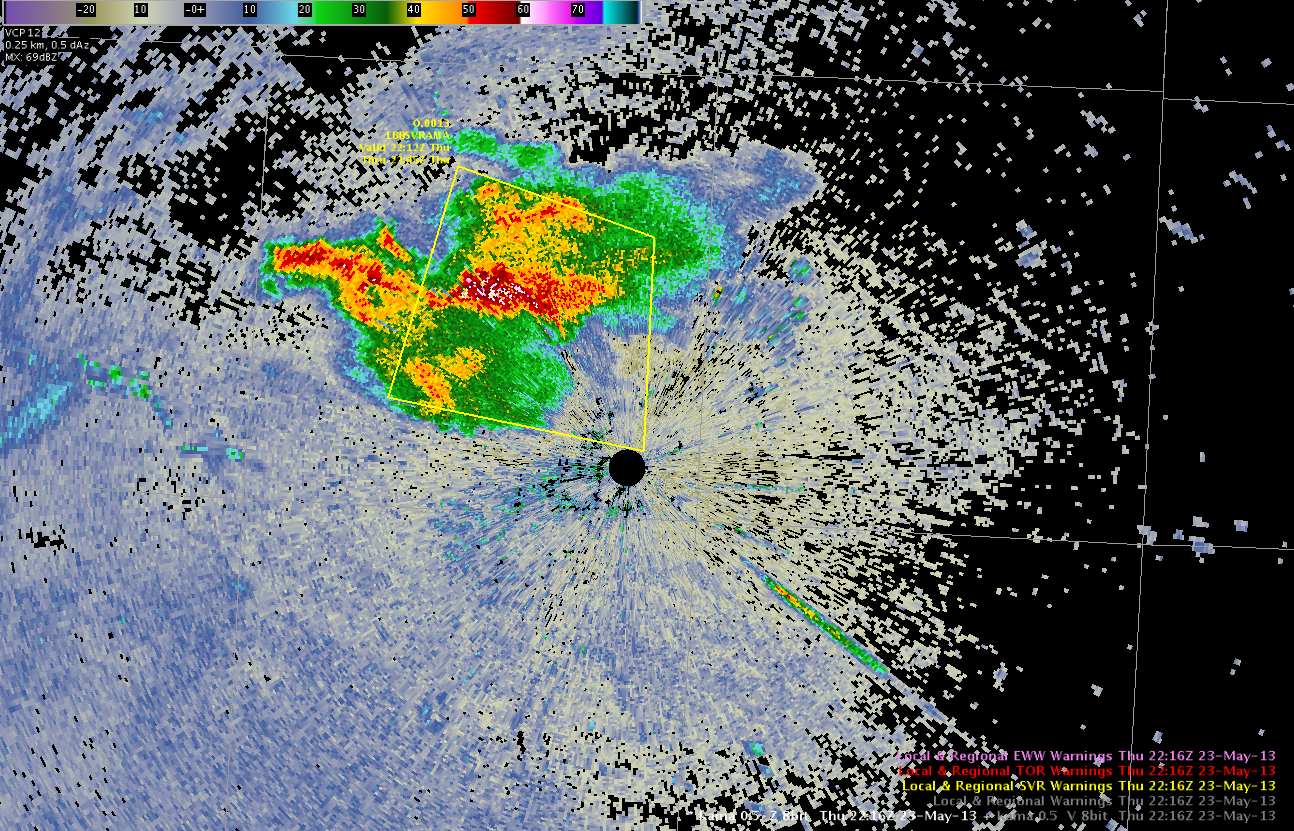
The MRMS products were a big help in this case being able to look at multiple radars since my storm was right near the radar as depicted in the image below. (Wesely)
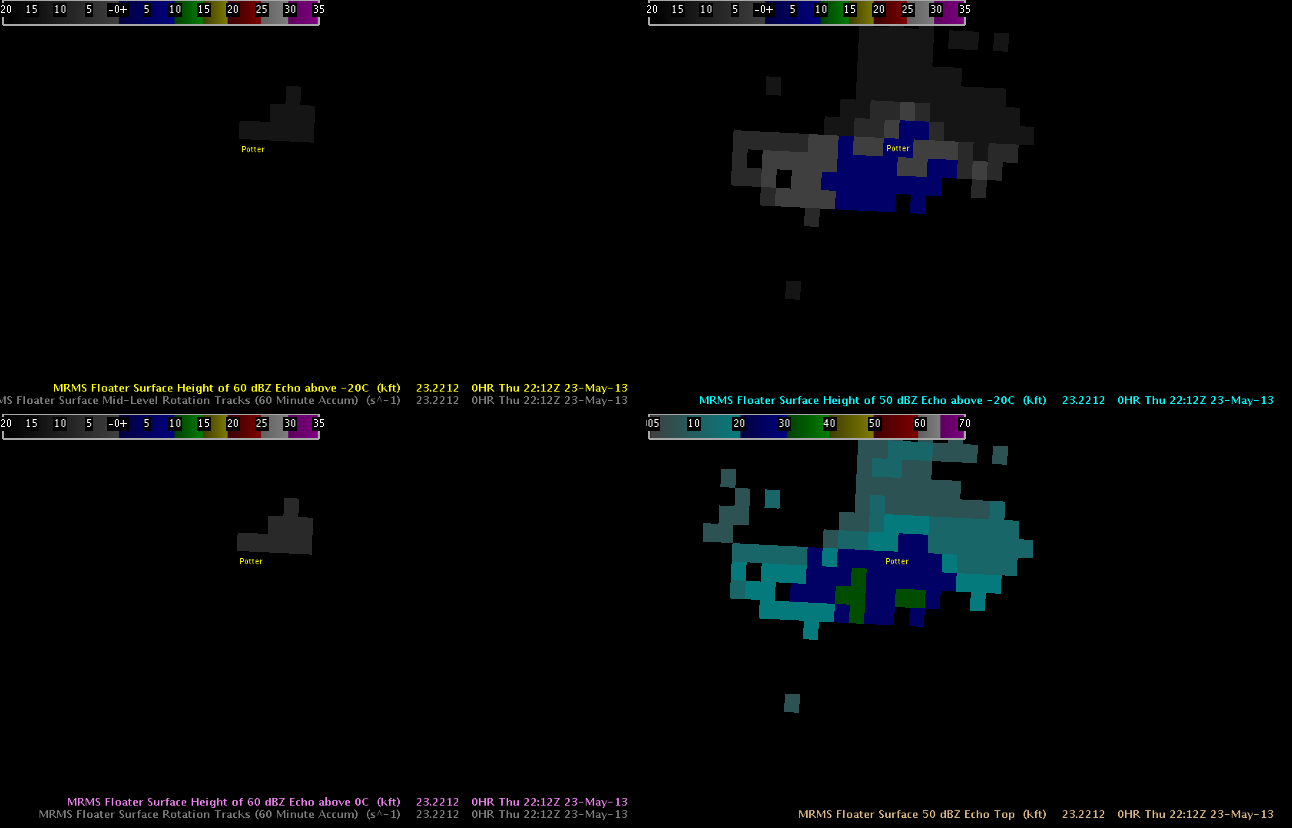
The Height of the 50dbz core went above 30,000ft agl, which was a trigger for issuing the warning. The 4 panel product below made the process easier in two ways. First the storm was near the radar and so having a 50 dbz echo core height product that took into account multiple radars was extremely helpful as the local office radar was unable to see the top of the storm. In addition, you could just look at the one screen and see the 50 and 60 dbz core height quickly without having to look through multiple slices of an adjacent offices radar to find the height of these cores.
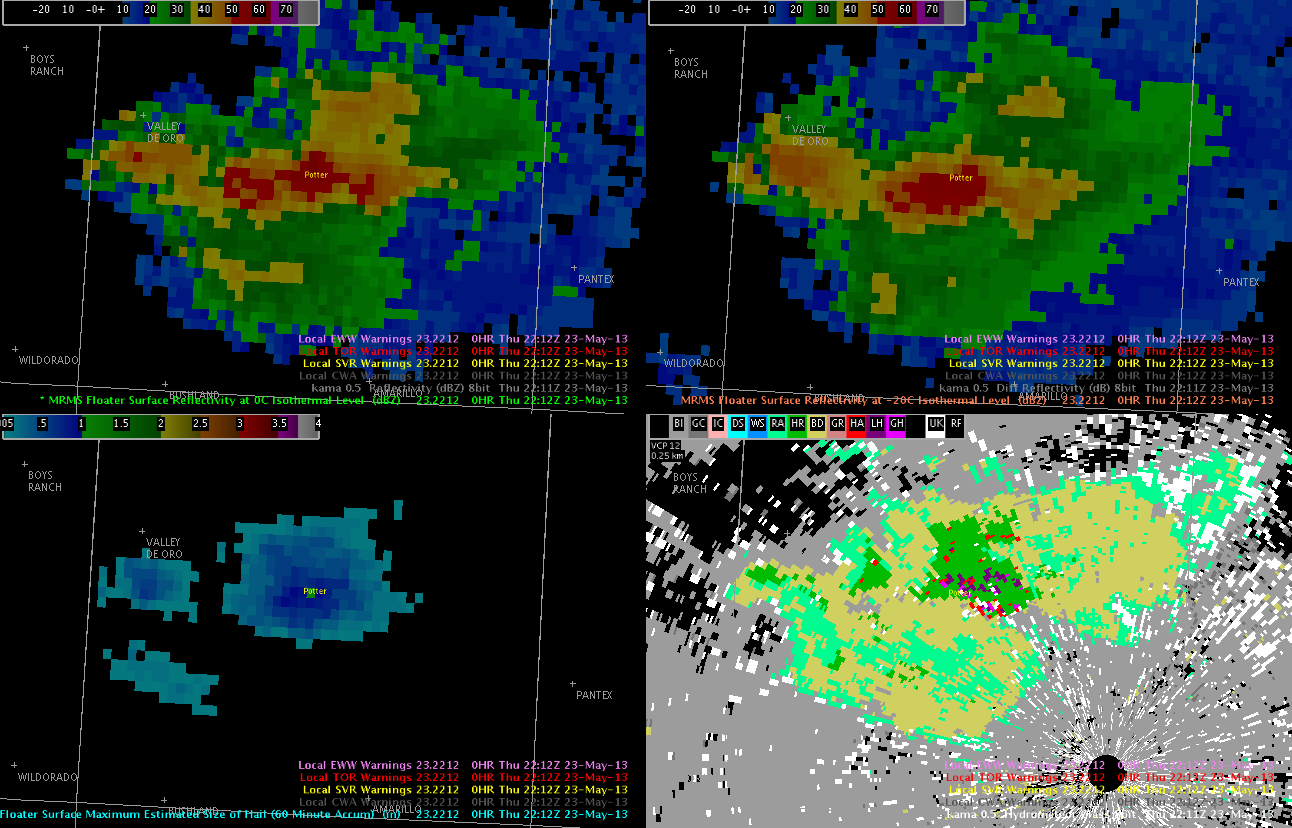
The MESH and HSDA algorithms below both provided lead time for the quarter size hail that fell 11 miles north of Amarillo at 2236Z. The multi radar aspect of the MESH algorithm also made it easier to use than having to look at an adjacent radar to see the top of the storm. The HSDA is not multi radar and thus there were some limitations with this algorithm for the storm near Amarillo due to the close proximity of the storm to the radar.
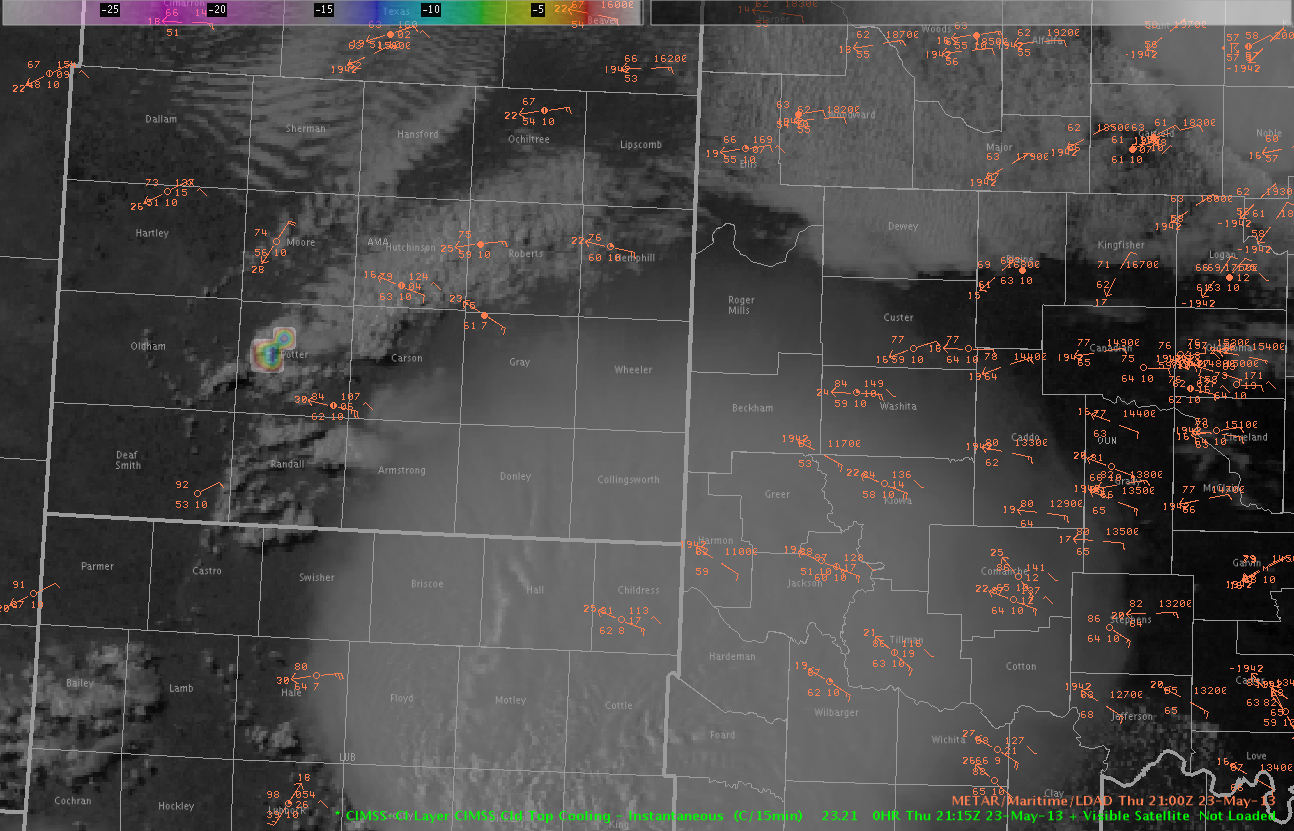
Cloud Top Cooling (CTC) did a nice job of showing that convection was really trying to break out in Amarillo’s County Warning Area (CWA). There were numerous cloud top cooling signatures beginning at 20z. The first 50dbz echo reached the ground at 2146z. So it took awhile but eventually the storms overcame the cap and became severe (See image of CTC below).