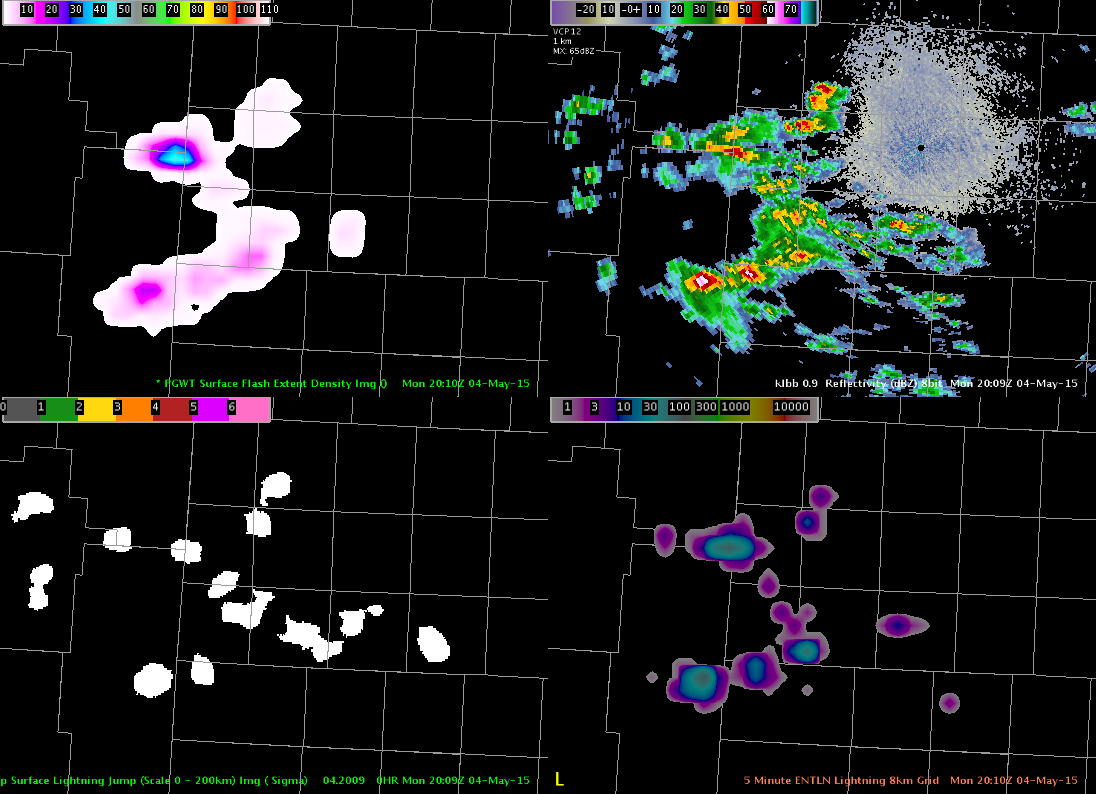
Total lightning has a large role in the Experimental Warning Program this year. We are on day 1 of the first week and everyone is familiarizing themselves with the various products. I have shown an quick comparison of some of the products that we will be evaluating throughout the week.
The storms cooperated by moving into the West Texas LMA domain (Lubbock county warning area) allowing for the first views of the NASA SPoRT pseud-geostationary lightning mapper (PGLM) this year. The image shows the PGLM (upper left), radar reflectivity (upper right), the lightning jump showing the sigma level change using Earth Networks data (lower left), and the Earth Networks total lightning over a 5 min summation and put on an 8 km grid.
The PGLM is showing a maximum value of 41 flashes over a 2 min window with the Earth Networks showing ~40 flashes over a 5 min window. The lightning jump indicated the storm in the north as having a 1-sigma change, which is not enough to indicate severe weather is imminent. The PGLM gives another view of spatial extent of the lightning, which is particularly evident in the northernmost section. The main advantage of Earth Networks is the coverage, unlike the small domains from the lightning mapping arrays that are used to derive the PGLM.