

Image of a severe thunderstorm in Young county in the extreme northwest portion of the DFW CWA. This cell had a 94% SVR PROB rate with 62 dbz to 45000 feet. This cell also saw a good spike in the Earth Networks lightning time series.
Category: General
General Information and News
LUB SRSOR visible animation
About 21Z as storms develop in Castro County and Lynn County
Click to animate And about 2130Z as anvil blows off in Lynn County
-Holaday
CI 15 minute lead time


Region of potential development
This region of partly cloudy skies in the northwest section of the DFW CWA remains relatively untapped. Latest GOES-R super rapid scan shows more clearing in this area and will monitor for potential development. NUCAPS data after modification shows steep low level lapse rates…so convective initiation should be rather easy.
ENI Cell Definitions Critical To Effective Use
Using ENI cell polygons and cell flash rates to monitor for severe storms can be challenging if the cell definitions change to many times during a storms lifecycle. The loop below is a nice example of a supercell storm with a tornado confirmed where the cell definitions kept changing from one to two. Cell trend time v height plots would stop plotting and the user would have to reset the display. Possibly allowing a larger areal extent to a cell would allow isolated storms to remain as one defined cell, making the algorithm data easier to use. The loop below illustrates this well for the storm in question.
Further, I seem to be drawn to the cell flash rate plots for lightning interrogation.
2000z – Ellis County Tornado report
A tornado was reported in Ellis County with tstm near Waxahatchie around 2019z. Due to distance from kdyz radar…we were overshooting the low-level rotational signature. This storm had about 55dbz reflectivity at -20c. Since it was a marginally severe storm…with uncertainty on rotation…no warning was issued.
Possible EWP clues…
GOES R superscan did indicate a strong updraft with visible overshooting tops…although not picked up GOES CI and overshooting top detection.
At 1936z…ENI DTA was alerted on this storm…but CIMSS prob svr never increased more than 20 percent. 
ENI flash rate trace below…showed a rapid doubling in lightning btwn 1940 and 1950z…indicating transition from an ordinary cell to a supercell. The tornado report was during the down trend in lightning. Previous studies have shown that this could be a possible time for tornado development as the storm weakens and rfd collapses.

So GOER R superscan, ENI lightning rate trace, and DTA could have been useful signals to warn on this marginally severe storm development. The ENI lightning trace could have pointed towards potential for tornadogenesis…based on conducive environment and possible weak boundary.
Pickles
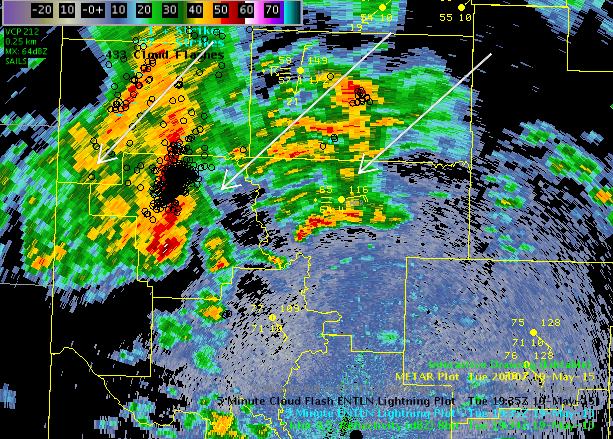
Lightning Jump Success
 Meanwhile, the ProbSevere product showed 54% at 2030UTC then peaked at 74% at 2032UTC. This was after report of the tornado.
ENI Lightning Dip With Tornado
Two tornado reports were received with a storm northeast of Electra, TX near the Red River and around the same time, a drop in the total lightning data was observed. Although the ENI polygons converted to two polygons for the storm at 2020Z, the total lightning drop looks appropriate.
Display: The lightning drop was best seen in the trend box time v height display.
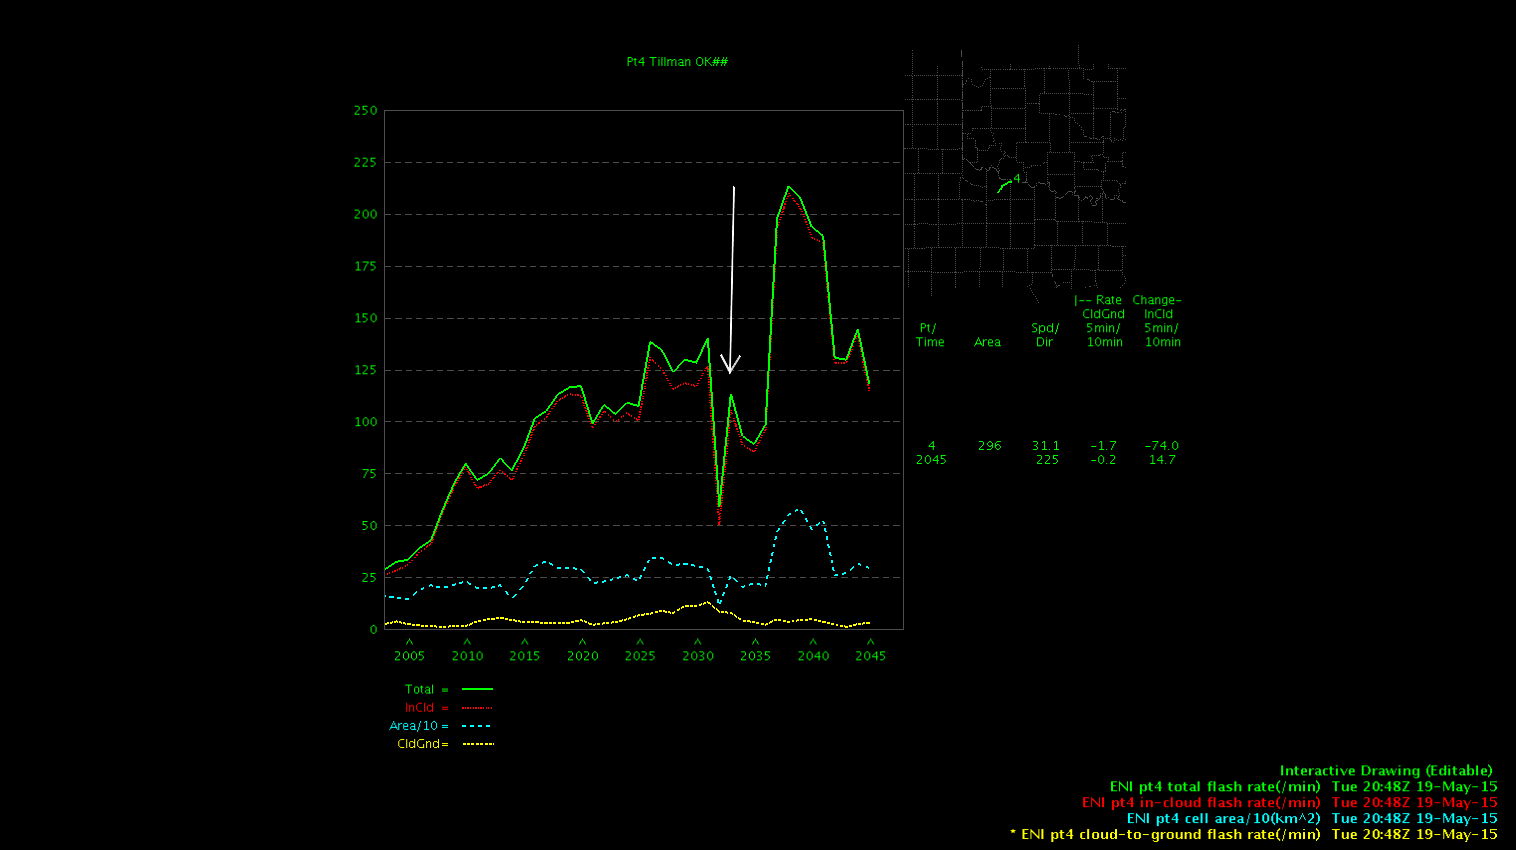
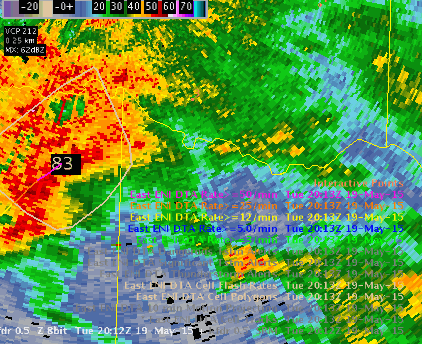
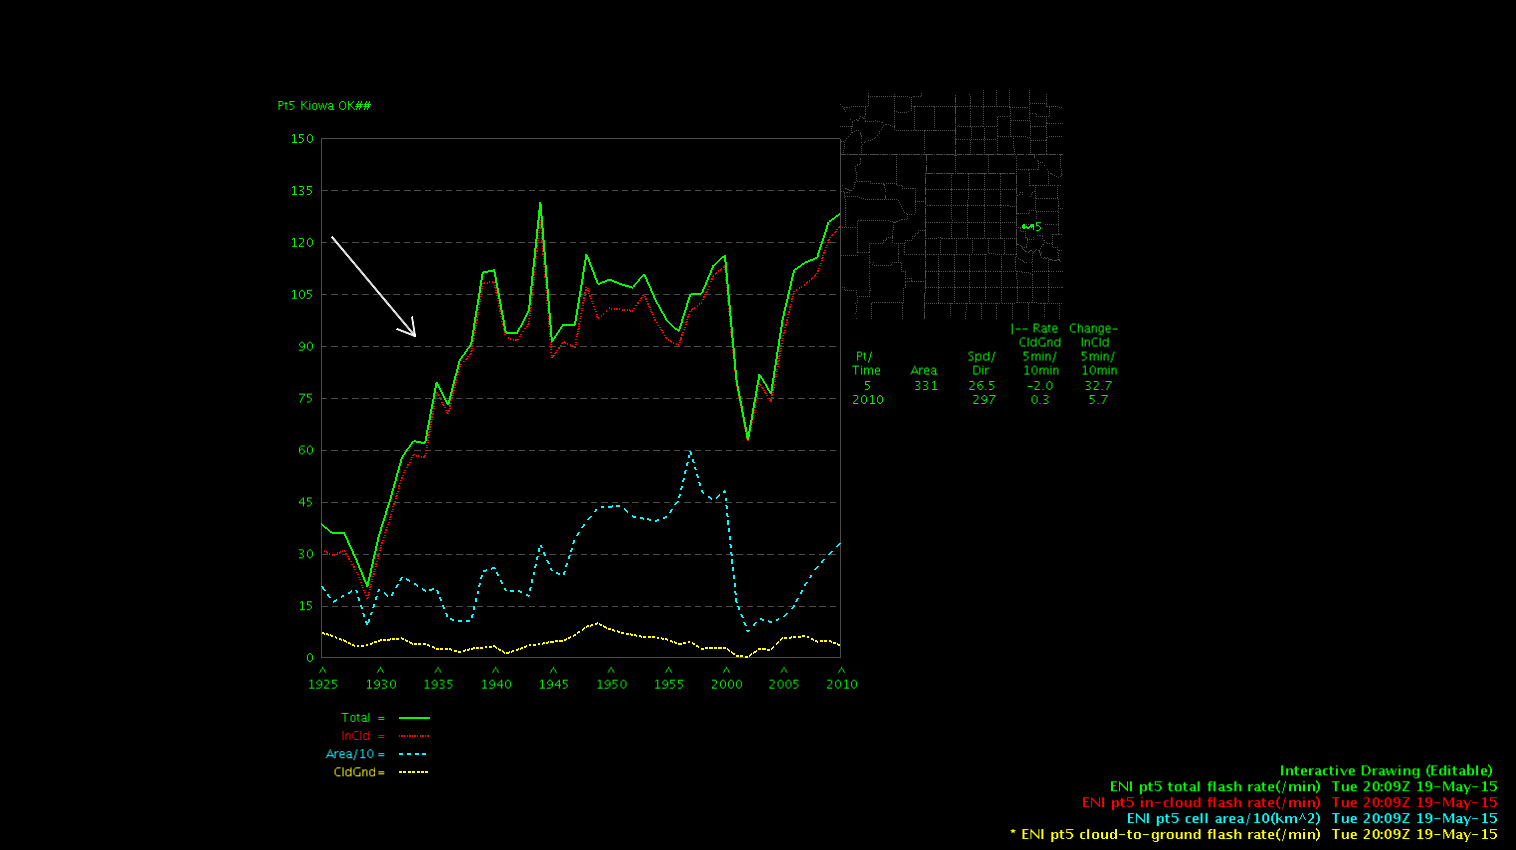
ENI 300% Flash Increase, To Warn or Not To Warn?
As a warning forecaster, trying to weigh a large total flash rate increase with the near-storm environment and radar data can be a challenge. The lightning trend jumped from about 30 flashes to around 120 in 15 mins (see trend box graphic with cyan arrow) for a line segment along a stationary front and CAPE gradient. From a warning perspective, the jump in lightning increased my SA for that storm cluster and I awaited for signs of increase in the radar signals. However, knowing the storm was in a modest CAPE pool and on the frontal/CAPE gradient, I did not have the confidence to warn on the lightning jump alone. The jump began at 1930Z, as of 2025Z there have been no reports or further severe indications in the radar data.
Display: I find the ENI Cell Polygon rate numeric plots (inside the black box) and polys most useful to draw me in, in concert with a trend box for the cell in another pane. I found myself looking beyond or over the alert polygons, not taking the information into my processing.
Data QC: The trend information box plots matched the plan view flash data well.
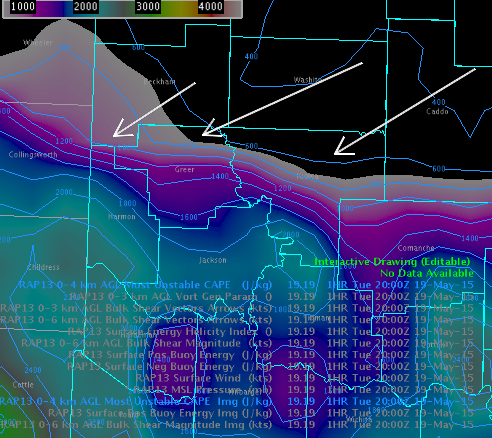
Images: Cyan arrow indicate the frontal boundary. The storm of interest was in northern Greer county.
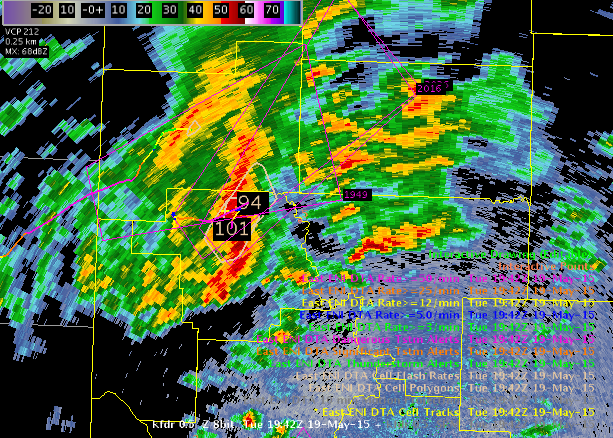
Prob severe rate
Issued severe thunderstorm warning for hail. Prob severe ranged from 90 to a maximum of 94%, which lined up well with with my warning thoughts.