Summary – 12 May 2008

Given the dearth of severe weather today, we went ahead and had all the participants (Dan M. Dan P. Dave H., Eve G. and Ron P.) sit through the briefings for each project (CASA, PAR and PROBWARN) after the orientation.

This evening, Dan P. and Dave H. are running though a CASA case with Brenda and Ellen. Dan M. and Ron P. are working a PAR case with Greg S. and Arthur.

Greg has offered a few comments regarding the PAR playback case(s), in general. He notes that the incoming data may be arriving too quickly, effectively bogging down the display when viewing cross sections. [Note: this is something that I encountered trying to run/view the PAR in realtime over the past year or two.] We can certainly take care of this in the w2simulator, but Greg ponders whether this should be done for realtime viewing.

EDIT (by Greg): Since the PAR already updates so rapidly, we could consider updating a volume scan at a time. This would provide ~60s updates of all tilts at once, and only “lock up” the display one time per minutes, rather than every 5s which is the current wg polling interval.

Comments by Ron and Dan (as well as Greg and Arthur) suggest that getting 88D data (KTLX, KFDR, etc.) for the PAR playback cases would be very helpful.

Kevin Manross (EWP Weekly Coordinator, 12-16 May)

Tags: None

Summary – 8 May 2008

Cynthia and Craig’s warnings have two high probability hail swaths for the lead supercell and the trailing storm that continued to advect downstream and decrease slightly in probabilities until they updated the threat areas. At one point the NWS issued one SVR polygon to cover both the storms but then broke it up. Upon review, it’s apparent the advecting threat area allows for more continuous aging off of the swath on the back sides than the NWS severe wx statements. They kept updating everytime the storm moved out of the threat area. There is still some difficulty of comparing hail-only swaths with NWS polygons which cover hail and wind.

There some difficulties handling multi-vertex polygons, such as moving them. Cynthia struggled with moving the polygons. Sometimes she’d inadvertently create multiple vertices.

Brian and Bill were grappling with rapid cycling process of the lead supercell. Their probabilities were more marginal than that of the hail. There was no confirmation despite the number of chasers out there. But they kept the probabilities as high as they were given the mesocylone strengths and the potential for hidden tornadoes. Each meso quickly became wrapped in precip. Later on a line developed south of KDDC with intense horizontal shear across the gust front.

Several vortices wrapped up along the interface and as a response a long, low probability (20%) tornado threat area was added.

The NWS did not issue any tornado warning for the supercell.

There’s some discussion about what TOR probability constitutes a standard warning? Craig would go 40% and Bill would go 50%. Both Bill and Craig don’t relate their warning decision making to a number though Bill didn’t have a problem associating a warning threshold probability here.

Software ran well, even with the big TOR threat area that Brian put out on the squall line.

Jim LaDue (EWP Weekly Coordinator, 5-9 May)

Tags: None

Summary – 7 May 2008

There was little doubt today that convection would occur in the CASA and PAR domains. An upper low tracked across southern and central OK while the surface low tracked basically underneath. The strongest low-level jet and low-level vertical wind shear was to remain east of the dryline, or along I-35 south of OKC and points east. This is where most forecasters (e.g., SPC, EWP, WFO) thought the best tornado potential would be. However, we failed to appreciate the potential for large amounts of ambient vertical vorticity to produce tornadoes provided sufficient amounts of convection. The low-level low tightened amidst an abundance of cold core convection forming in western OK and eventually, central Oklahoma, where several nonmesocyclonic tornadoes formed including two in northern Oklahoma City, one just 2 miles south of the National Weather Center, and one near Paoli.

While in the CASA domain, the convection also helped intensify the cold front coming in from the west. The result was a damaging wind event. One area of convection surged across Lawton to Chickasha resulting in damaging winds in both places. In fact both the Lawton and Rush Springs radar sampled winds in excess of 60kts in the closest range gates. The Lawton radar stopped reporting for about an hour after it experienced severe winds.

The developing squall line came into central OK in two segments. A north-south segment approached OKC accompanied by a gust front with substantial vertical vorticity. One TVS formed near Lake Overholser producing a tornado there which tracked a couple miles to the northeast (see Travis Smith’s damage survey description). A second circulation developed near Edmond and tracked southeast. This segment of the squall line was centered within the larger scale low and the PAR could easily detect the rotation of individual cells around a common center. The PAR could also more easily detect the evolution of the circulation centers than with the KTLX radar. The other segment came in toward Norman from the southwest and represented the eastward continuation of the severe gust front within the CASA network. Substantial vertical vorticity along this gust front allowed one TVS to form just south of Norman which then produced an EF0 tornado along the Norman/Noble border. The PAR was focused on the OKC storms and thus was unable to cover the Norman TVS. However the TDWR did sample this feature at a one minute frequency and was able to detect a TVS with a 50kt Delta-V. Members of the EWP watched the ragged cone-shaped funnel to the south of the National Weather Center around 2225 UTC.

CASA summary:

Brian and Craig worked the CASA network. They found the following advantages:

  • Gradients in velocity were much larger in the CASA than the 88D as noted in 2006 UTC
  • Peak velocities were slightly larger in the CASA than the 88D. While both radar types showed severe values, the CASA radars showed those values at a much lower elevation. Both the Lawton and Rush Springs radar showed >60kts at their respective nearest range gates.
  • The RHI were extremely useful and was used at least on 2032 UTC, 2121 UTC, and 2131 UTC. The RHI was generated automatically from each radar in each scan along the radial containing the highest reflectivity.
  • The 3DVAR wind speed analysis proved especially useful to the forecasters as it depicted 2-D winds that appeared to have agreed with the radial velocity base data for several wind events, especially the Lawton area and then points northeast from there.
  • The data appeared much cleaner than last year.

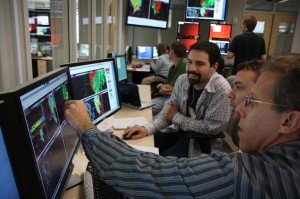
Brian, Craig and Don viewing CASA radar data

There were issues with the CASA too:

  • The RHI, while useful, was too automated. The forecasters wished to have some control over this function in order to follow storm evolution. However the number of storms exhibiting a peak reflectivity in a particular radar’s domain from scan to scan kept changing the RHI azimuth.

PAR summary:

Kristen operated the PAR selecting 90 deg sectors while Bill evaluated its usefulness in warnings. There were certain advantages with the the PAR over the 88D

  • At 2020 UTC, the PAR could detect low-level circulation 3-4 min prior to the 88D in the supercell approaching Pauls Valley.
  • At 2131 UTC, the PAR showed an azimuthal velocity couplet (low-level circulation) at a merger of a small echo with a larger echo in northern Garvin county. The KTLX radar did not show it as well.
  • At 2216 UTC, the PAR was able to track the evolution of small vortices along the gust front in western Oklahoma county. The KTLX radar could detect them but not track their evolution given the temporal frequency of its scans.
  • At 2221 UTC, the PAR could easily track the 2-D motion of reflectivity echoes around a common center in northern Oklahoma county.

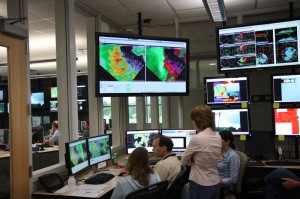
Dr. Pam Heinselman looks onward as the PAR evaluation team monitor a swirling mass of convection over Oklahoma City.

There were some issues with the PAR, and WDSS-II’s capability of displaying its data

  • Storms moving across radials at close ranges required frequent sector updating
  • Bill had issues attempting to view virtual volume scans with interlaced VCPs in WDSS-II
  • The PAR data is very useful when looped at high speeds. WDSS-II needs the capability to display long loops at high speeds where users can scrub the loop back and forth with VCR and other types of controls (e.g., see Hunter/Gatherer software).

Jim LaDue (EWP Weekly Coordinator, 5-9 May)

Tags: None

Summary – 6 May 2008

Bill sais this is more intense than standard warning ops for the same event. It’s more mentally challenging. Though he thinks it’s a matter of learning the ropes and it’s not as bad as he thought it’d be.

Craig thinks it could be easier with more familiar software. He’d like it tailored to AWIPS. Good plugin for AWIPS2.

This was a messier day than expected due to mode of initiation and relatively dry boundary layer.

Today started in the middle of a supercell south of MAF. Bill and Kristen didn’t have a tor threat when they started though there was an official tornado warning. They weren’t really concentrating on the tor threat at the time.

There’s an interesting difference in shape of swath vs official warning at 2353 SW of MAF. The official warning polygon was county-centric.

Meanwhile in SE NM there was a supercell initiation with a classic split. The initial storm started with one swath and they followed the right mover with the same swath. The left split popped out of the threat until they recovered with a new swath.

At 0113 UTC, there’s a good example of a continuously updated threat that provided an advantage of leadtime in far eastern NM with the right-moving supercell.

Up with the north team, Craig and Brian, there was the triple point multicell with great promise but didn’t pan out. Meanwhile there was a NE-SW cluster of individual multicells south of LBB that was broadbrushed with a big hail threat area. Brian thought the storms were too pulse-like that precluded producing individual swaths given a one person team. Maybe experience would help. Brian thought the threat area IDs in the dialogue box should be color coded by threat type.

They had merging issues and new areas spawning in this loosely organized cluster of multicells. They issued a wind and tornado threat for some of the multicells exhibiting these signatures southeast of LBB. But I don’t think they would’ve issued a real tor warning.

At 0150 UTC, there’s a continuous swath while there’s a gap in official polygons west of Knox county.

Jim LaDue (EWP Weekly Coordinator, 5-9 May)

Tags: None

Summary – 5 May 2008

This evening featured a supercell with large hail near GCK that merged with a line to the east and became an outflow dominated multicell event. The hail threat decreased as largescale wind threat increased. This team consisting of Bill, Craig, Cynthia and Brian focused on hail threats given their unfamiliarity with the probwarn software.

The big difficulty today is going from single to large multicell mode. Craig wonders how much longer a probabilistic warning should continue after a legacy warning expires? Bill’s worried about how to transition from isolated to large multicell threat areas? This storm underwent such a transition and they kept the single cell mode for a long time after merger began.

The team consisted of one member operating the familiar D2D for radar base data analysis while another team member operated the probwarn software. Two other team members contributed to the discussion. This setup appeared to work very well with lot’s of interaction.

Given the probabilities, what do they mean? Bill sais he’s comfortable with them because he associates high probability to his thinking when he’s doing warning decision making in the current way.

Jim LaDue (EWP Weekly Coordinator, 5-9 May)

Tags: None

Summary – 1 May 2008

Note that the event occurred across 00 UTC, but we’ll label the summary on the starting date of operations…

We had several tornadic supercells in Central OK today. The first storm developed just west of Norman and noved over the eastern side of the OKC metro, producing a weak tornado. Two other storms developed north, and at least one of these produced a signficant tornado near Ralston.

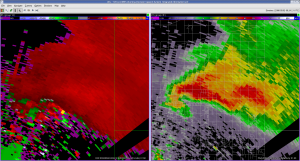
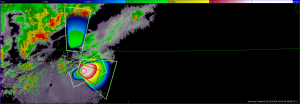
Our visitors, Dave, Mike C., and Andy, worked a PAR IOP today with Pam and Les. Here is an image of the OKC supercell at the time it produced an F0 tornado:

Mike M. also worked a gridded warning IOP on the same storm, concentrating mostly on tornado threat areas. Our IOP lasted about 3 hours, after some gridded warning software issues delayed our start by 1 hour.

MM and I discussed the possibility of another type of warning team concept…use the NWS forecaster as the radar analyst, on the AWIPS machine, and making the decisions of warn, where, and the attributes, and let someone with better proficiency with WDSSII (perhaps an NSSL person) draw the contours. Something for us to think about in future weeks with the experiment, since the WDSSII knobology is a challenge for the visitors.

Greg Stumpf (EWP Weekly Coordinator, 28 April – 2 May)

Tags: None

Summary – 30 April 2008

We spent the day doing archive case playbacks again with all the participants. However, around 745pm, one severe storms developed in Western Nebraska, too late to begin an IOP (since they must end by 8:30pm). I did some more gridded warning testing and we found a few more minor bugs that need to be issued.

Previous blog entries capture some of the discussion about the gridded warning project. We hope to summarize more of this for the end of week summary. Also, we will be gathering feedback from the PAR and CASA folks.

Greg Stumpf (EWP Weekly Coordinator, 28 April – 2 May)

Tags: None

Summary – 29 April 2008

There was no IOP today.  The forecasters spent the day doing training and archive case playback on the various systems.  This summary will contain our notes from the Gridded Warning archive case playback.

Comments and thoughts from our forecasters:

Knobology of WDSSII getting in the way of science – not comfortable with tool. Perhaps in 3-4 more days, we could be more ready. Consider a 2 week tour with a one-week overlap between tours.

Would be nice to issue hail warnings on Ref and MESH in one pane, and tornado warnings on Ref and Vel on another pane, another monitor, or another workstation.

There was some discussion about the use of low-probabilities for “pre-warnings”. Actually, that is part of the NSSL concept of gridded threat areas – to provide some downstream users who need lower-probability longer lead time information between the watch and warnings time and space scales.

Paul started by issuing threat areas in “swath mode” as is done today in the WFOs, but quickly realized this and adjusted his threat areas accordingly (current threat only).

Paul would like to issue different probs for different parts of the threat area.

Paul and Dave had a hard time with motion vector because it is not shown on the screen. With warngen, there is an arrow and past and future positions.

Most of these technology issues go away if this is fully integrated into D2D.

Definitely helps to have someone who knows the system sitting next to the forecaster.

Dave comments that perhaps the 2nd-week forecasters in the above scenario are the ones issuing the warning, while the first weekers in in training mode – perhaps not working together, so that the “veterans” can really concentrate on the science.

Paul and Dave are concerned about the precision of the prob values – what about every 10%?

Andy – how do we calibrate our probabilities? Perhaps we can integratee the verification into the live system?

Andy – Verification system should be included in the NGWT from the get-go – lesson learned from WRH experience with GFE (see white paper).

Greg Stumpf (EWP Weekly Coordinator, 28 April – 2 May)

Tags: None

Summary – 28 April 2008

Our first day of operations with our visiting forecasters was a moderate success. The orientation briefing went about 30 minutes long, so we didn’t start WDSSII training until 330pm. This will probably be the norm. Once that was complete, we begin training and briefing on the gridded warning experiment. That didn’t end until about 530pm when we morphed into me demonstrating the gridded warning software on the tail end of the event in NE North Carolina and SE Virginia. We did not have a chance to issue warnings on the major tornadoes that occurred today as they happened before we were ready, but there we did issue a few low-probability tornado warnings on the remaining mesocyclones before they went offshore. Our “IOP” lasted only about 90 minutes and then we had a dinner break. Afterwards, each forecaster was given hands-on training with the gridded warning software, and we ended the day with a 30 minutes discussion, captured nicely by Kristin on the live blog. I also made a few “live blog” entries during our “IOP” that I’ll need to clean up.

No pictures to show today since our “IOP” really wasn’t a true IOP (I operated the software most of the time), and we won’t be using these data in any post-analysis. But we may play back a little of the data at the debriefing on Tuesday.

Greg Stumpf (EWP Weekly Coordinator, 28 April – 2 May)

Tags: None

Summary – 24 April 2008

From 3-5pm, I trained Liz Quoetone, Jim LaDue, and Pail Schlatter on WDSSII. At the end of the training session, I tested a bug fix for the gridded warning software, and now, none of the warnings are automagically disappearing any more! Just a few more small issues, and the software should be ready to go.

Starting around 545pm, we began our gridded warning IOP centered on several storm which developed in NW KS. I spent the first hour explaining the software to Liz and Jim. Then, Jim took over the driver’s seat, followed by Liz, and then we wrapped up at 830pm. Several severe storms developed in the area, including one supercell that was a very large hail producer, and possibly a tornado producer. We issue gridded warnings for both hail and tornado on that storm.

During the event, we decided to try a new thing – live blogging. Jim and Liz put their thoughts on the blog as the event was occurring. I’ve decided that this would be a great idea for the gridded warning experiment. The cognizant scientist and/or one of the forecaster/evaluators should blog live during the IOP to share their thoughts in real time. We’ll try to put these live blog on a separate page in the EWP Blog.

Friday is the first of our end-of-week debriefings at 10am. We really don’t have a firm plan for how we are going to conduct these just yet, so we will probably spend some time discussing how we are going to conduct these weekly debriefings in the following 6 weeks.

Greg Stumpf (EWP Weekly Coordinator, 21-25 April)

Tags: None