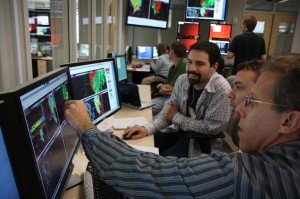
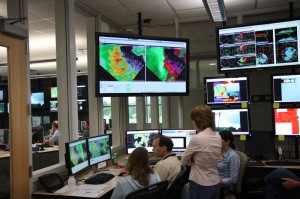
There was little doubt today that convection would occur in the CASA and PAR domains. An upper low tracked across southern and central OK while the surface low tracked basically underneath. The strongest low-level jet and low-level vertical wind shear was to remain east of the dryline, or along I-35 south of OKC and points east. This is where most forecasters (e.g., SPC, EWP, WFO) thought the best tornado potential would be. However, we failed to appreciate the potential for large amounts of ambient vertical vorticity to produce tornadoes provided sufficient amounts of convection. The low-level low tightened amidst an abundance of cold core convection forming in western OK and eventually, central Oklahoma, where several nonmesocyclonic tornadoes formed including two in northern Oklahoma City, one just 2 miles south of the National Weather Center, and one near Paoli.
While in the CASA domain, the convection also helped intensify the cold front coming in from the west. The result was a damaging wind event. One area of convection surged across Lawton to Chickasha resulting in damaging winds in both places. In fact both the Lawton and Rush Springs radar sampled winds in excess of 60kts in the closest range gates. The Lawton radar stopped reporting for about an hour after it experienced severe winds.
The developing squall line came into central OK in two segments. A north-south segment approached OKC accompanied by a gust front with substantial vertical vorticity. One TVS formed near Lake Overholser producing a tornado there which tracked a couple miles to the northeast (see Travis Smith’s damage survey description). A second circulation developed near Edmond and tracked southeast. This segment of the squall line was centered within the larger scale low and the PAR could easily detect the rotation of individual cells around a common center. The PAR could also more easily detect the evolution of the circulation centers than with the KTLX radar. The other segment came in toward Norman from the southwest and represented the eastward continuation of the severe gust front within the CASA network. Substantial vertical vorticity along this gust front allowed one TVS to form just south of Norman which then produced an EF0 tornado along the Norman/Noble border. The PAR was focused on the OKC storms and thus was unable to cover the Norman TVS. However the TDWR did sample this feature at a one minute frequency and was able to detect a TVS with a 50kt Delta-V. Members of the EWP watched the ragged cone-shaped funnel to the south of the National Weather Center around 2225 UTC.
CASA summary:
Brian and Craig worked the CASA network. They found the following advantages:
- Gradients in velocity were much larger in the CASA than the 88D as noted in 2006 UTC
- Peak velocities were slightly larger in the CASA than the 88D. While both radar types showed severe values, the CASA radars showed those values at a much lower elevation. Both the Lawton and Rush Springs radar showed >60kts at their respective nearest range gates.
- The RHI were extremely useful and was used at least on 2032 UTC, 2121 UTC, and 2131 UTC. The RHI was generated automatically from each radar in each scan along the radial containing the highest reflectivity.
- The 3DVAR wind speed analysis proved especially useful to the forecasters as it depicted 2-D winds that appeared to have agreed with the radial velocity base data for several wind events, especially the Lawton area and then points northeast from there.
- The data appeared much cleaner than last year.
There were issues with the CASA too:
- The RHI, while useful, was too automated. The forecasters wished to have some control over this function in order to follow storm evolution. However the number of storms exhibiting a peak reflectivity in a particular radar’s domain from scan to scan kept changing the RHI azimuth.
PAR summary:
Kristen operated the PAR selecting 90 deg sectors while Bill evaluated its usefulness in warnings. There were certain advantages with the the PAR over the 88D
- At 2020 UTC, the PAR could detect low-level circulation 3-4 min prior to the 88D in the supercell approaching Pauls Valley.
- At 2131 UTC, the PAR showed an azimuthal velocity couplet (low-level circulation) at a merger of a small echo with a larger echo in northern Garvin county. The KTLX radar did not show it as well.
- At 2216 UTC, the PAR was able to track the evolution of small vortices along the gust front in western Oklahoma county. The KTLX radar could detect them but not track their evolution given the temporal frequency of its scans.
- At 2221 UTC, the PAR could easily track the 2-D motion of reflectivity echoes around a common center in northern Oklahoma county.
There were some issues with the PAR, and WDSS-II’s capability of displaying its data
- Storms moving across radials at close ranges required frequent sector updating
- Bill had issues attempting to view virtual volume scans with interlaced VCPs in WDSS-II
- The PAR data is very useful when looped at high speeds. WDSS-II needs the capability to display long loops at high speeds where users can scrub the loop back and forth with VCR and other types of controls (e.g., see Hunter/Gatherer software).
Jim LaDue (EWP Weekly Coordinator, 5-9 May)


