TDS CPTI Evaluation

A tornado produced a TDS in the SW part of the Tulsa WFO CWA at 21:44Z. Maximum TDS height was ~6kft.

The CPTI adequately represented an increase chance of a strong tornado (18-20%, top left).

It appears this CPTI did not have the same issues with effective STP like yesterday’s St. Louis tornado did. I like this product a lot! -Atlanta Braves

AzShear and CPTI helping to lead to tornado warning decision

On May 22 at around 2130Z, a tornado warning (test) was issued for Okfuskee County in the Tulsa CWA. Besides the usual examination of base velocity data, other tools that were used to help the decision were the merged AzShear products and the CPTI products. Watch the loop below.

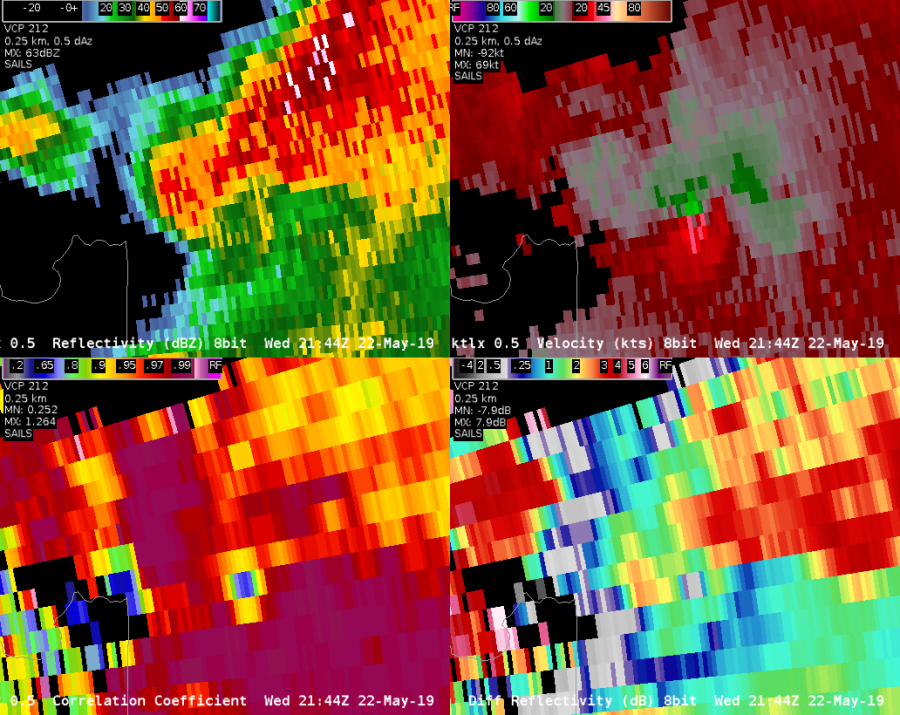
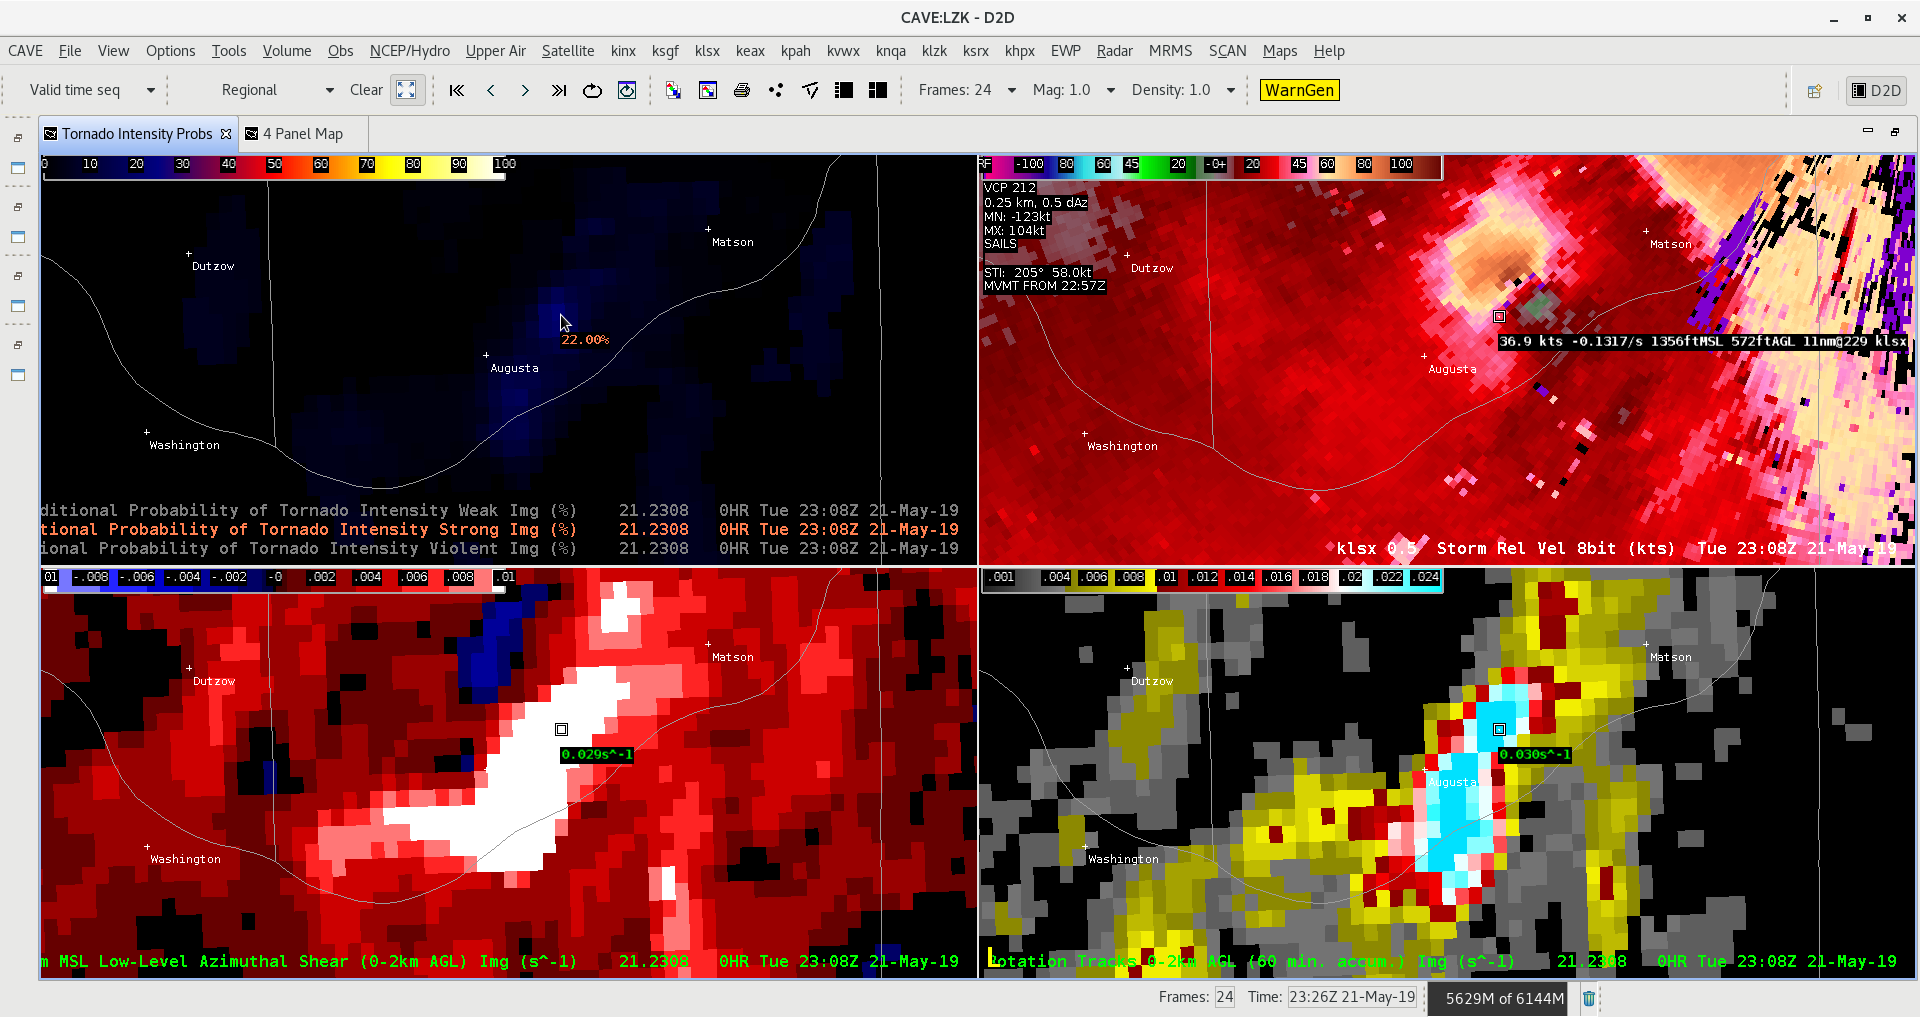
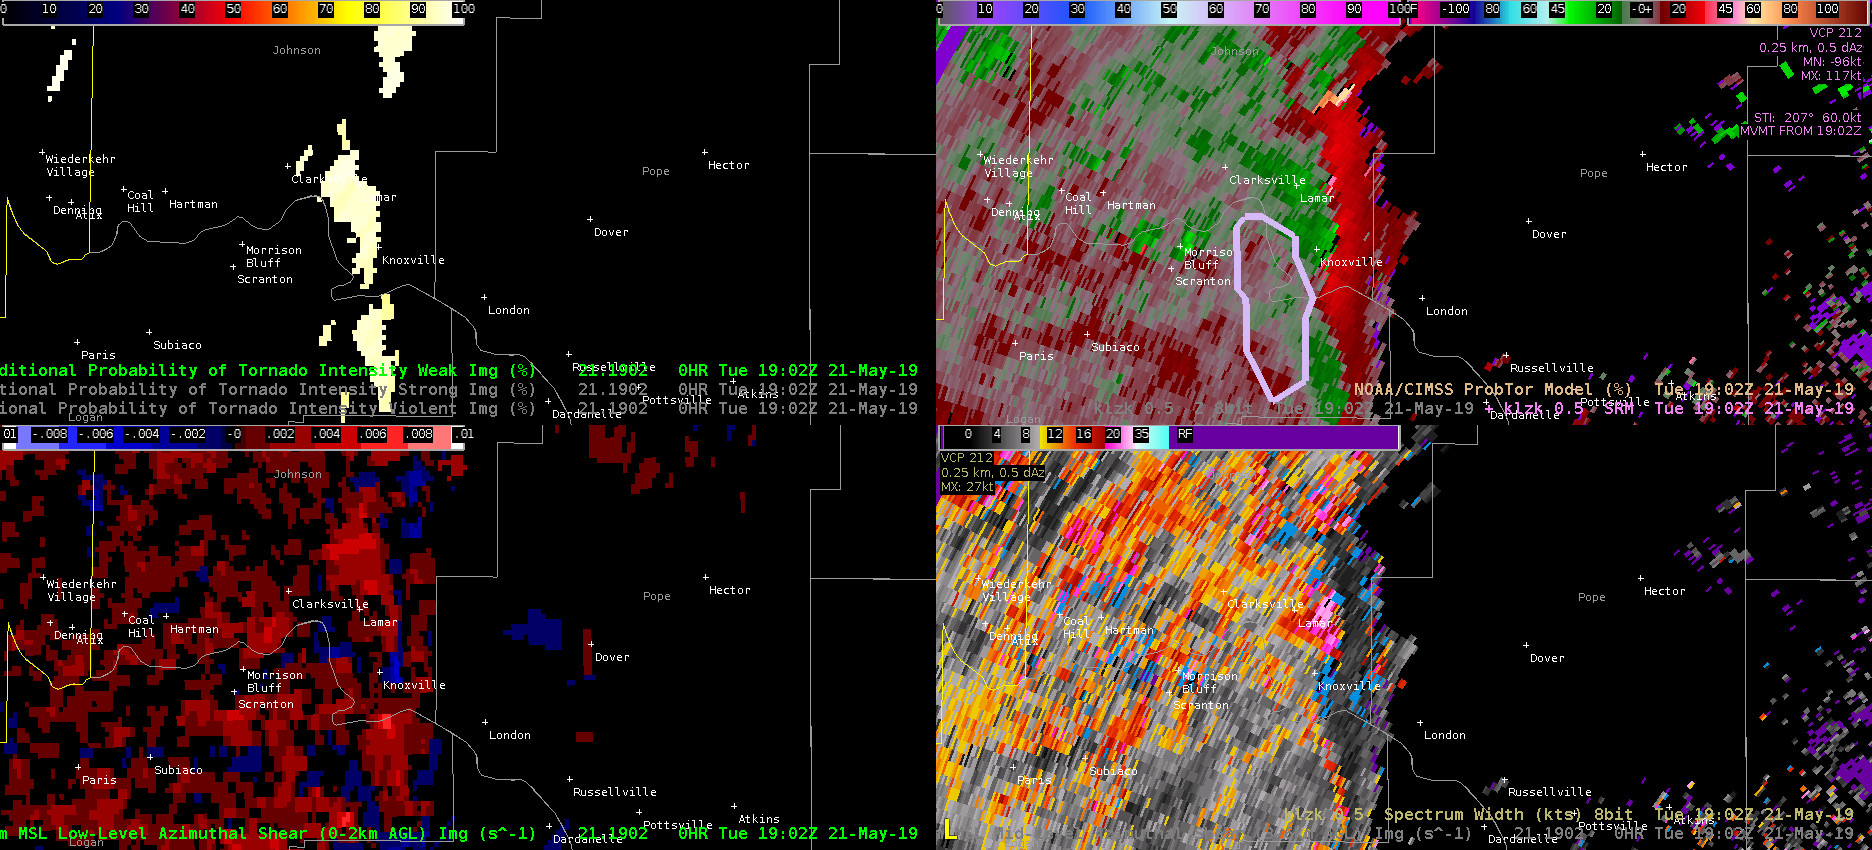
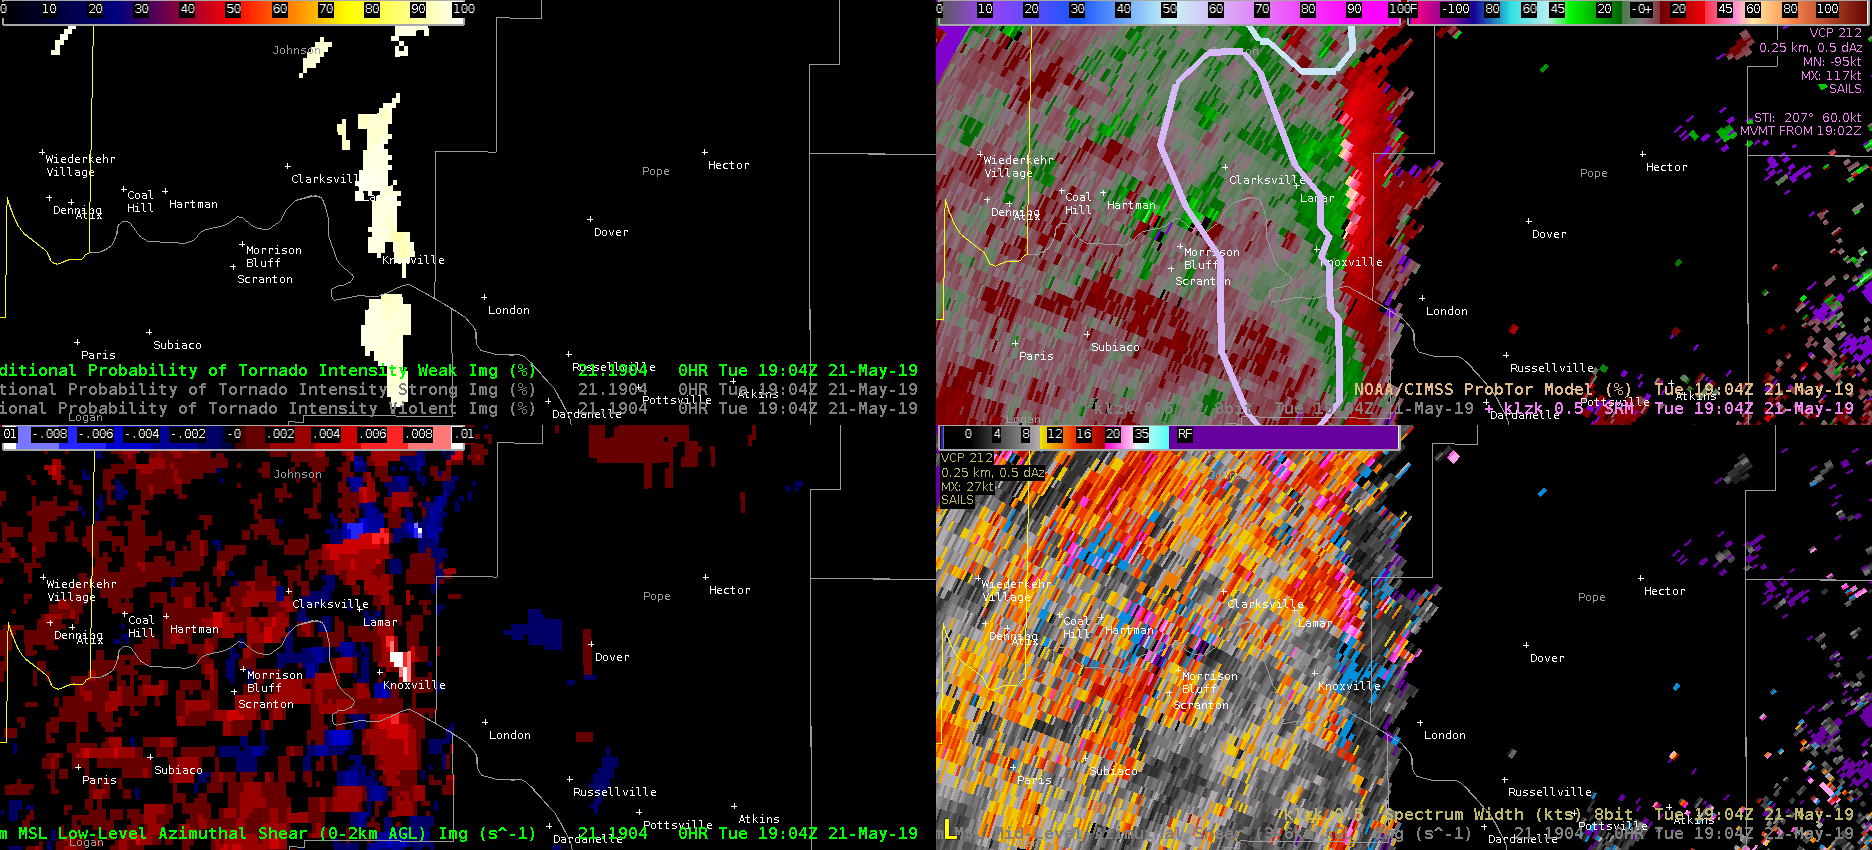
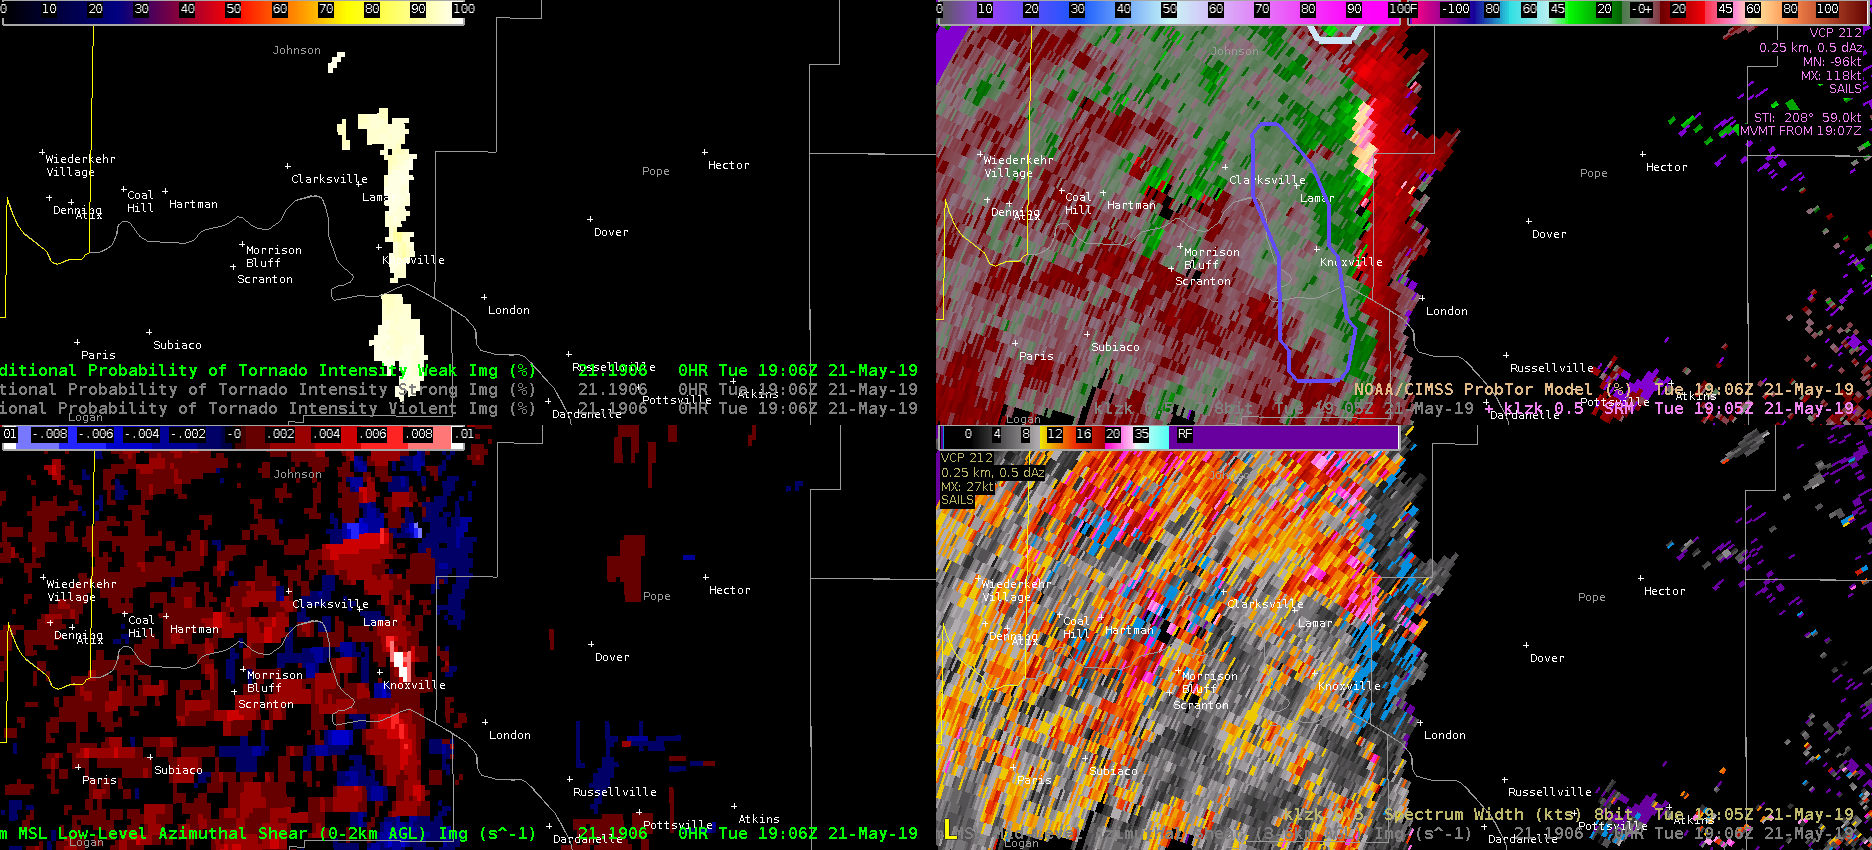
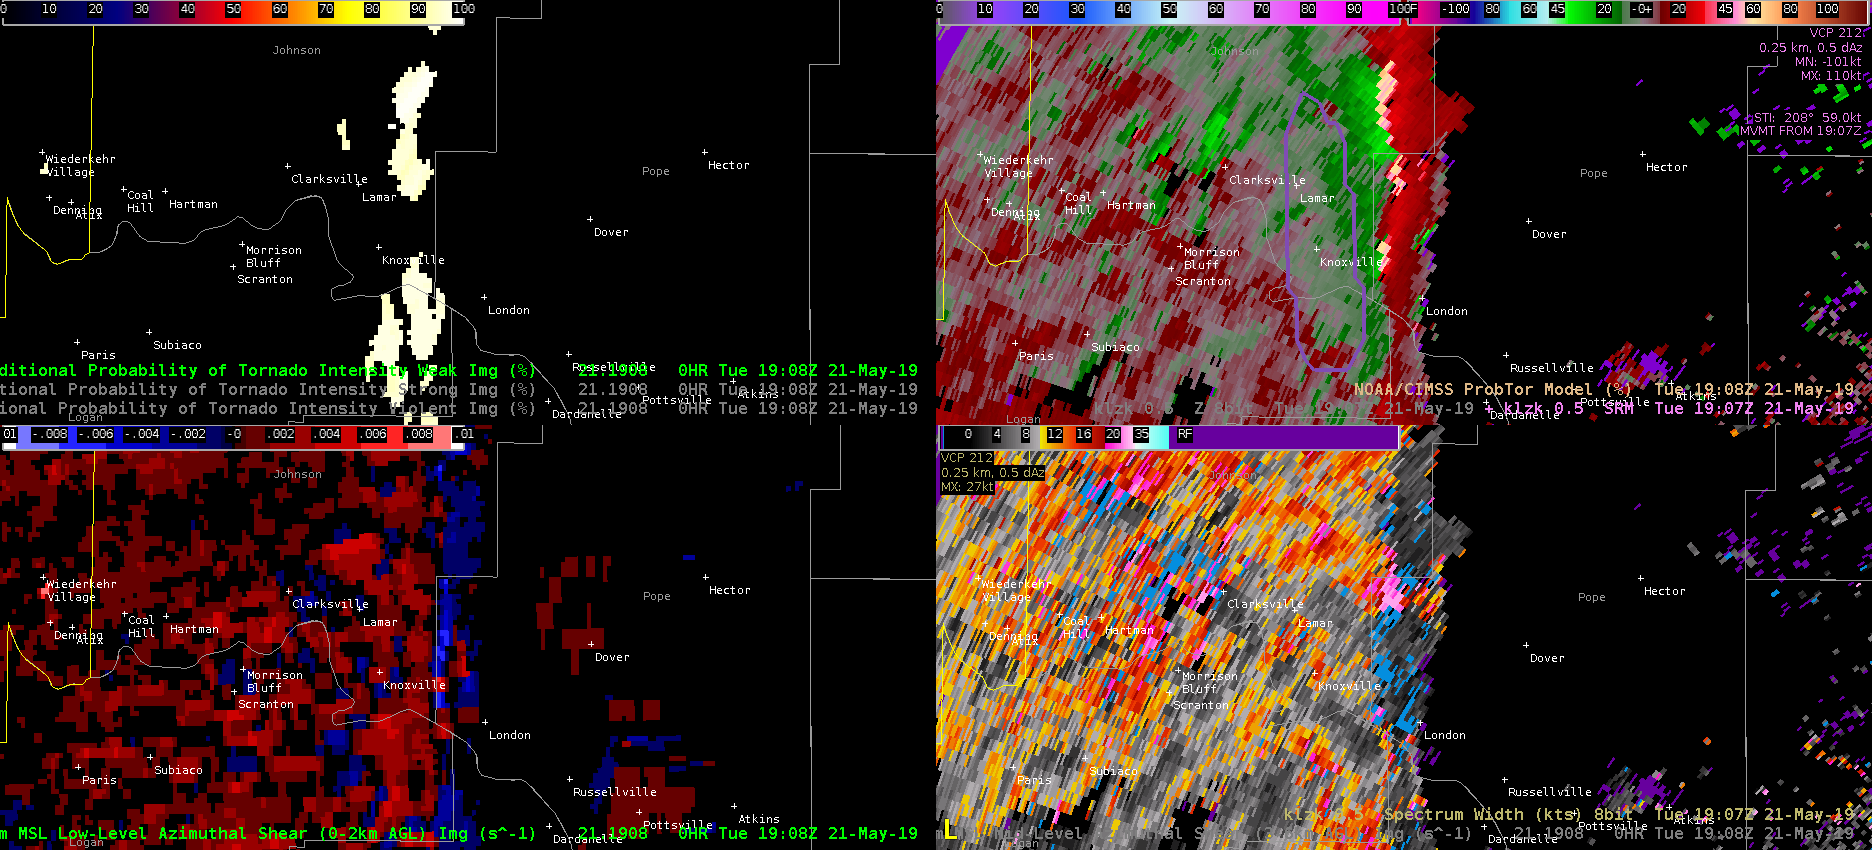
In this four-panel, the upper left has the 0-2 km merged AzShear, the upper right has the 3-6 km AzShear, the lower left has the Weak/Strong/Violent CPTI products overlayed on each other, and the lower right has the 0.5 degree base velocity.

At the beginning of the loop, the max 0-2 km AzShear values were .008 s^-1, but increased throughout the loop, eventually reaching  .012 s^-1, exceeding the .010 threshold. The 3-6 km AzShear showed a similar trend.

The CPTI product showed a noticeable trend as well. At the beginning of the loop the weak/strong/violent values were 89/11/0 %, respectively. Since most every value of AzShear starts with 100% weak, the values were not overly supportive. However, by the end of the loop, the values were 75/23/2 % respectively, a significant increase in the threat of both strong and violent tornadoes. With the limited experience I have using the product, once the strong gets to 20% or higher, and the violent gets to 2% or higher, it greatly increases the confidence in needing a tornado warning.

Thorcaster

Single Radar AzShear compared to Merged AzShear

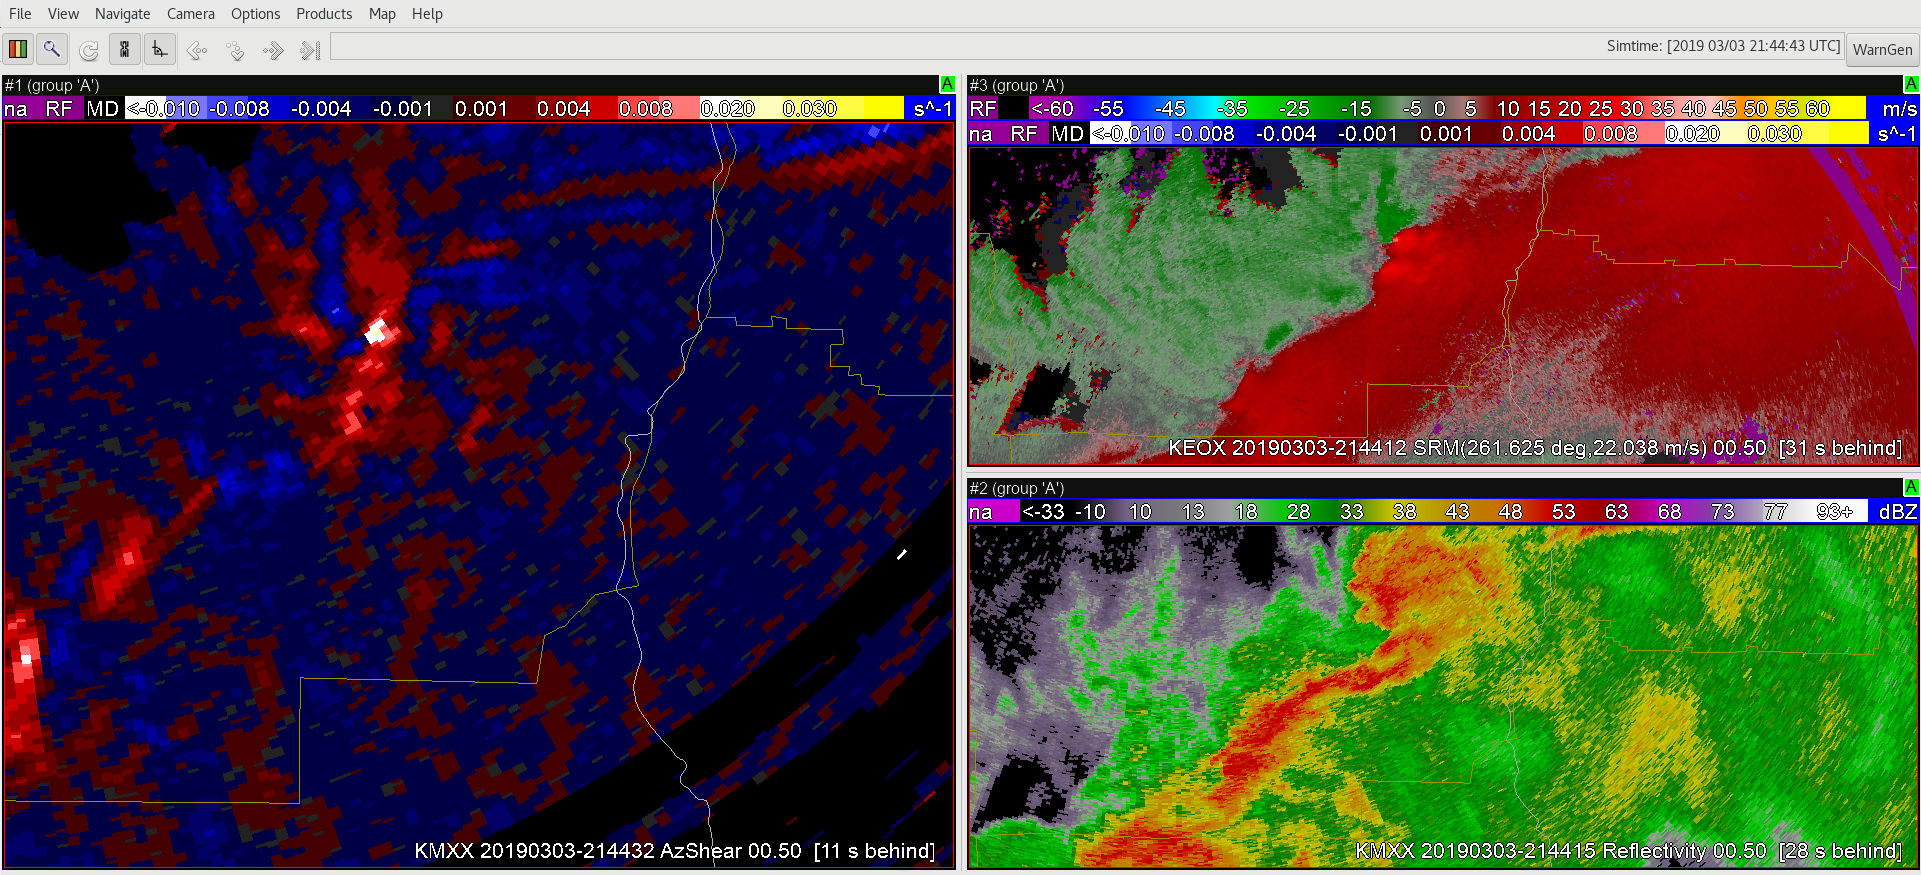
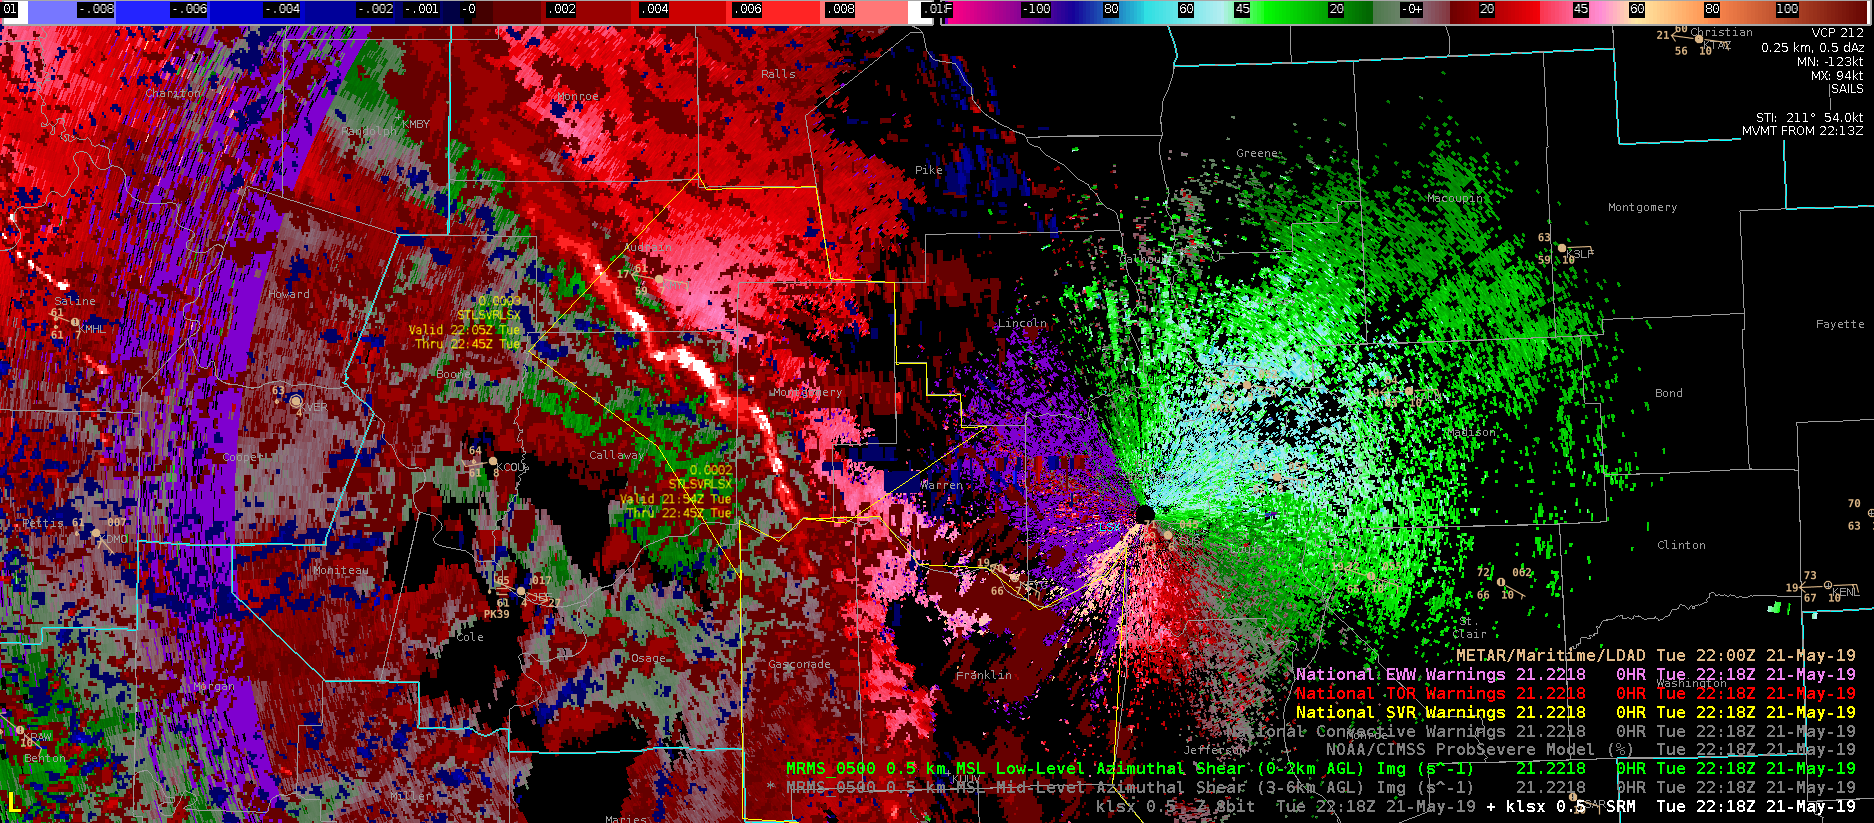
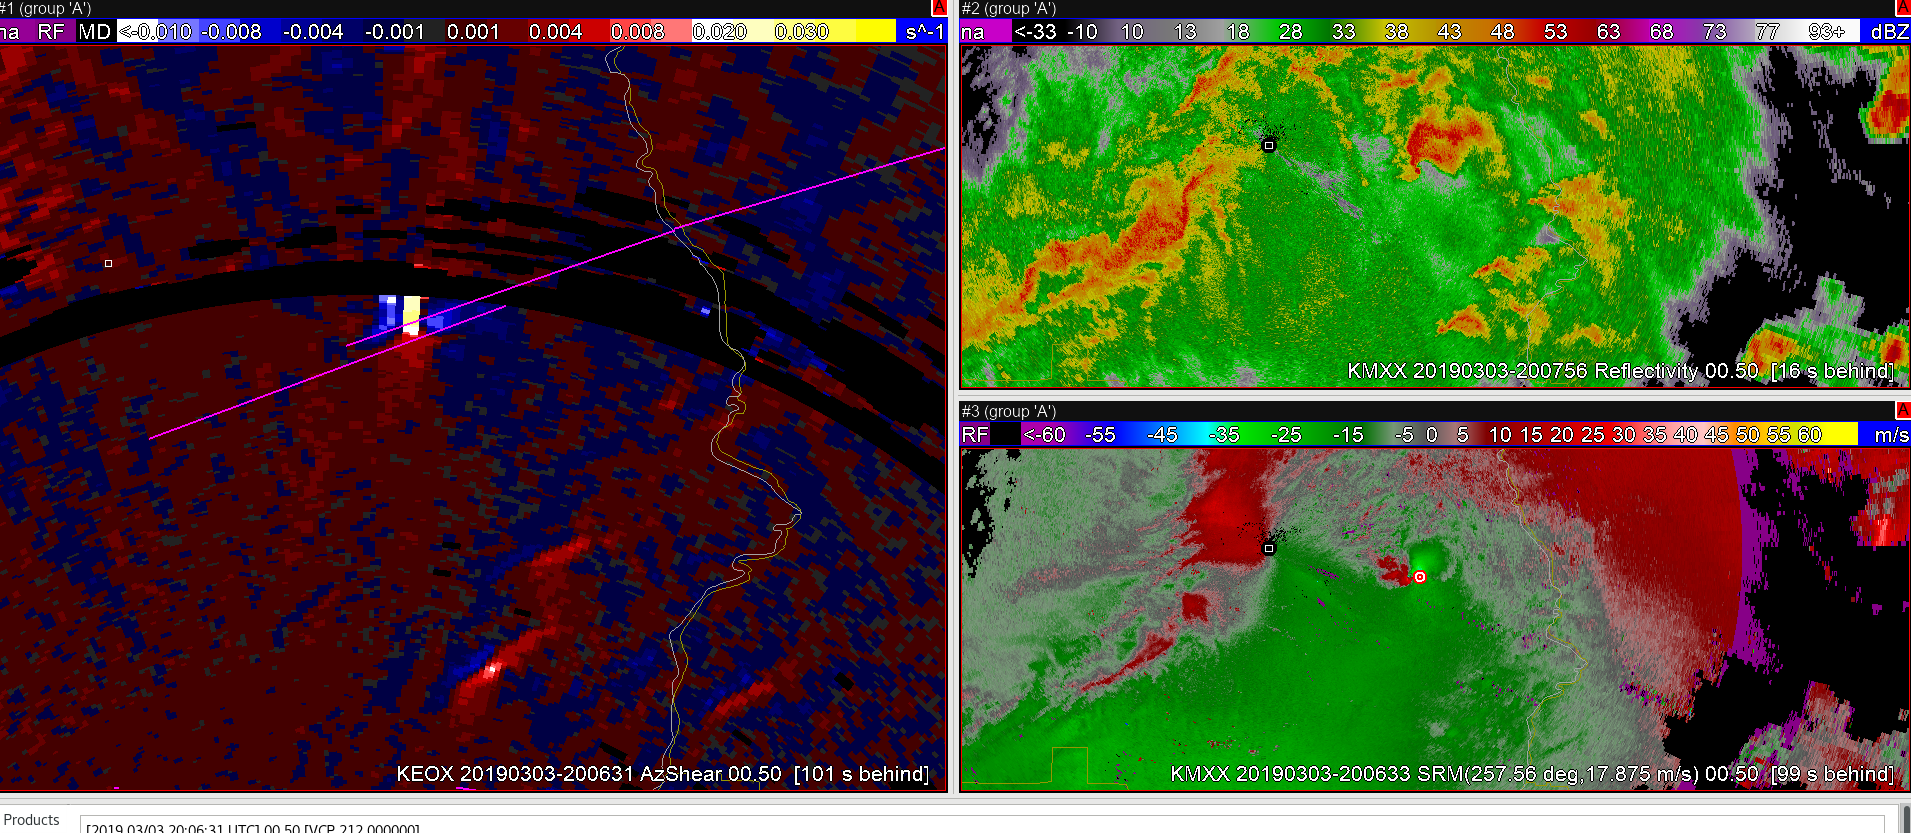
The Fort Rucker, AL (KEOX) radar, well south of the storm of interest, shows strong azimuthal shear values up to 0.028 S-1.  The maximum values are slightly offset to the north of the surveyed tornado track (pink line) likely due to distance from the radar.  A mature hook echo is apparent in the reflectivity with a corresponding tight couplet in the 0.5 degree SRM.

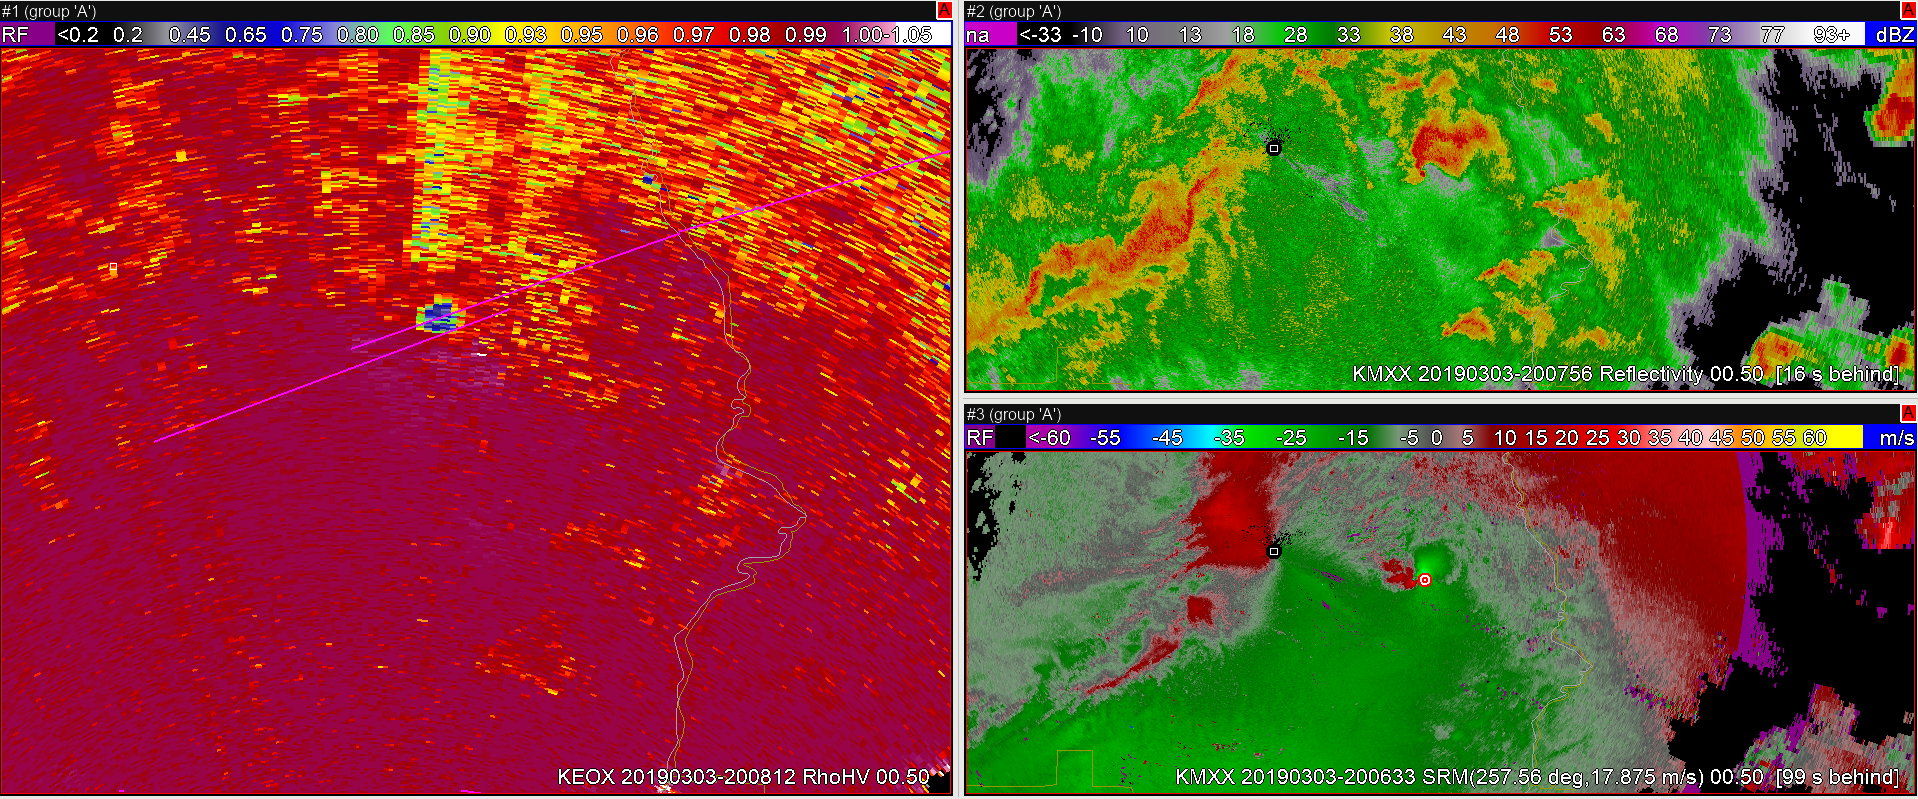
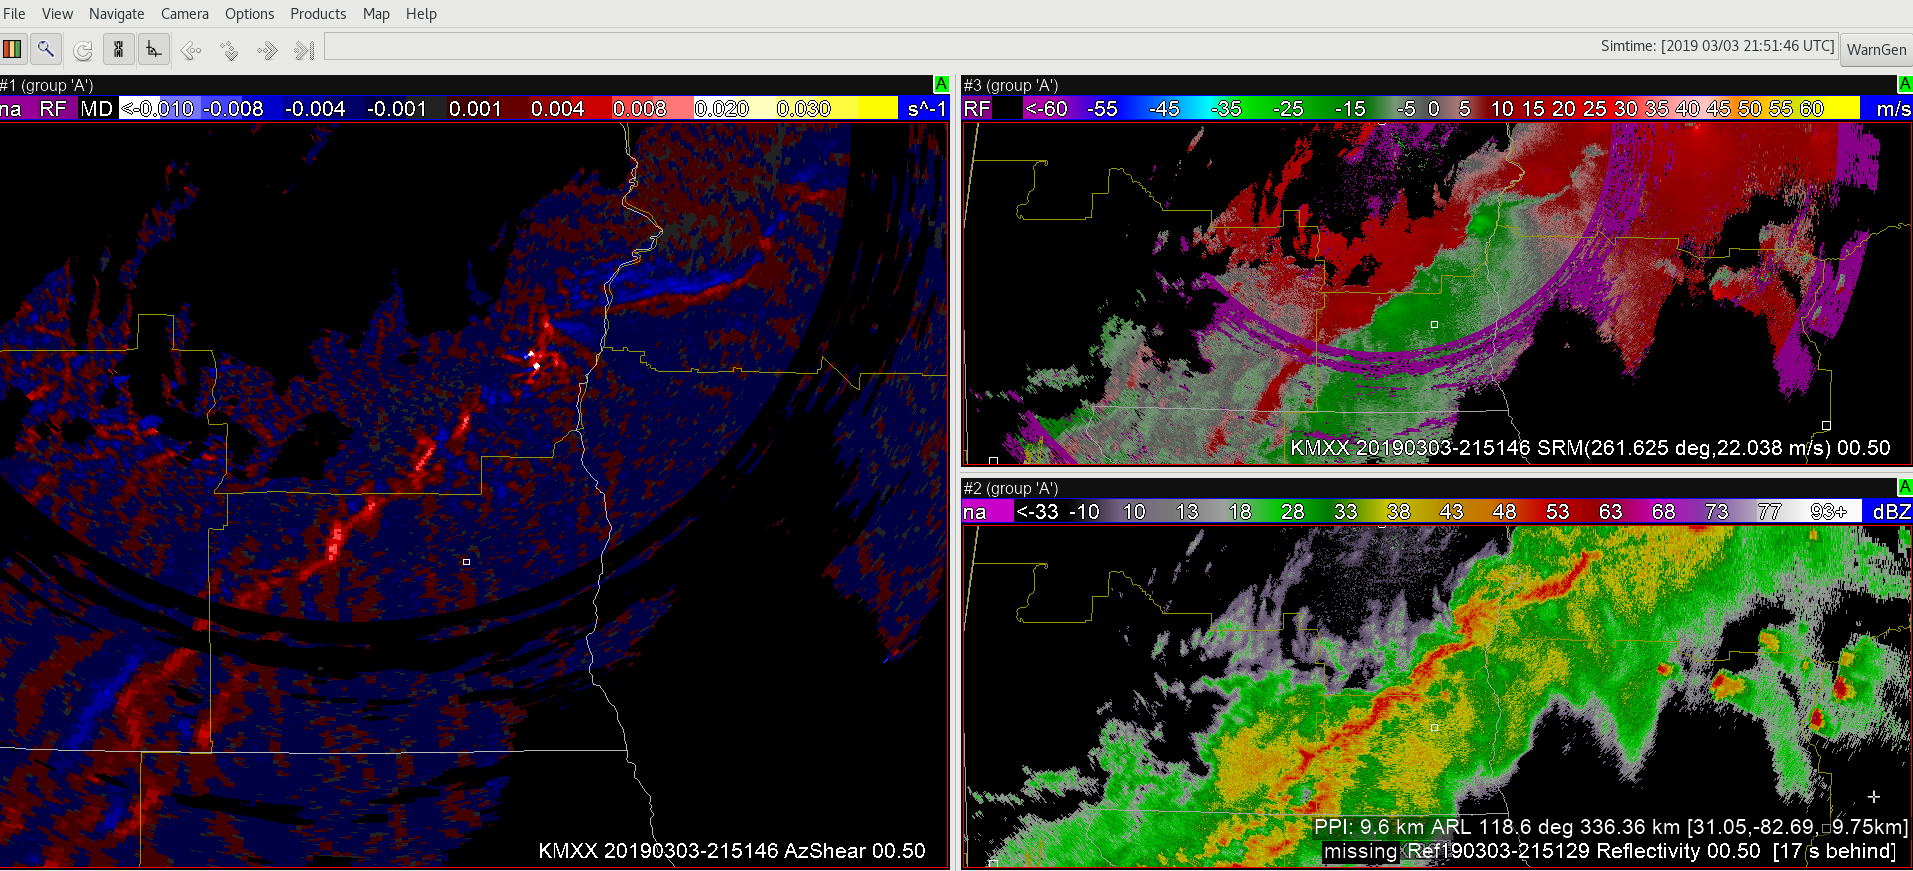
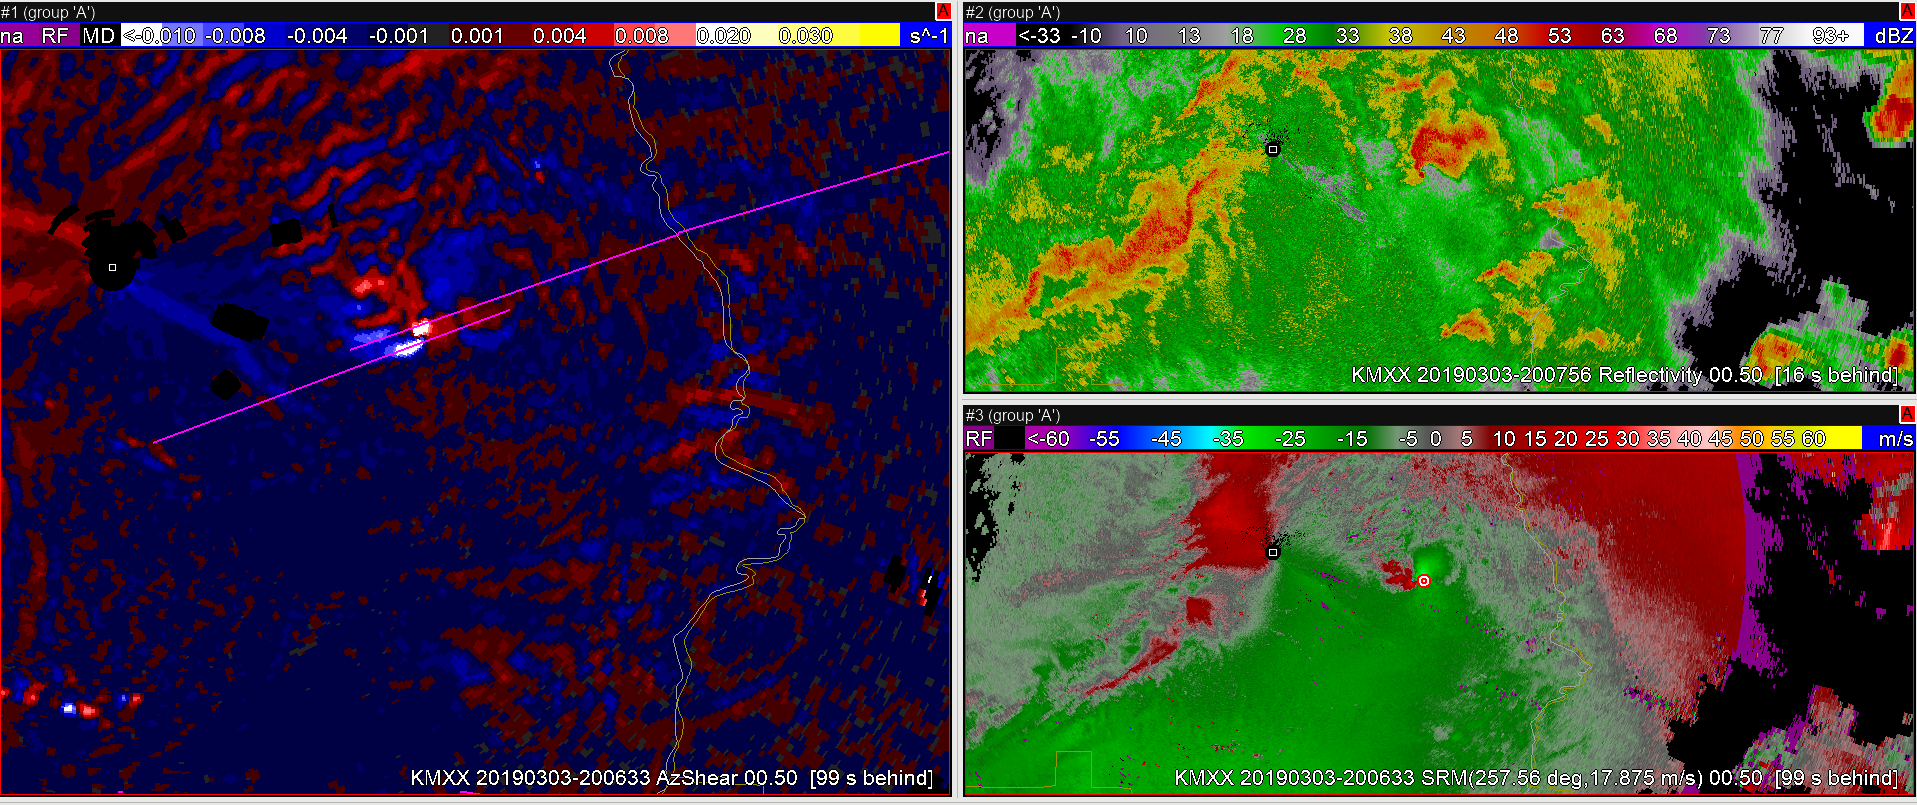
The Maxwell, AL (KMXX) radar, located closer and to the west the tornadic supercell, was also detecting strong azimuthal shear up to 0.021 S-1.  An area of negative shear was located immediately to the south of the SRM couplet, along a weaker anticyclonic inbound-outbound interface.  This corridor of blue shades to bright white was a bit distracting from the more important red to white positive shear associated with the cyclonic rotation. The maximum positive shear values were located exactly on the track of the surveyed tornado.  Reflectivity and SRM KMXX data were similar to KEOX.

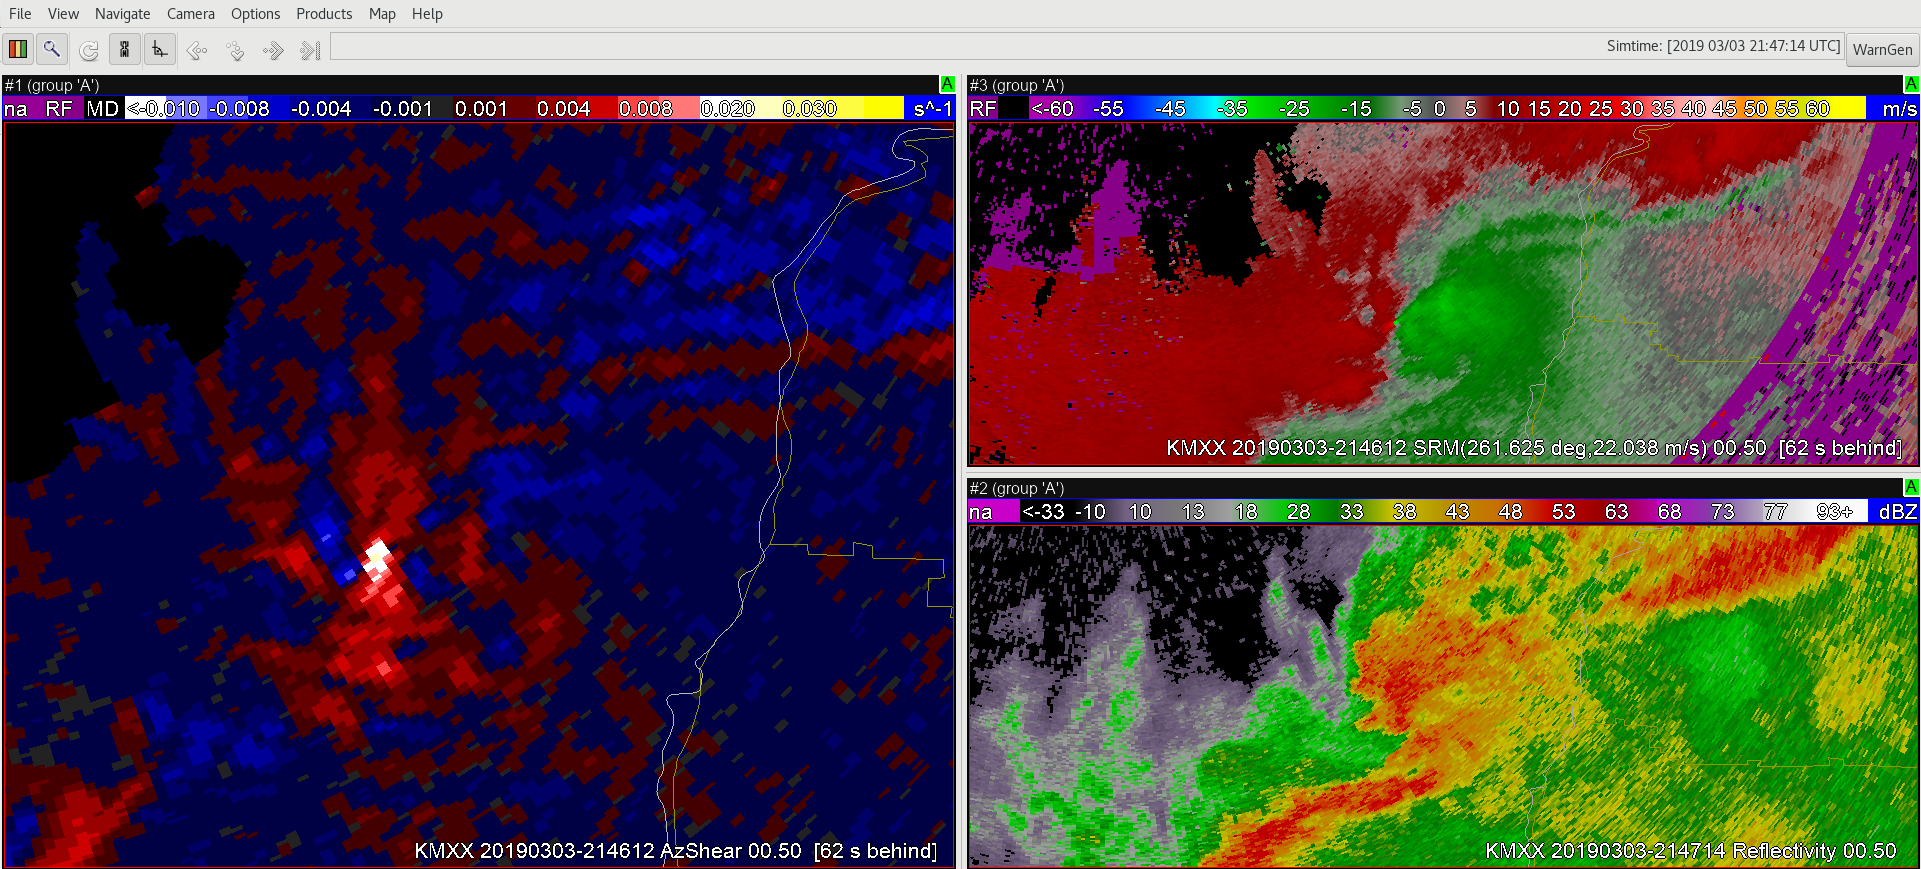
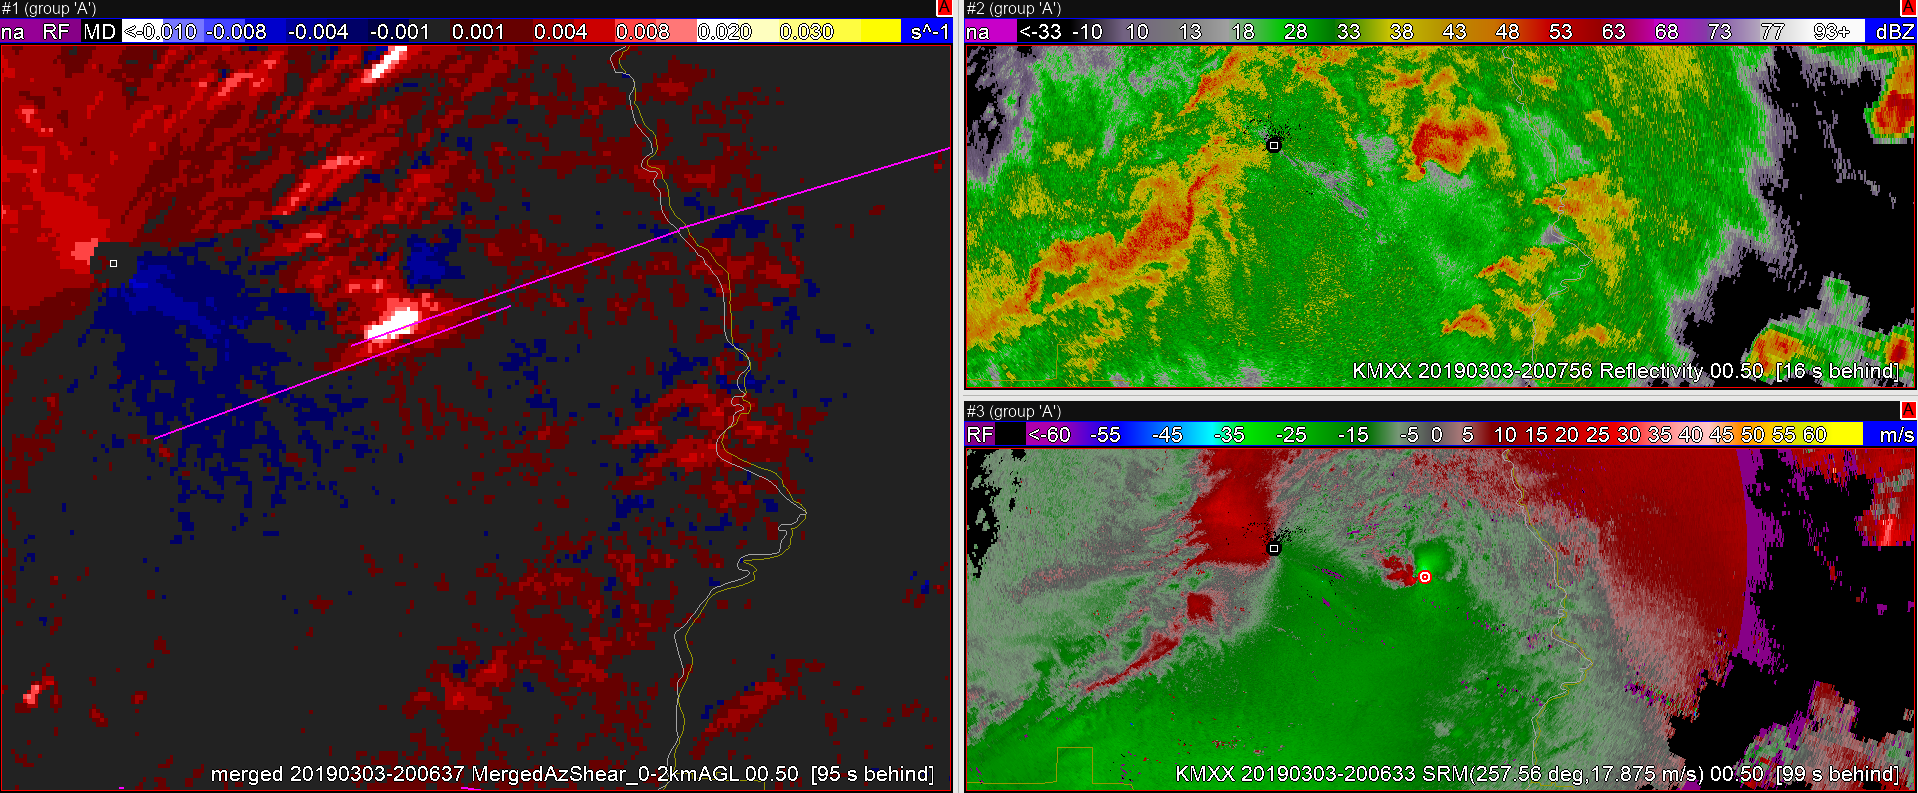
Merged 0-2 km azimuthal shear provided an accurate location of the meso/tornado and washed out the negative shear signal from the KMXX data. The shear values are lower than the single radar data.  
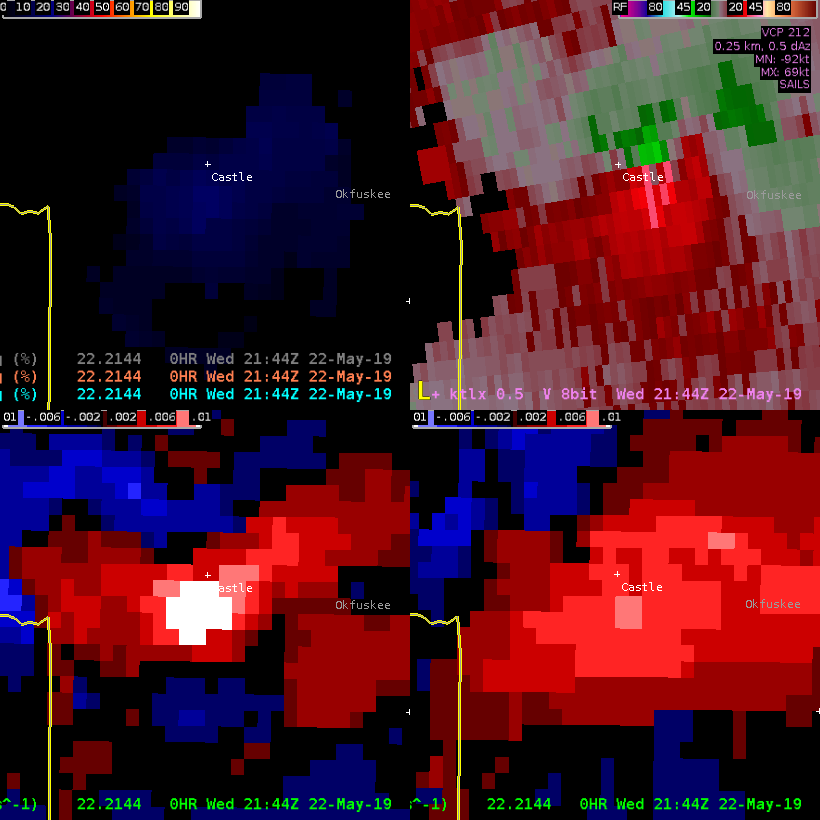
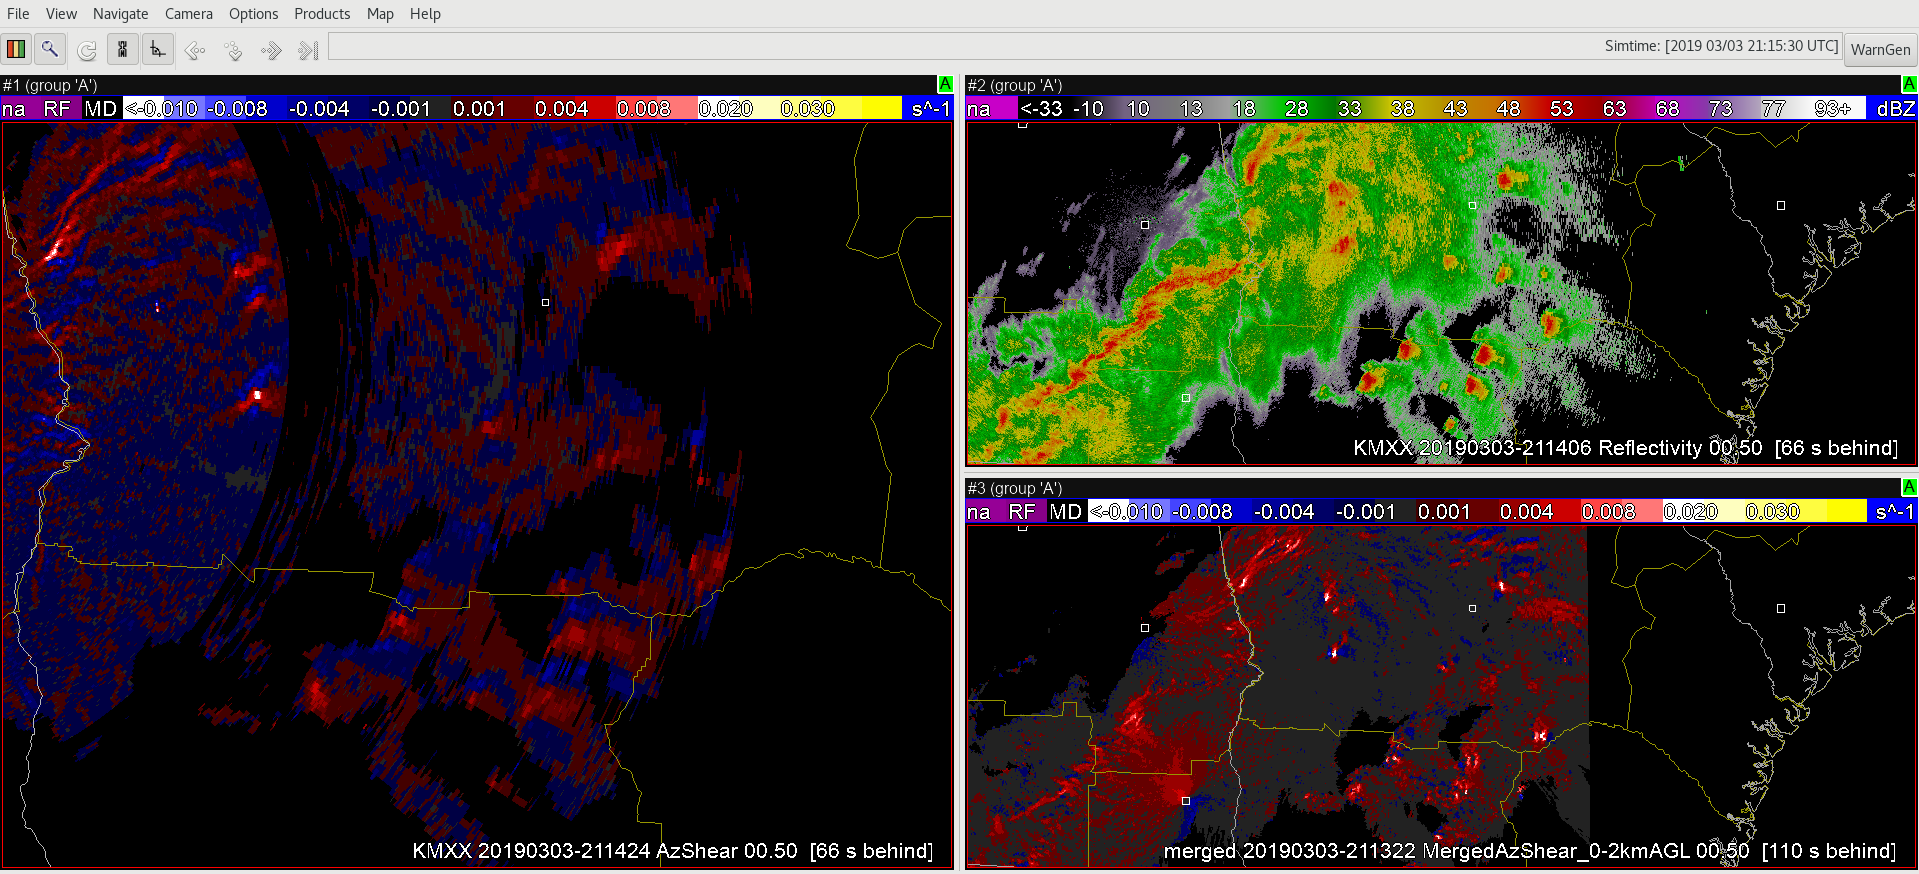
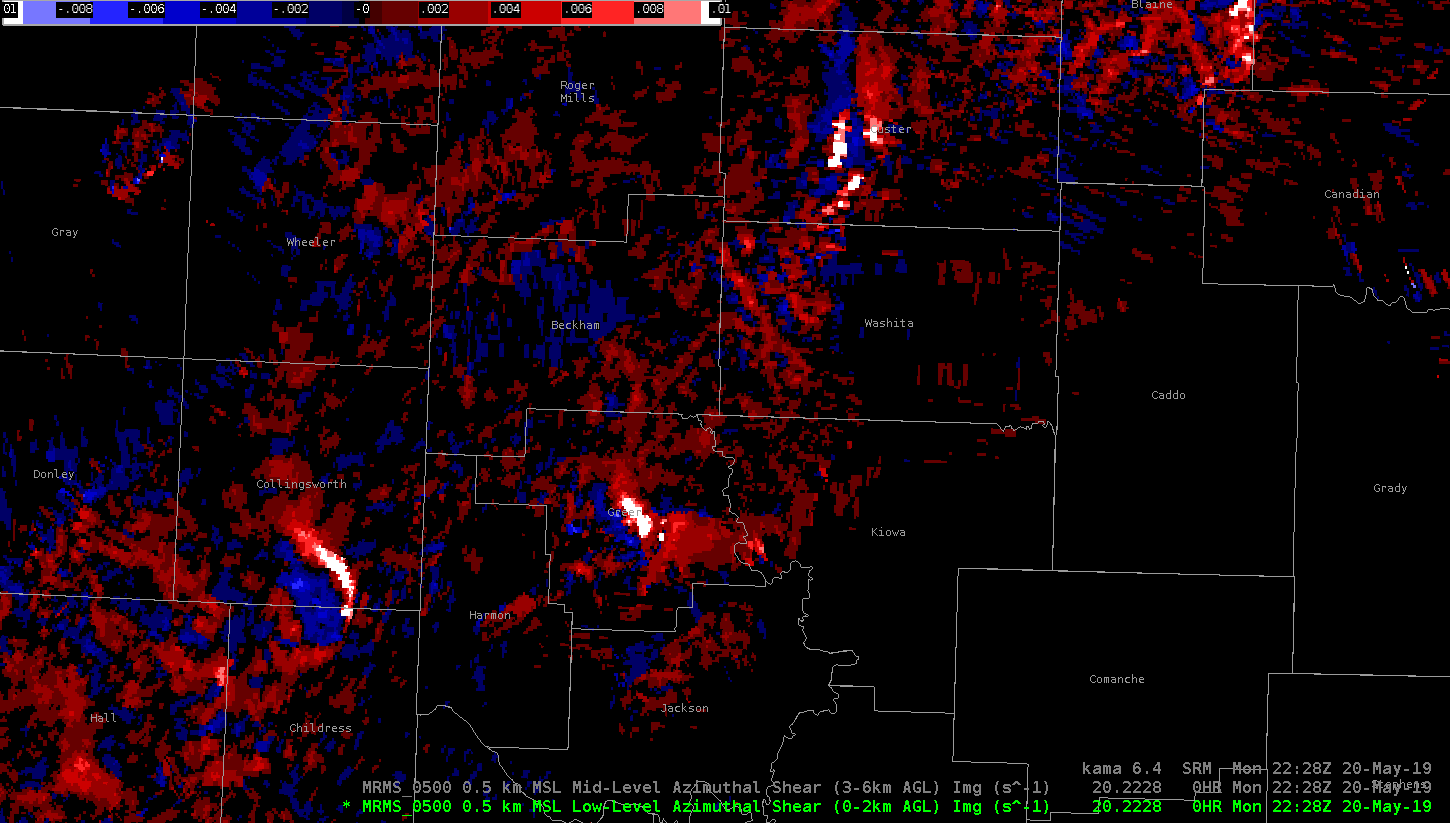
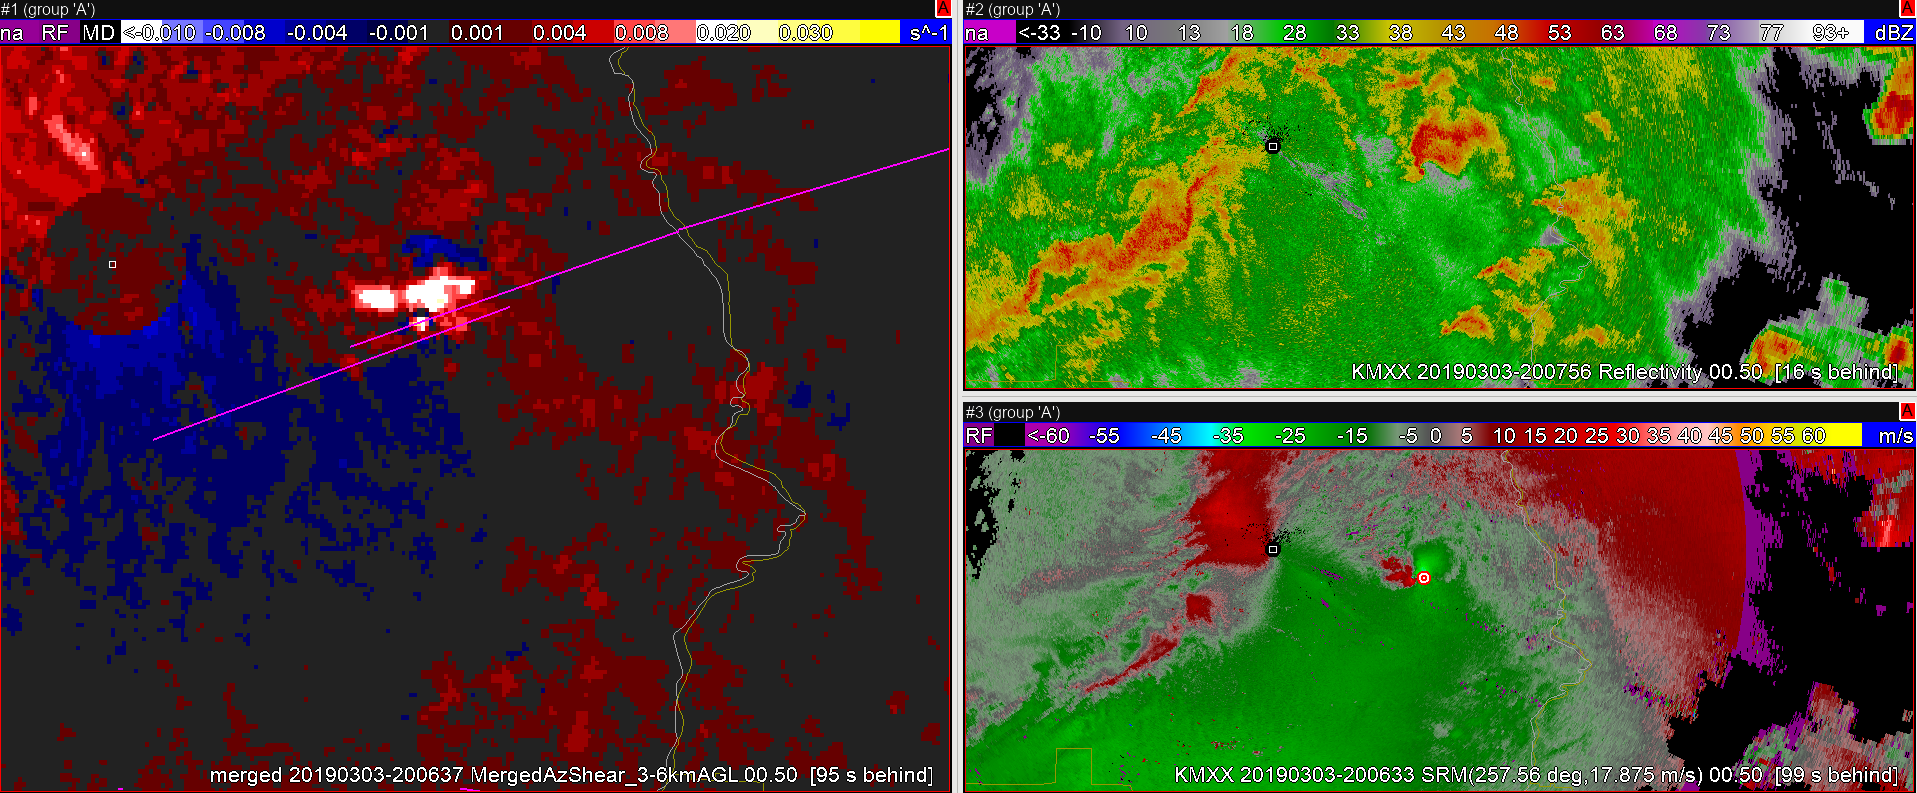
Merged 3-6 km azimuthal shear is displaced to the north of the tornado path (pink line).

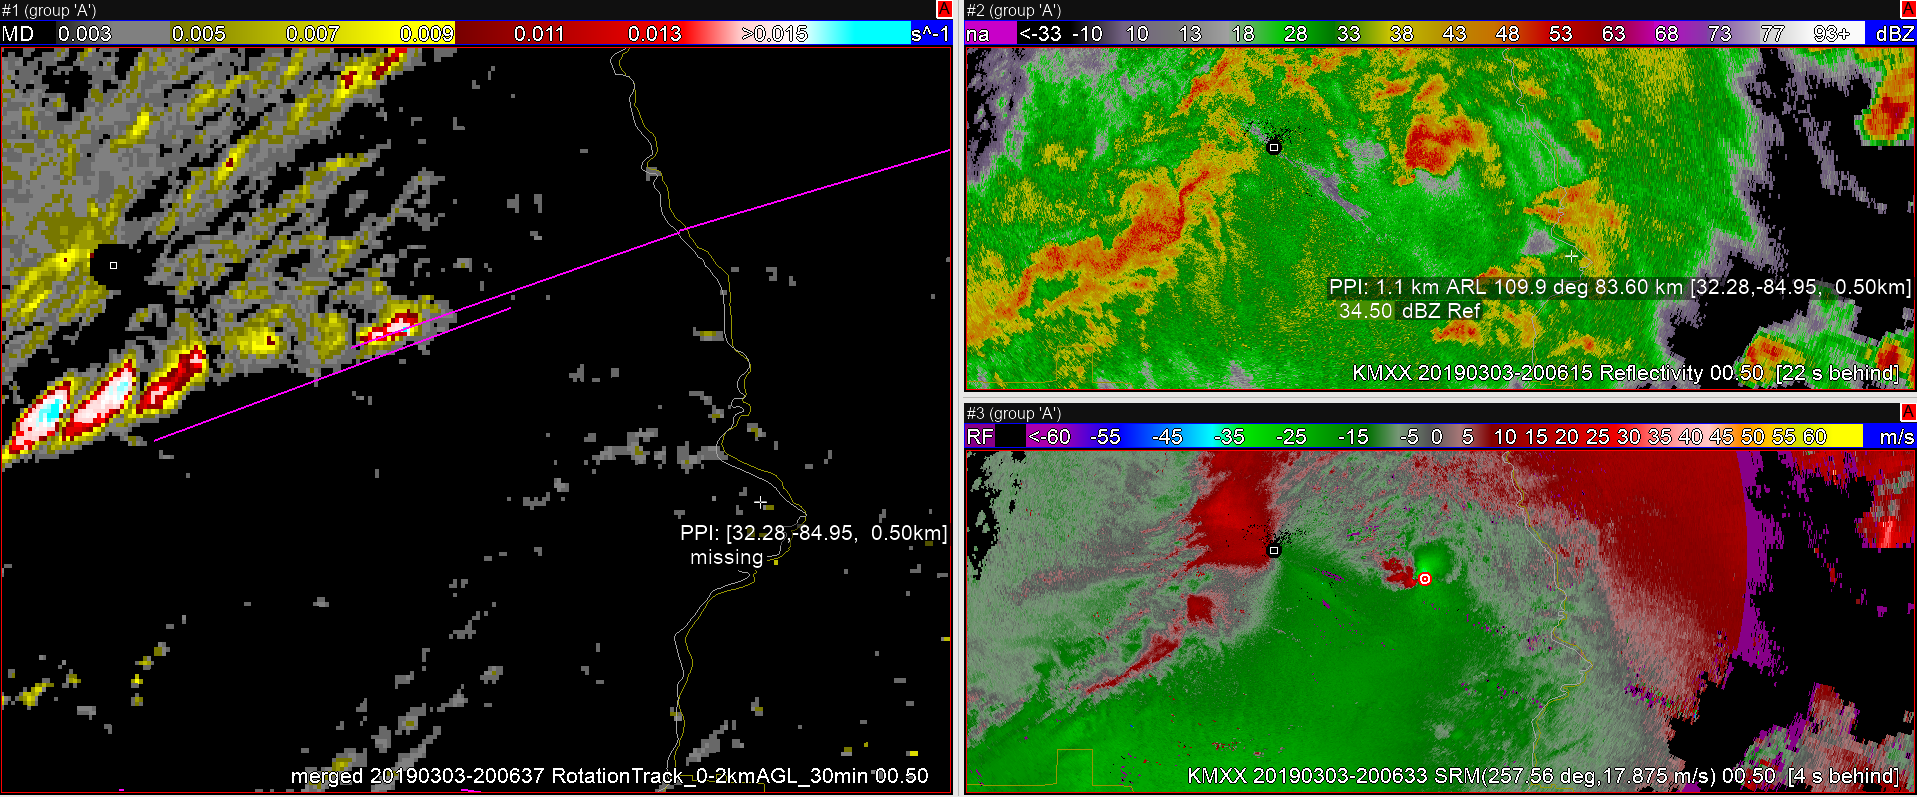
The merged 0-2 km rotation track has a very nice color scale (yellow to red to cyan) — key features really stand out.

CC plume or TDS were present on both radars. – Roy


AzShear picks up circulation along QLCS

The AzShear product did a nice job of highlighting and pinpointing a developing circulation along the convective line, as shown in the 2 images below from and 2144z and 2146z from kmxx. Zooming out, it’s a great indicator of where to focus on the line for a potential spin-up (bottom image from 2150z)

-64BoggsLites

More Observations of AzShear

It seems to me the merged product, particularly the 0-2km, highlights nearly every updraft whereas the AzShear seems to do a good job discriminating, and highlights the cell most likely to have strong rotation. In this case the couplet shows up in the western side of the AzShear display and is associated with an embedded rotating updraft, while the AzShear does not highlight the cells further southeast which show weaker rotation. However, the merged product (bottom right) shows bullseyes on all these cells which would make it difficult to triage which storms need attention.

-64BoggsLites

Comparing TDS Height and CPTI

An embedded supercell produced a significant tornado just west of the KLSX radar near St. Louis around 6pm CDT. The tornado produced a tornado debris signature and impressive debris ball (>65 dBZ) at its peak intensity.

The tornado debris signature reached a height of ~10kft at the 10 degree elevation scan, characteristic of an EF-2 tornado.

This case provides a great opportunity to investigate the performance of CPTI. The algorithm identified a maximum probability of strong tornadoes of 22% and a maximum low-level AzShear value of 0.030 /s. Based on the AzShear value, it seems the CPTI for strong tornadoes should have been stronger.

A little digging showed that the MRMS STP value was 0 near St. Louis, while the SPC Mesoanalysis page showed an STP of 4. This discrepancy explains the suppressed strong tornado CPTI and should be investigated. Perhaps there is a latency issue with the MRMS STP data.

I really like the CPTI product for clear-cut tornadoes and see it being very helpful for IBW updates for an ongoing tornado.

-Atlanta Braves

ProbTor Spikes to 72%, But is it Legit?

A semi-discrete cell tracked NNE of Little Rock, Arkansas. This storm developed a very tight reflectivity gradient on its southeast flank.  A few other notable features were an inflow notch and hook-like appendage.  Mitigating the severe potential with this storm was an outflow boundary displaced to the east of the updraft and low cloud flash counts (ground based) or cloud extent flash density (GLM).

The 0-2 km azimuthal shear generated what seemed to be a spurious bullseyes south of Searcy, Arkansas with values over 0.020 S-1. This data was input into the ProbTor algorithm, causing the spike to 72%.  The 0-2 km azimuthal shear derived with the new dealiasing technique never plotted values over 0.008 S-1. In fact, the bullseyes which were located slightly to the NW of the primary rotation track, never showed up in the new azimuthal shear product. -Roy


AzShear Depicting Highest Tornado Threat

The 0-2km AzShear product is depicting the highest tornado threat along the convective line. There is a maxed-out area of 0-2km AzShear along this line.

This makes sense given extreme low-level shear values in this area with easterly winds at the surface lengthening the hodograph. According to the RAP, 0-1km SRH values are in excess of 400 m here.

Ron Dayne

ProbTor during Tornado Warning

The NWS office in Little Rock started issuing tornado warnings on storms along the line so I pulled up the ProbTor product to see how it performed. For the storm near Knoxville, I can’t figure out what’s going on but I’ll attempt to document it here. For each time, I plot CPTI top left, LZK SRM top right, low-level AzShear bottom left, and spectrum width bottom right.

At 1902, the algorithm has a 60% ProbTor based on high LLAzShear (0.021 /s). I don’t see any high values on the low-level AzShear product, but perhaps I’m missing something.

At 1904, a bullseye of high LLAzShear pops up just east of Knoxville. ProbTor is still 60%, which now makes sense to me. This identified shear region is not in the right place for a tornado and is just convergence along the line, but the ProbTor uses what it has and seems to generate an understandable ProbTor.

At 1906 the LLAzShear bullseye east of Knoxville persists,  but now the ProbTor drops to 19% with a LLAzShear max value of (0.009 /s). I still sample 0.020 /s in the bullseye. Spectrum width is not horrible (~7 kts) in the area of the AzShear bullseye. The AzShear detection is obviously misleading for a tornado, but the ProbTor product does not seem to be performing as we’d expect it.

At 1908 the bullseye in AzShear goes away and the ProbTor drops even further to 6% (as expected). The persistence of the bullseye in AzShear with an associated significant drop in ProbTor is perplexing for this case! -Atlanta Braves.


AzShear – Great Additional Tool for Tornado Warning Issuance

The best storm of the day so far produced a tornado with a tornado debris signature. The AzShear signature was textbook with a concentrated persistent bullseye over the couplet (center of image below):

This AzShear product is a great tool to increase confidence in the presence of low-level rotation. It should be used with caution, however, owing to the risk of misleading signatures. The signal north of the Greer storm is a result of convergence and/or bad velocity data: 
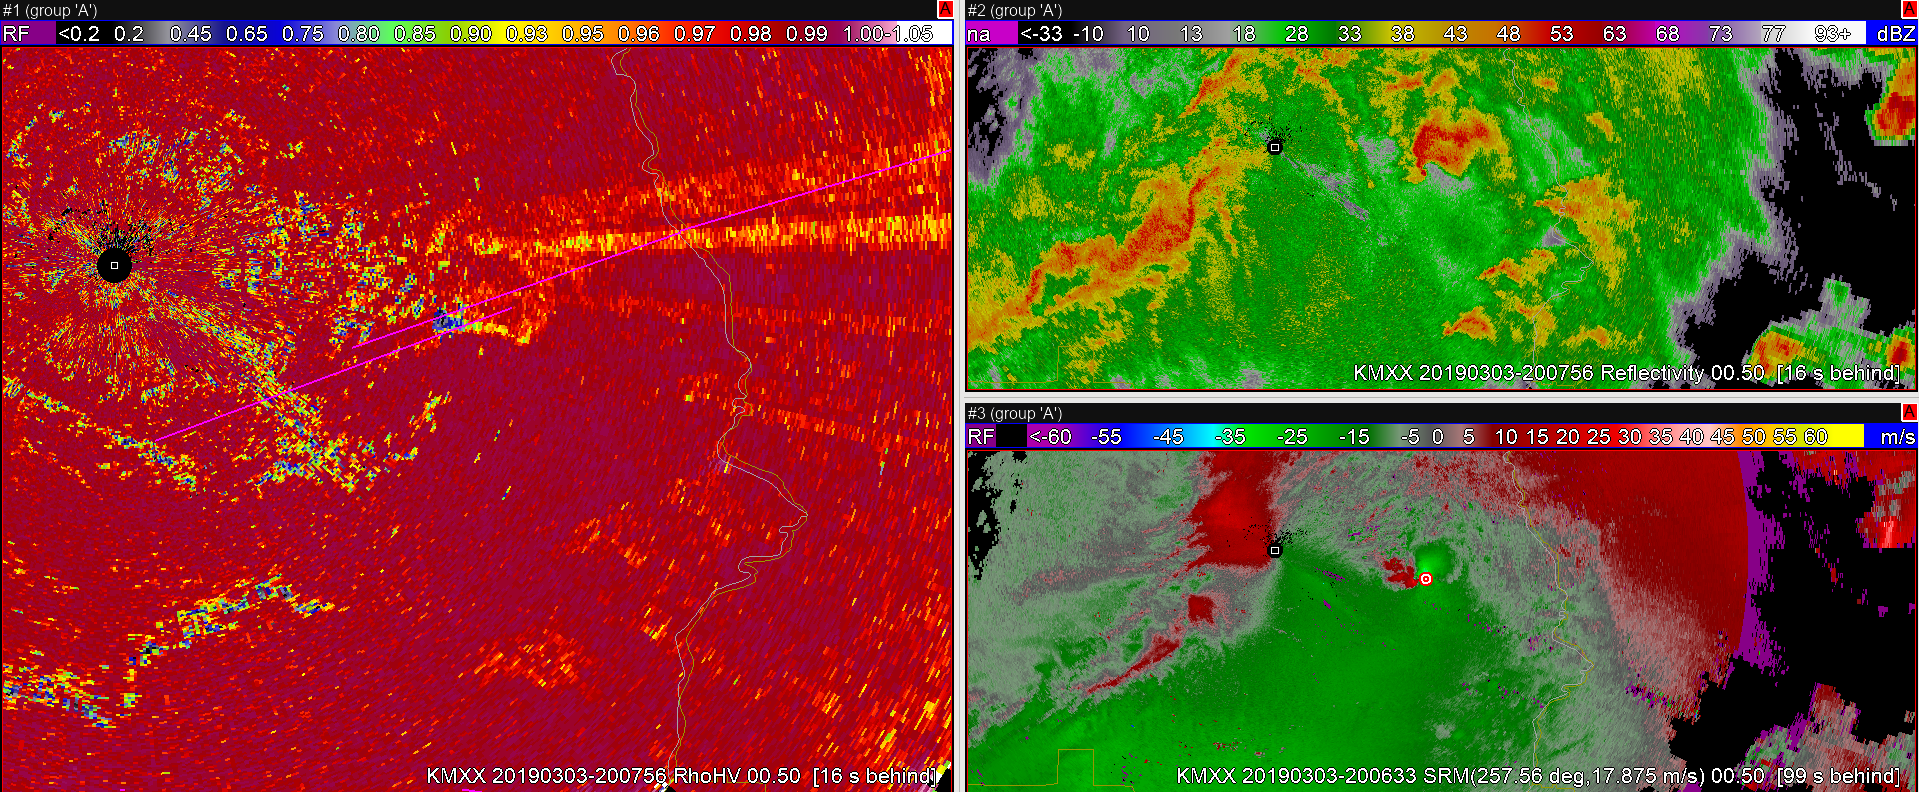
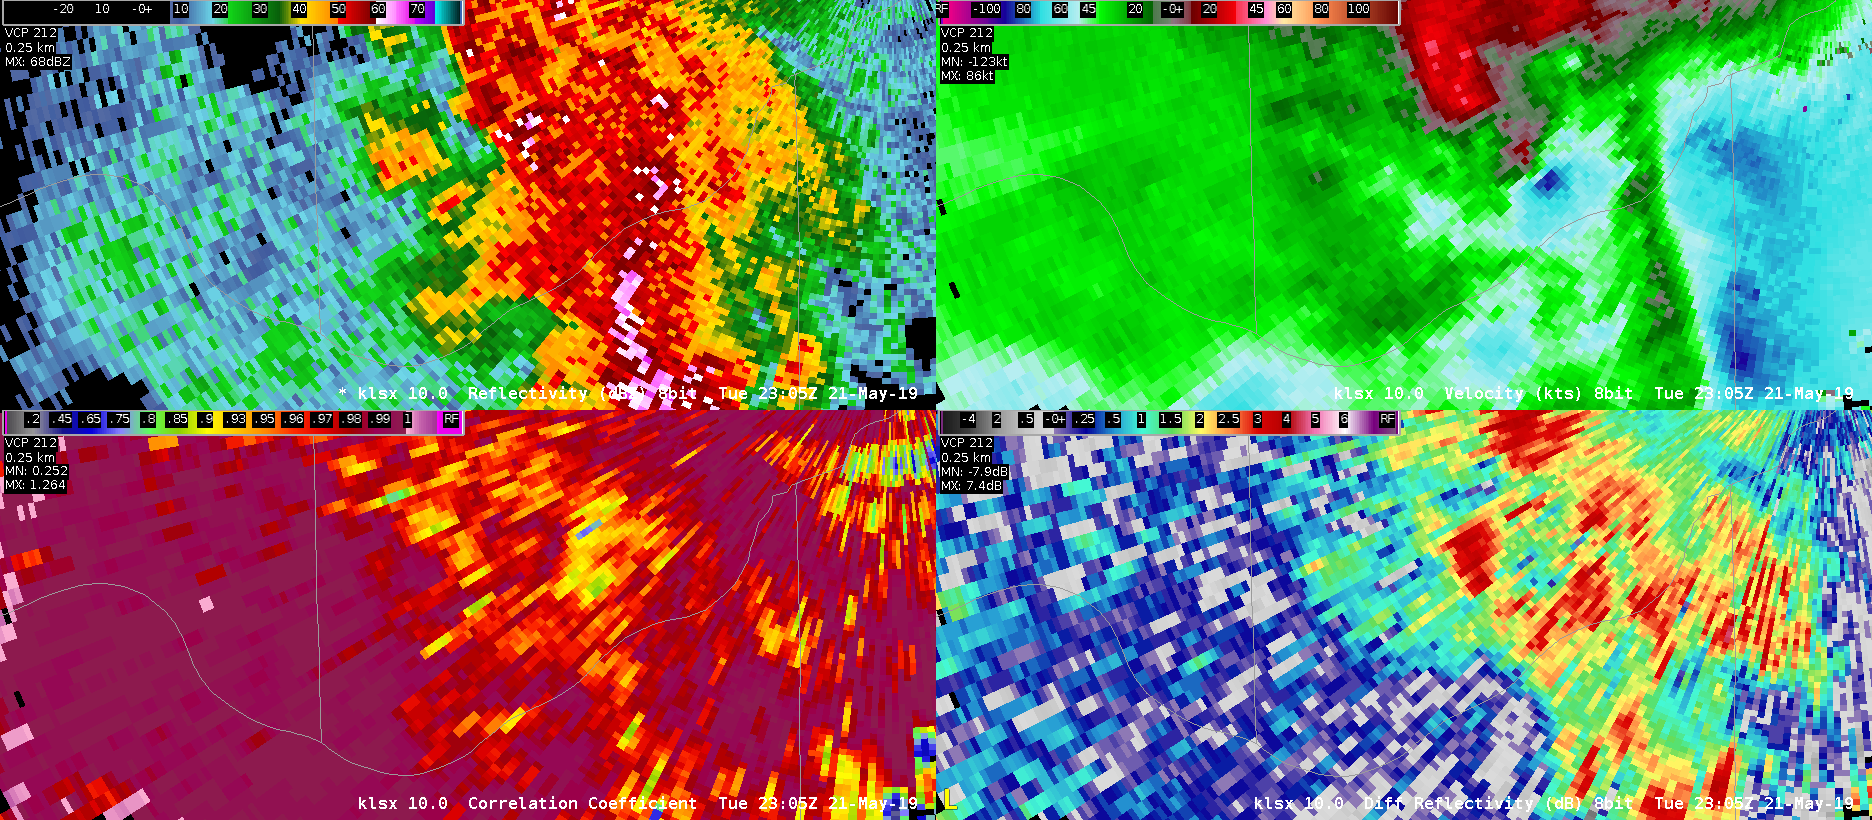
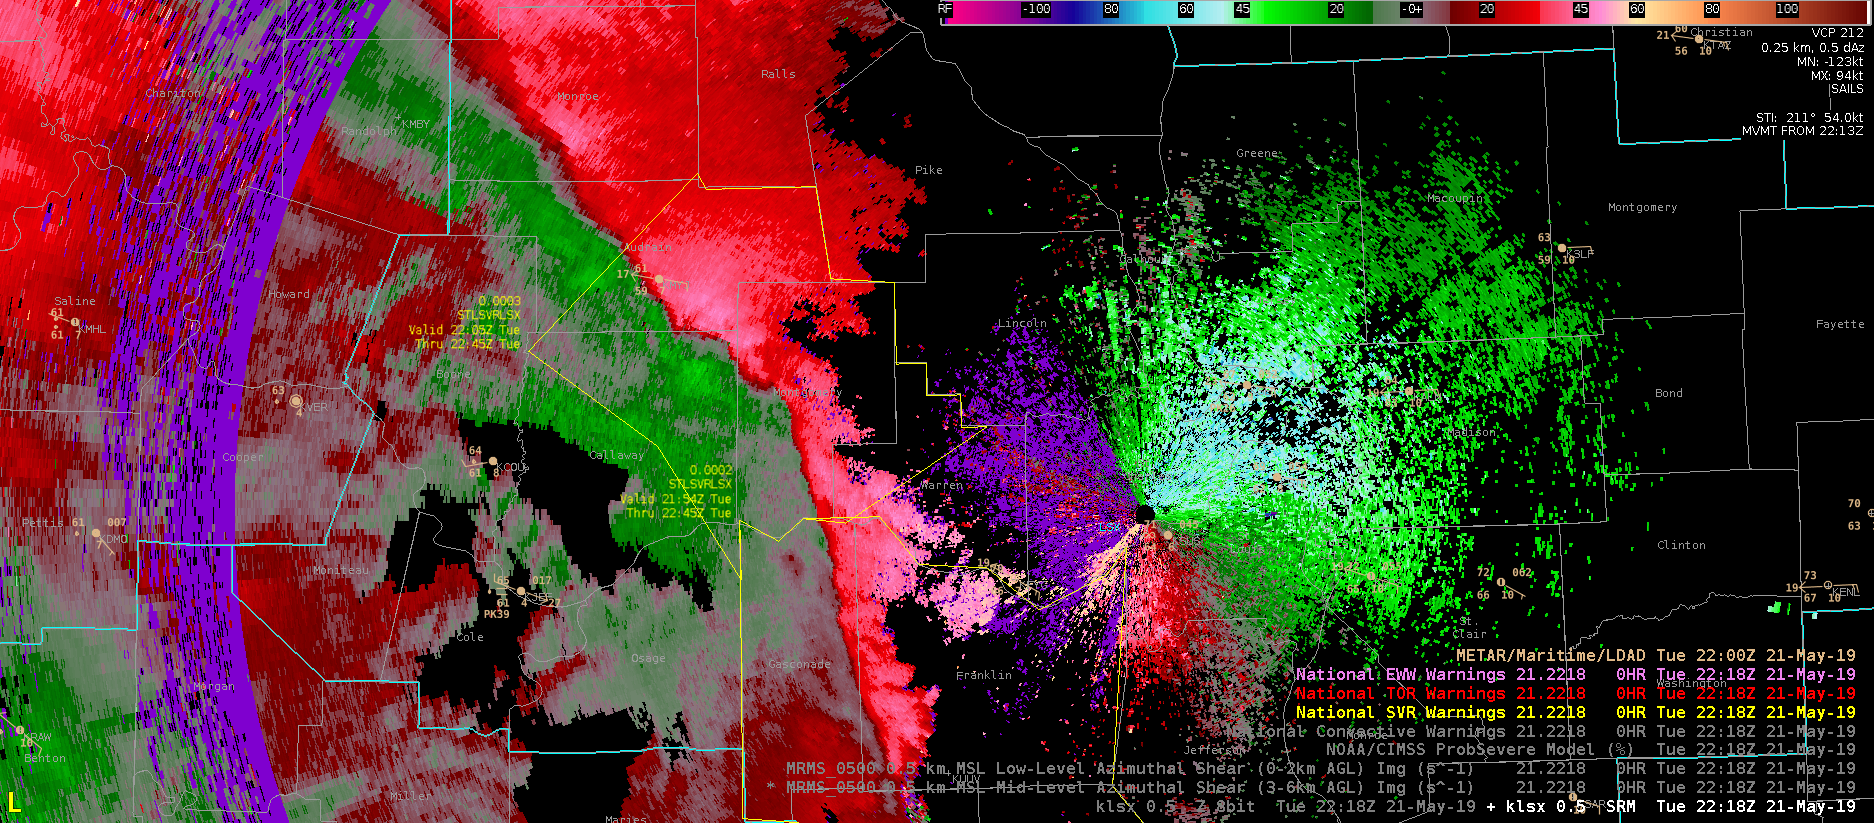
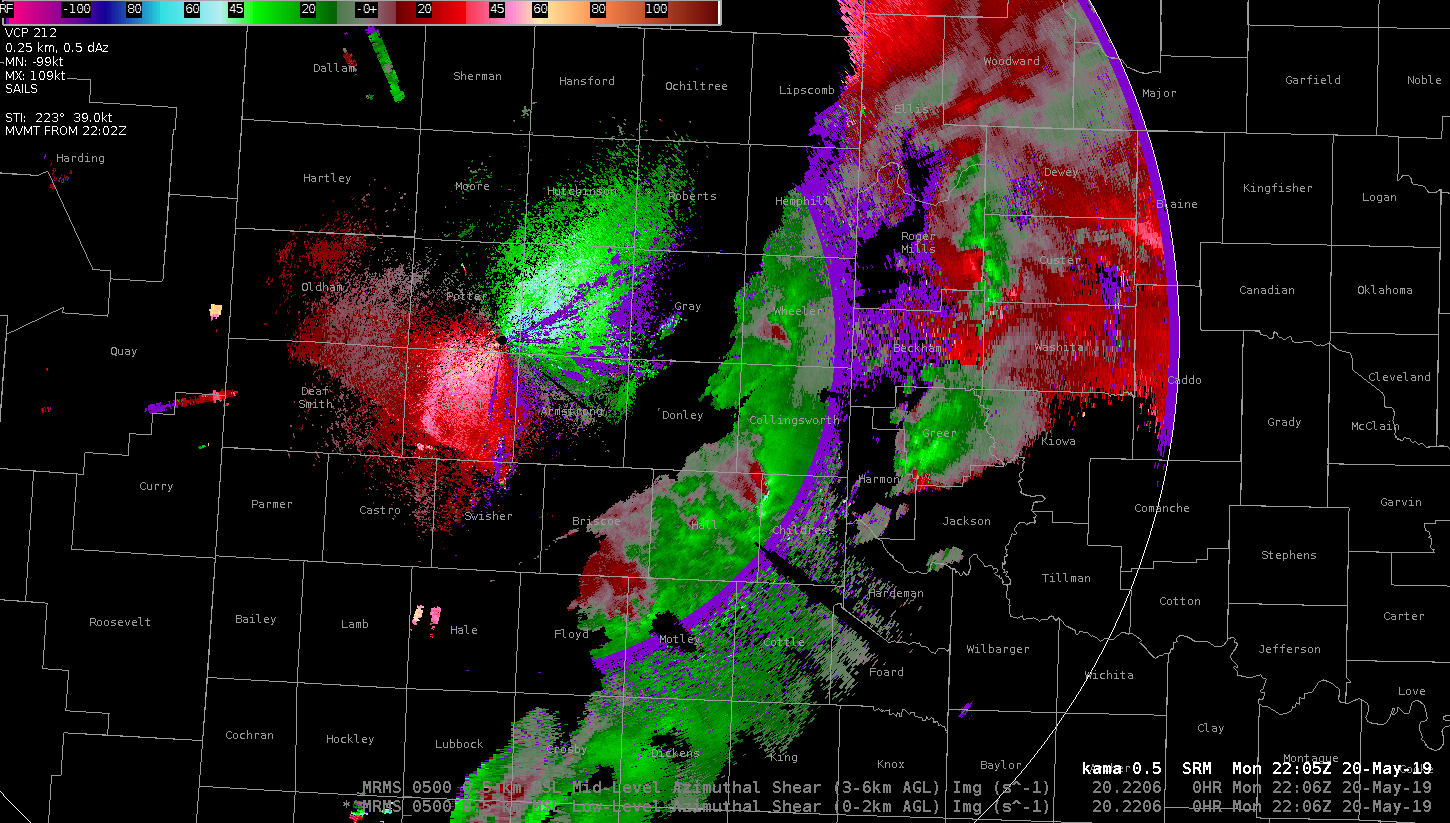
The reflectivity structure is more of a bow echo and the AzShear should be used with caution in identifying velocity couplets potentially associated with tornadoes. -Atlanta Braves