CPTI Increasing in Concert with an Observed Tornado

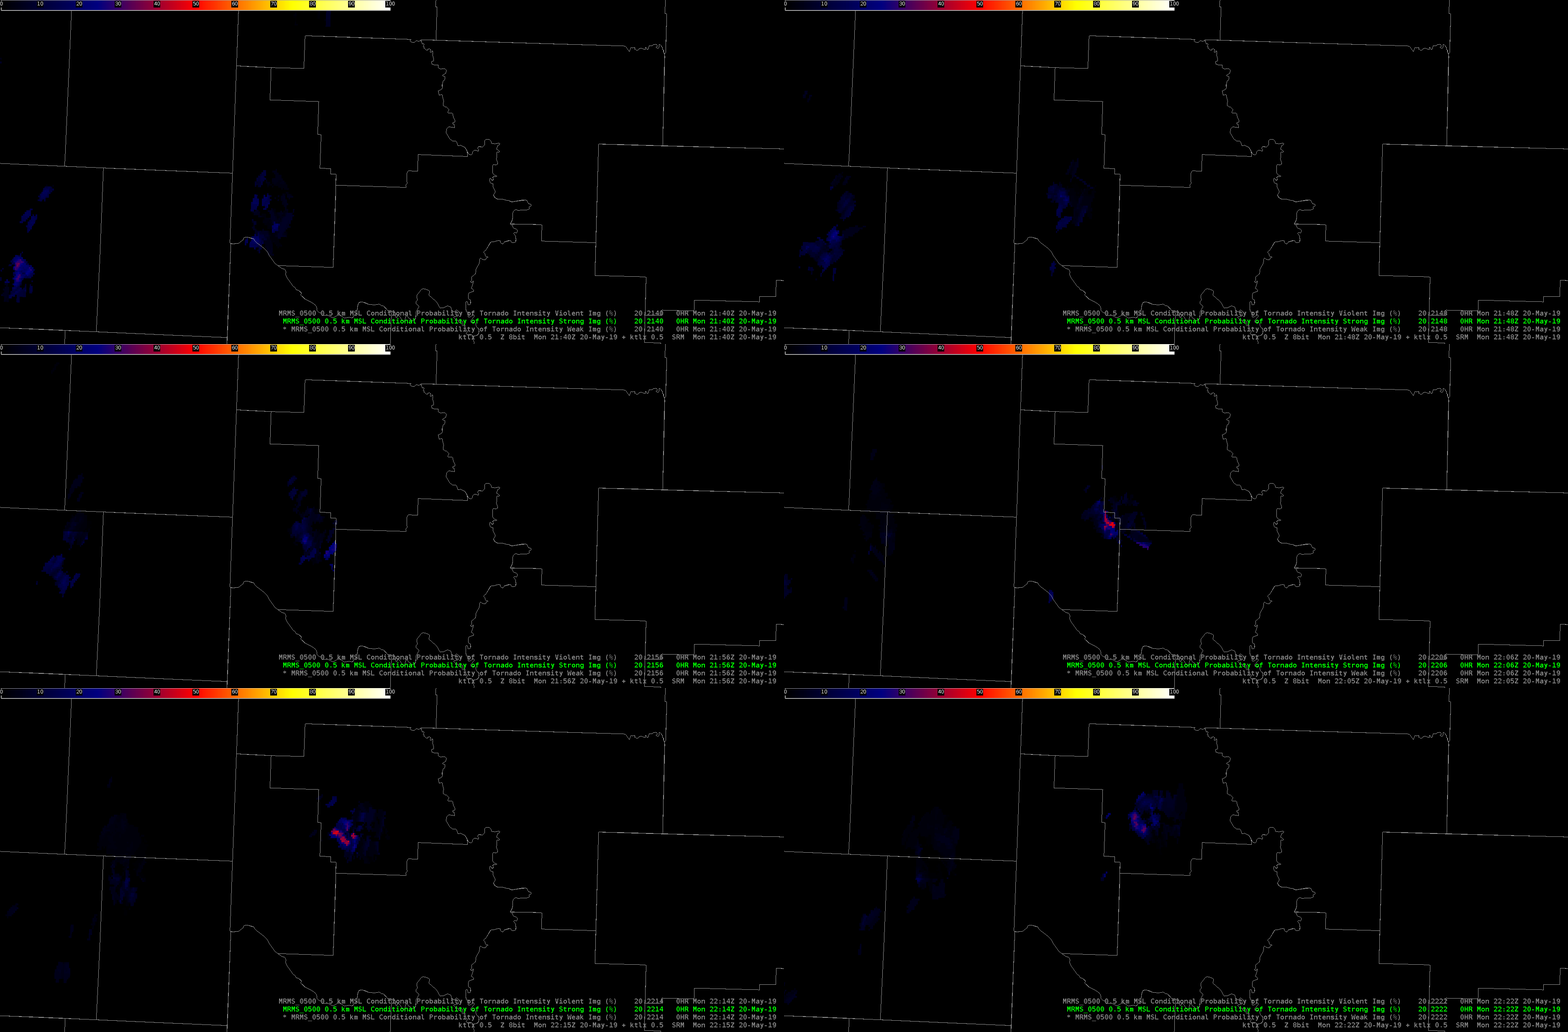
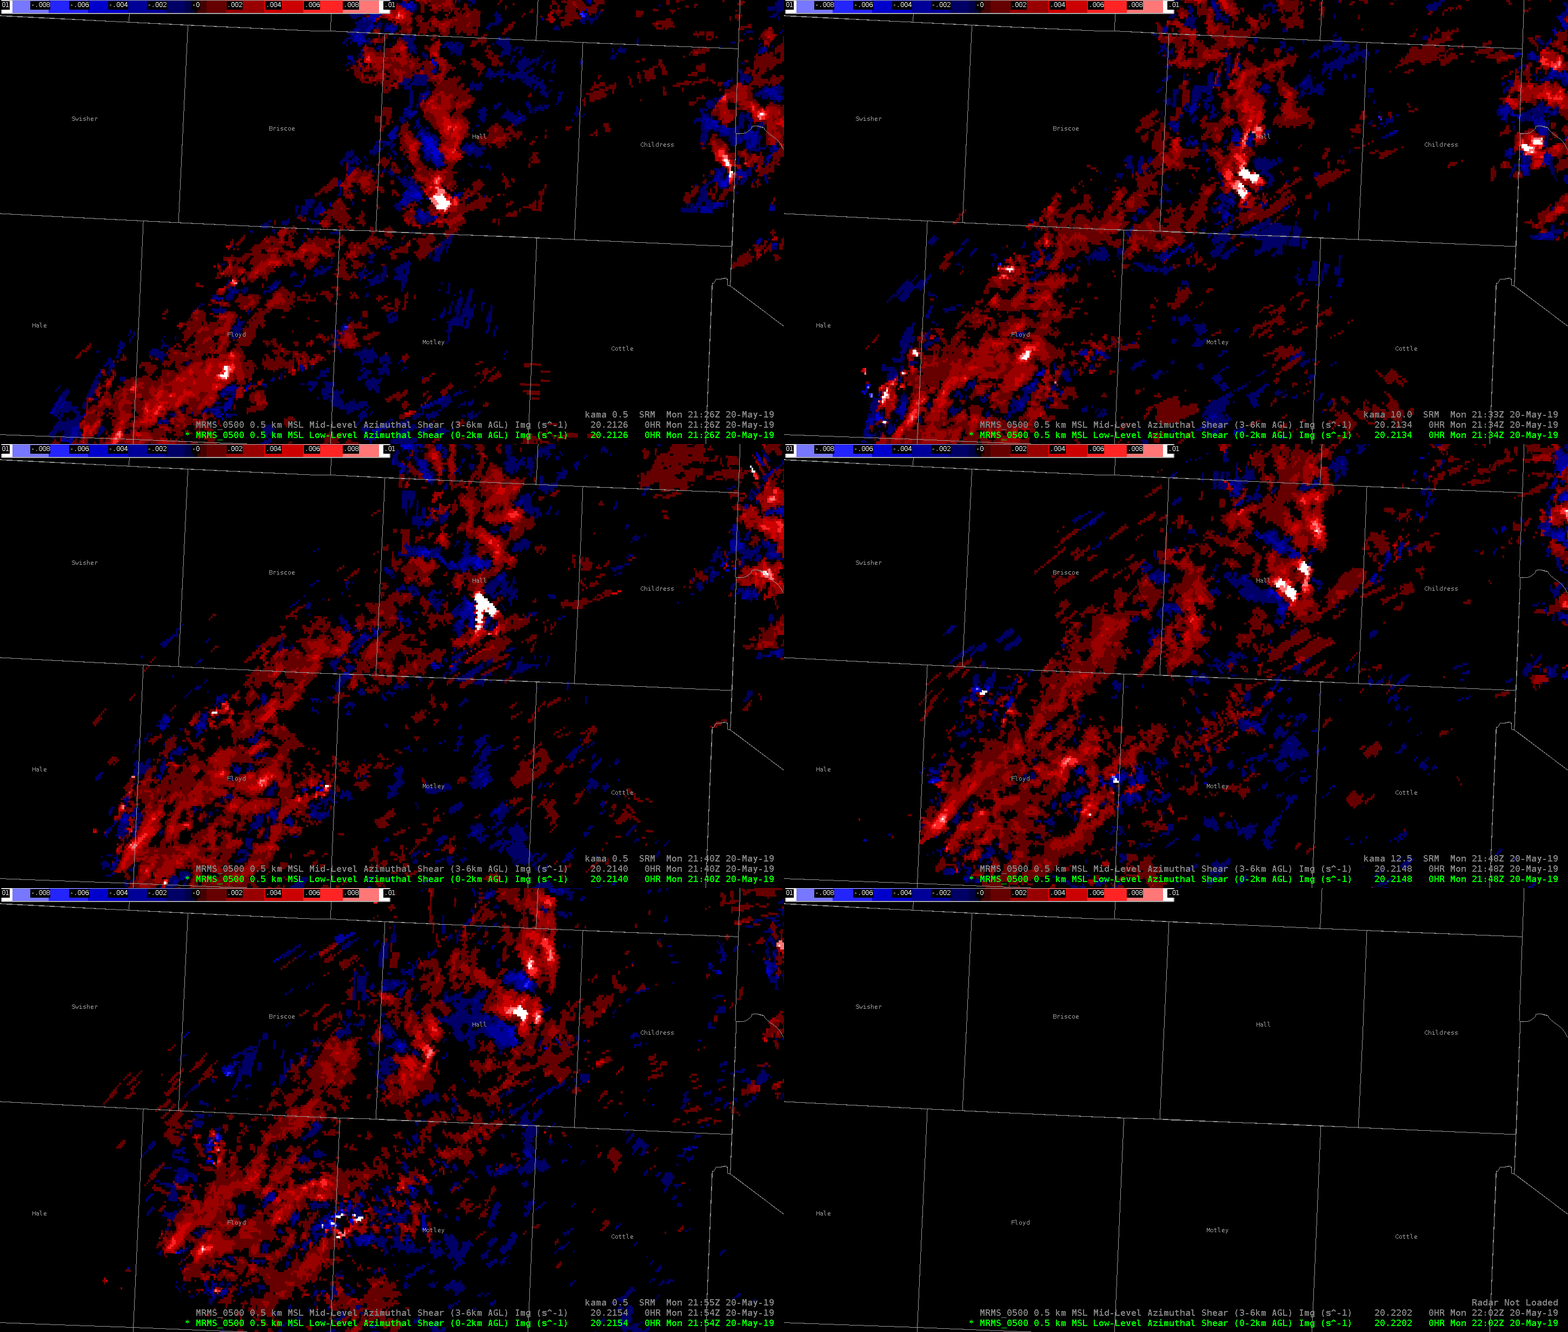
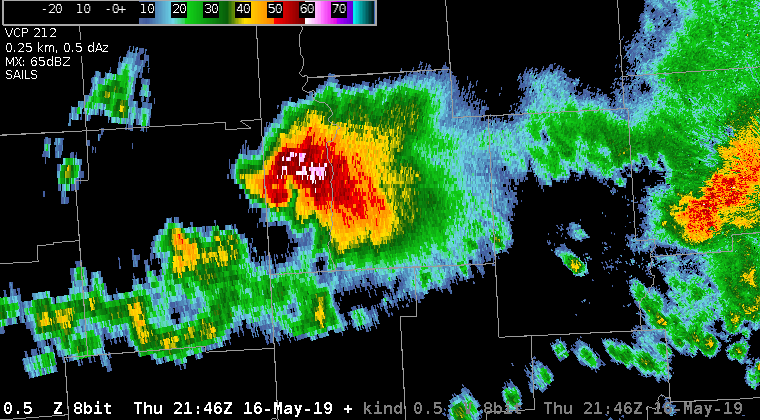
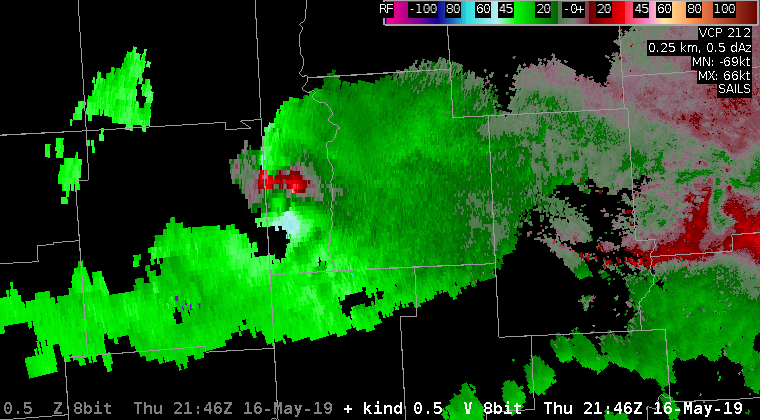
A tornado was observed via news footage near Mangum, OK.  The formation of this tornado was associated with an increase in CPTI for strong tornadoes to 46%:

The CPTI for violent tornadoes also increased to near 6% (not shown).

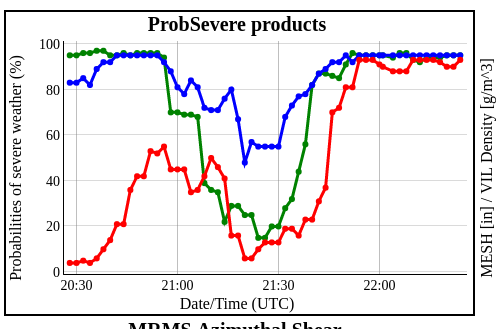
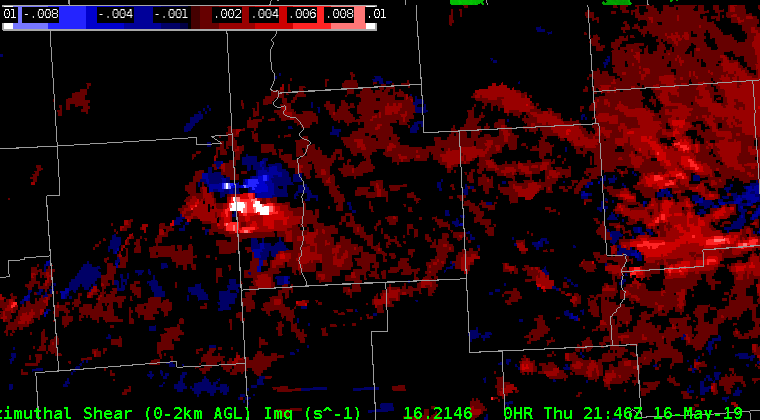
The ProbTor on this storm increased markedly between 2140-2155 UTC:

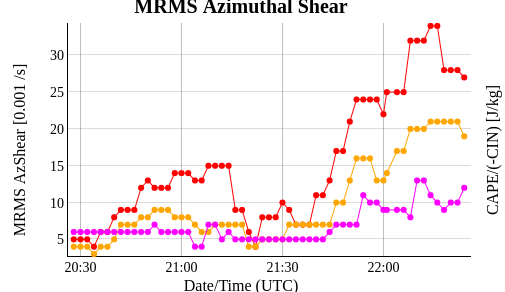
This increase was driven by an increase in AzShear:

Ron Dayne

Lowest-Level Rotational Velocity Product Comparison

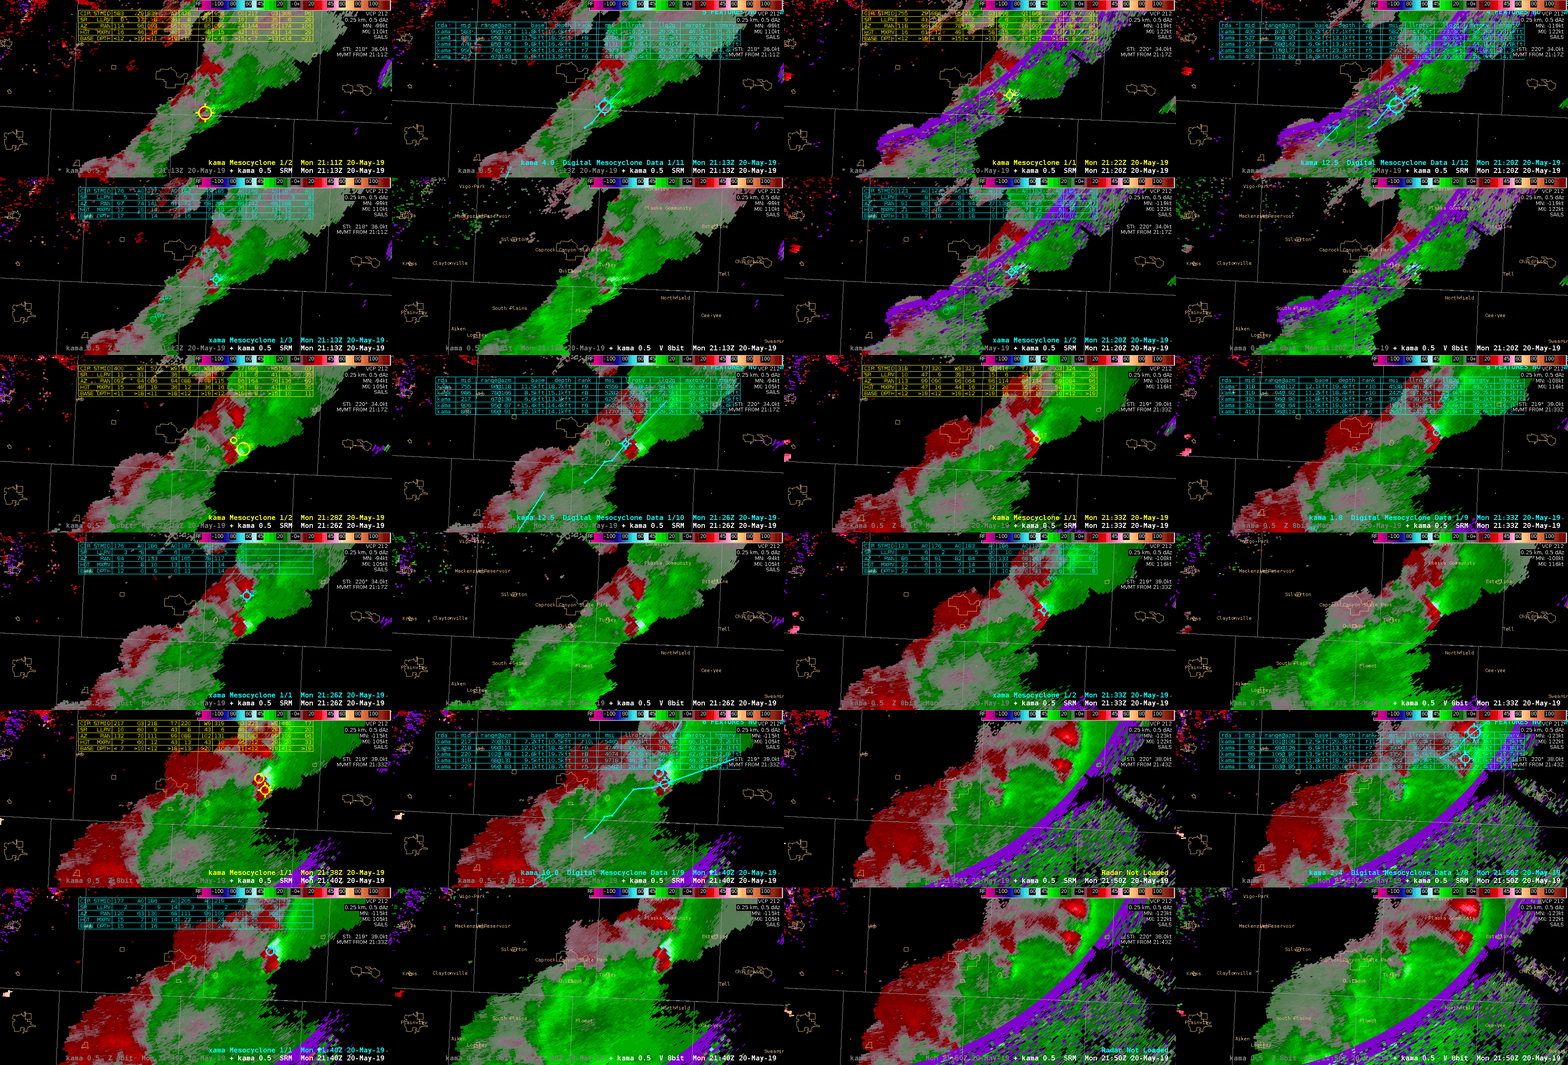
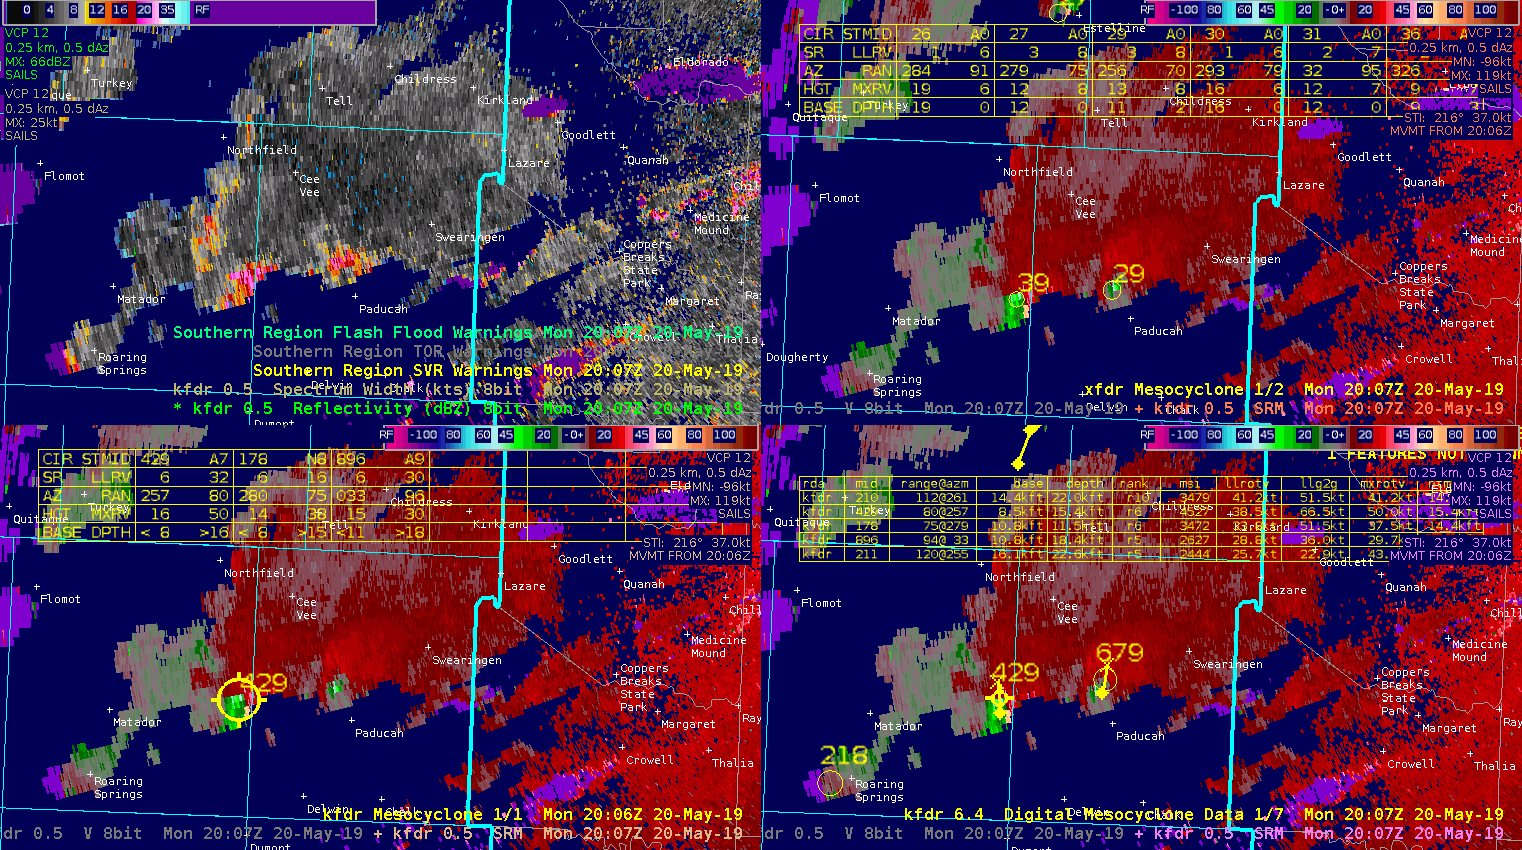
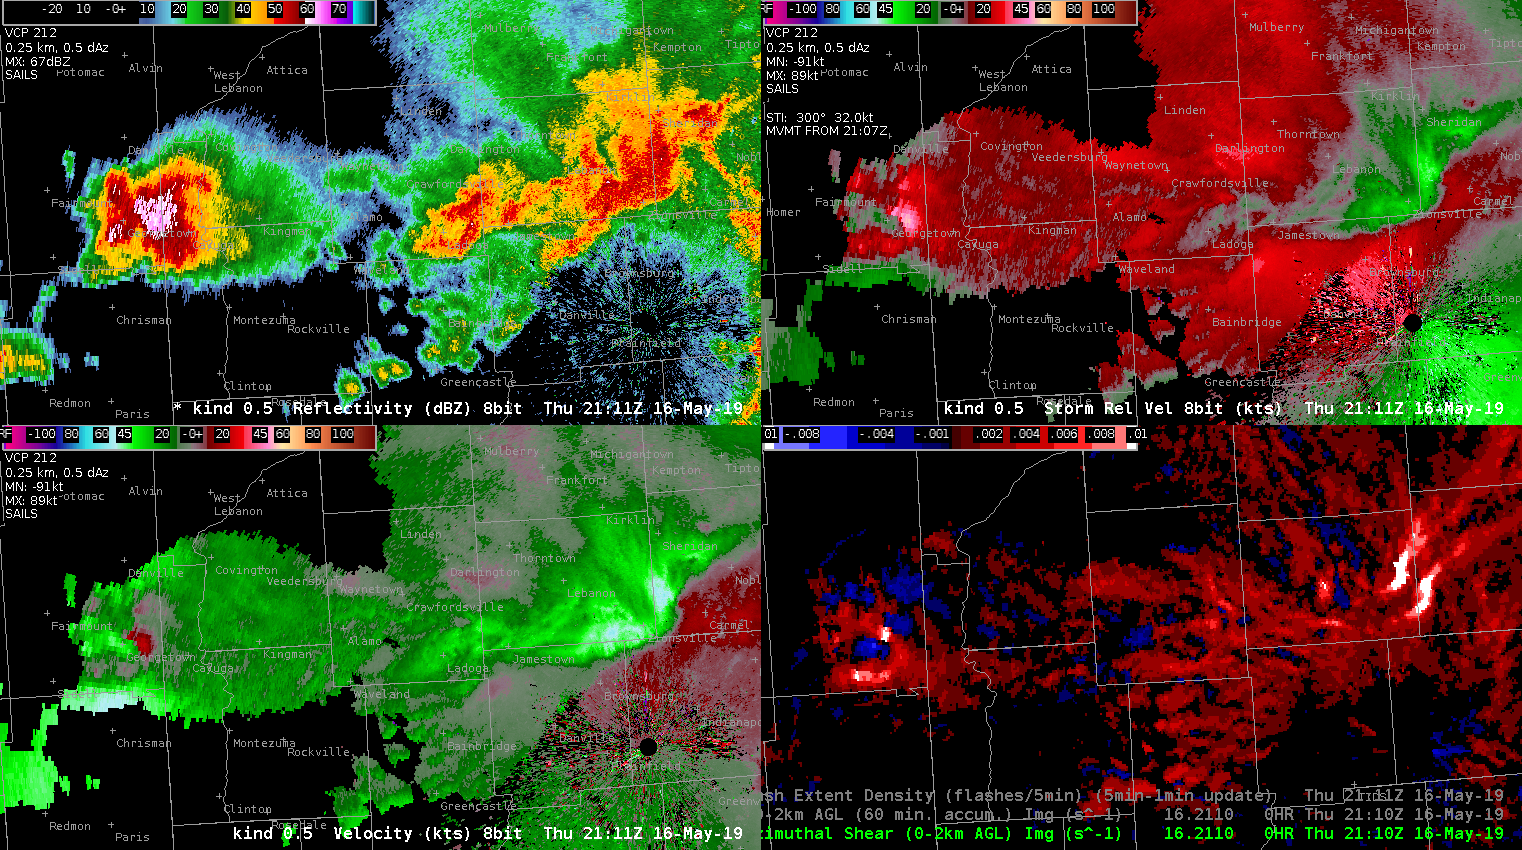
I’ve been trying really hard to come up with some useful observations regarding the three mesoscale detection algorithms, but struggling to come up with anything insightful. A loop all 3 algorithms (MDA top left, DMD top right, NMDA bottom left) is below. The three algorithms are overlayed on SRM and the bottom right panel is base V.

Two persistent mesoscyclones in Hall county are largely well-detected by all 3 algorithms with only minor differences is tracking. A relevant limitation for this storm is range from the radar (>65 nm) and interference from range folding. The New Mesocyclone Detection Algorithm (NMDA) is limited in its latency, making its real-time applicability limited. I rarely use the mesoscale detection algorithms operationally because I find the table difficult to read. It is easier for me to interrogate the radar data than to use the MDA or DMD. Perhaps reformatting the data display would help make the NMDA more usable.

On the contrary, the AzShear product performed remarkably well on this particular cell. It is more visually obvious and helps focus forecaster attention in a very simple way. The loop is below:

For the purpose of identifying low-level rotation, AzShear does a much better job than any of the mesocyclone detection algorithms with respect to low-level rotational velocity. The mesocyclone detection algorithms do not add much value to my warning decision process. -Atlanta Braves

Bad Velocity Data Trips Alogrithms

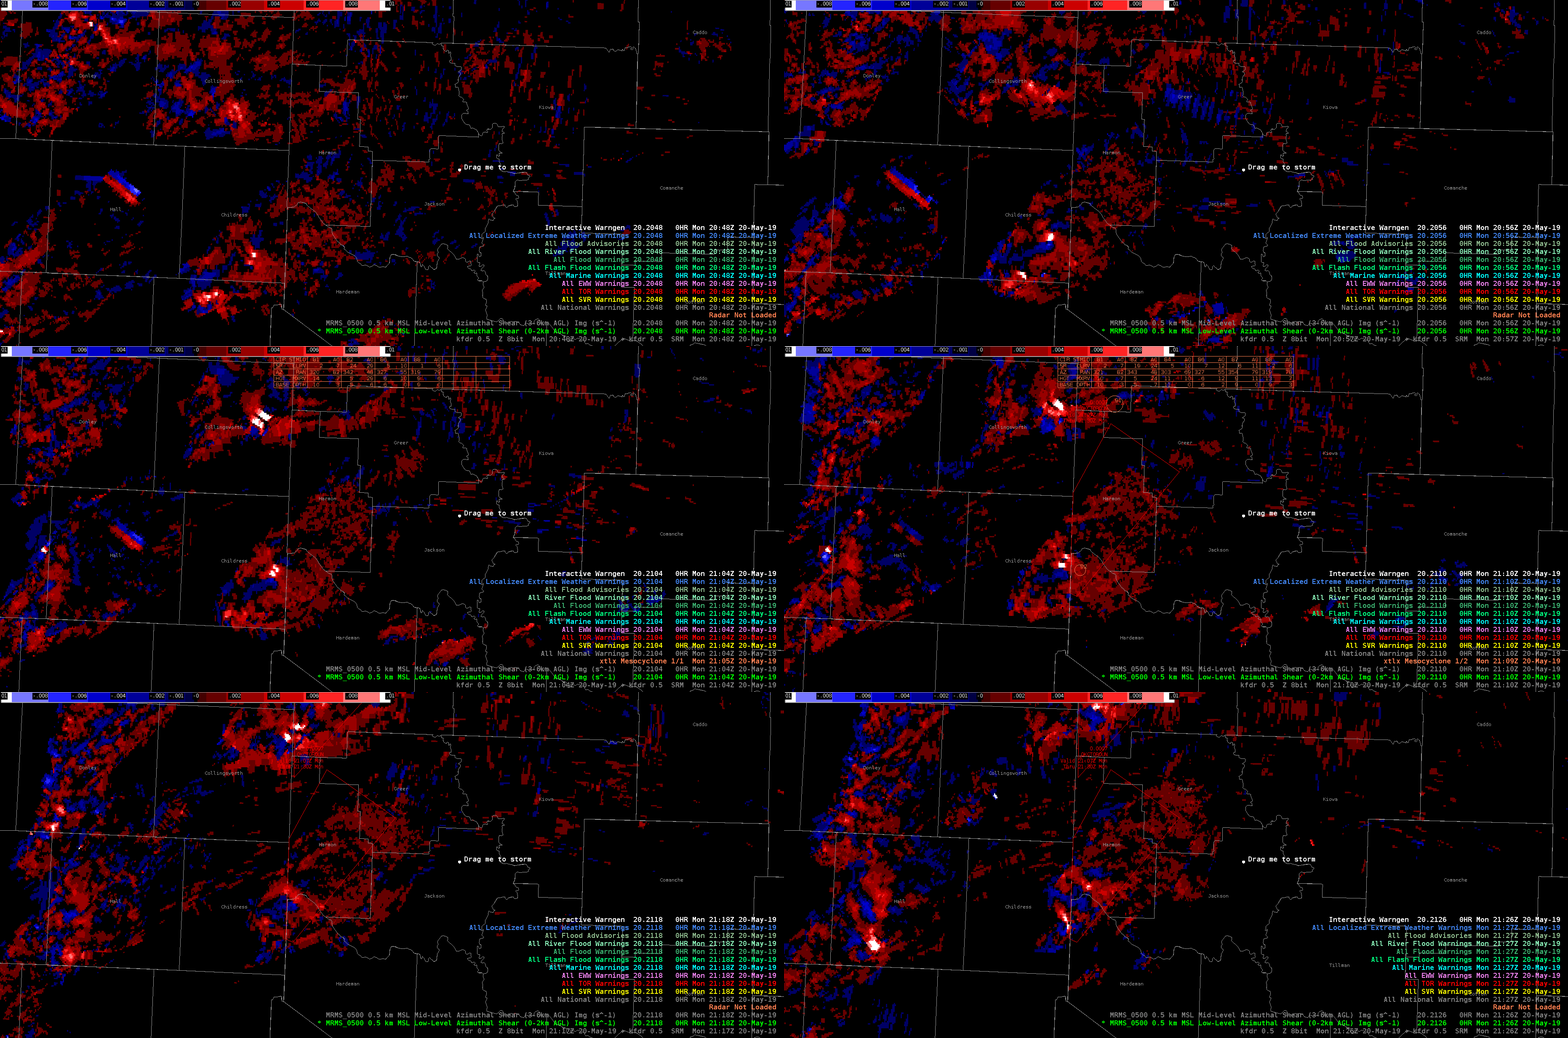
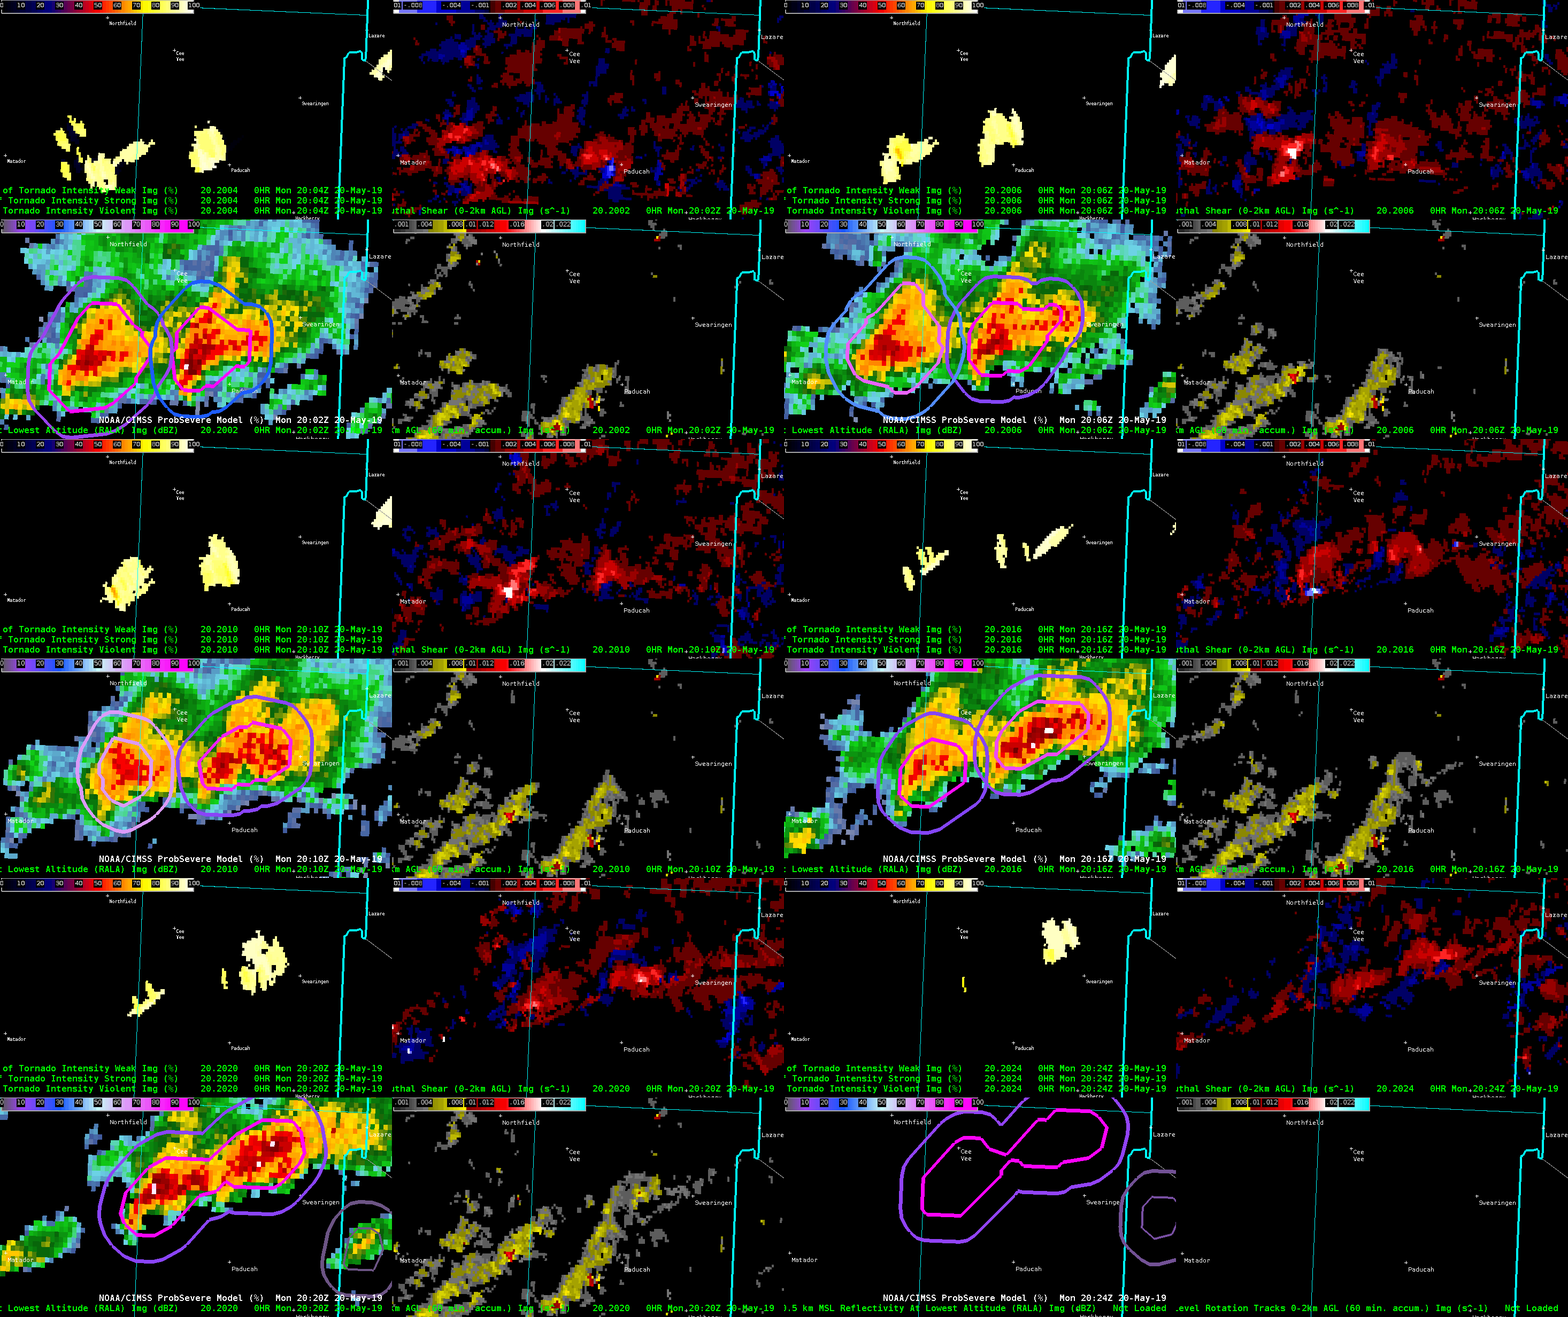
Just after 20z on the eastern fringe of the LUB CWA, the KFDR radar indicated an area of very high inbound velocity. However, this data is in question as the elevated velocity occurred in an area of low Z and high SW, and likely not representative of the actual storm. This may have been caused by a side lobe. This had cascading affects with algorithms being tested which could not filter out the bad data. Low level az shear spiked to over 0.01 in a group of stationary pixels. This caused algorithms that ingest the az shear product to spike including ProbTor which increased to over 90%, as well as CPTI which showed lower end probabilities of a violent tornado in progress.

Dave Grohl

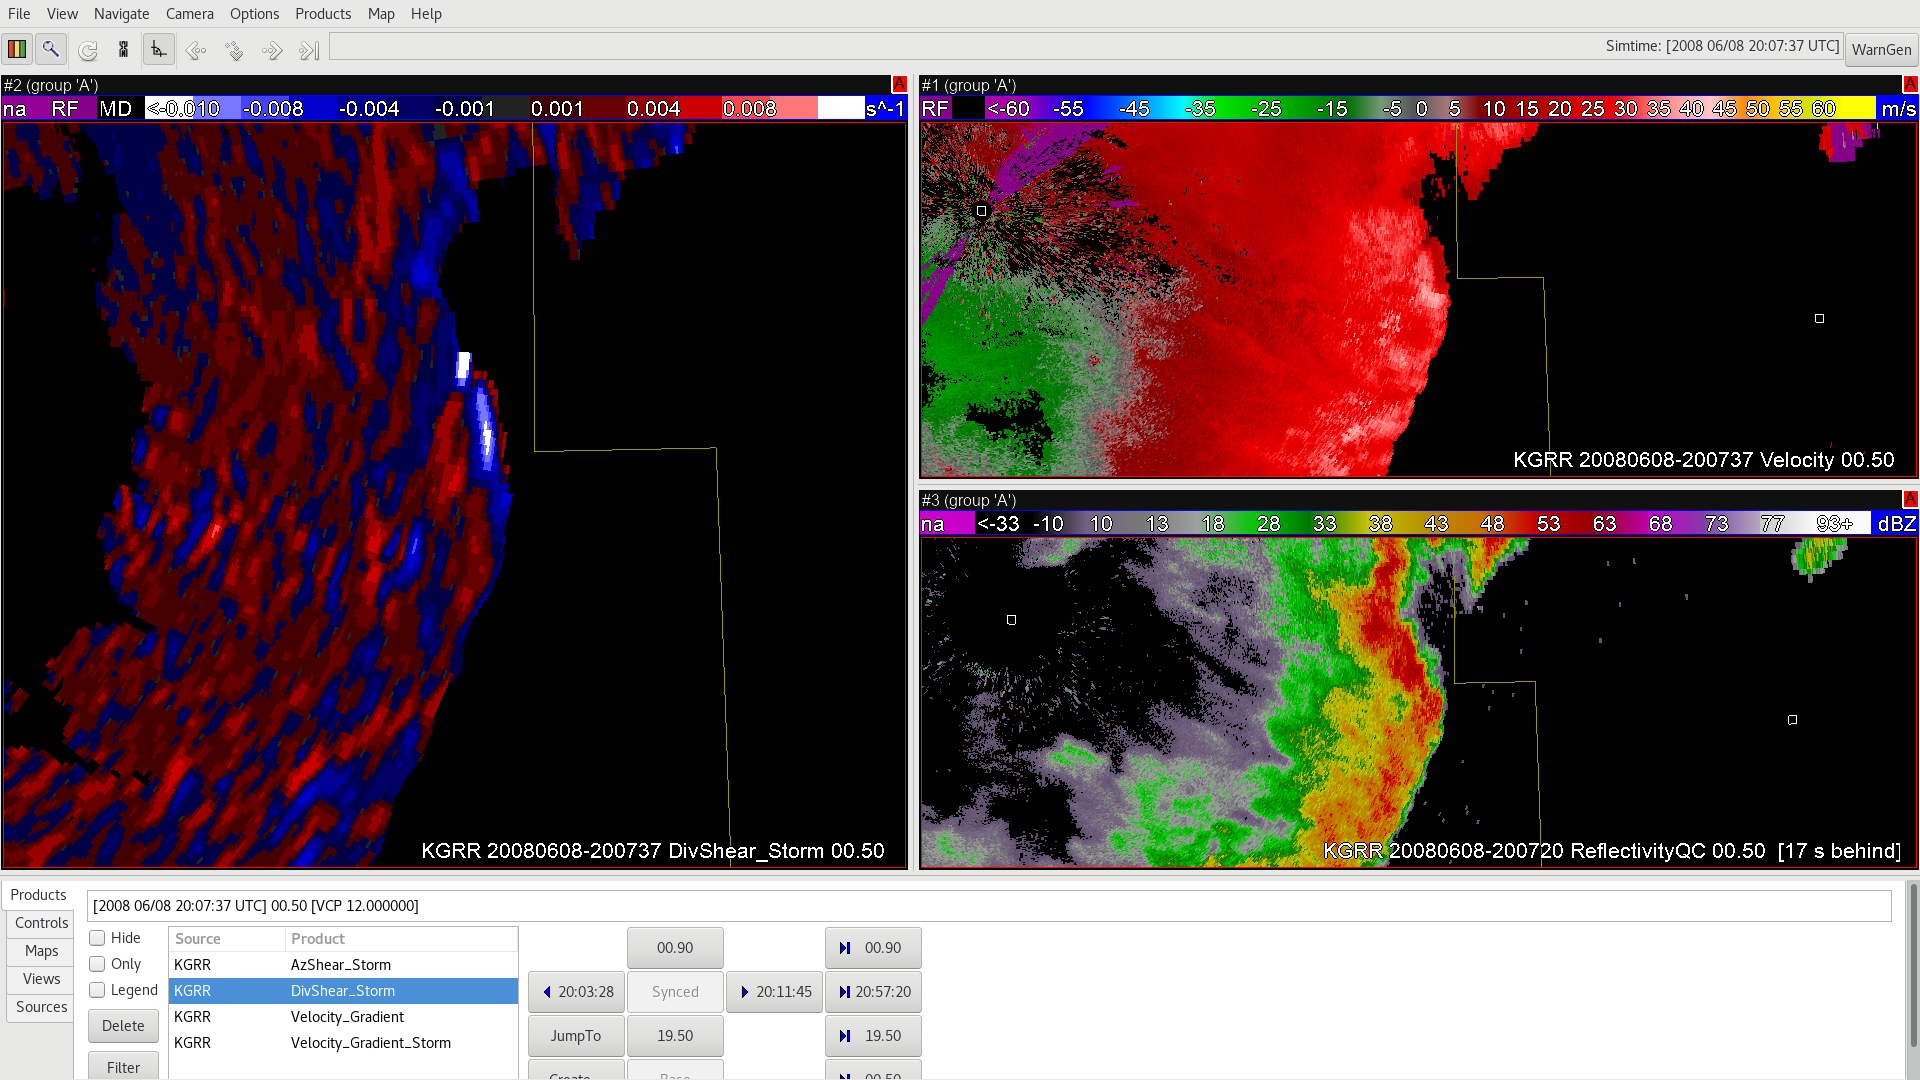
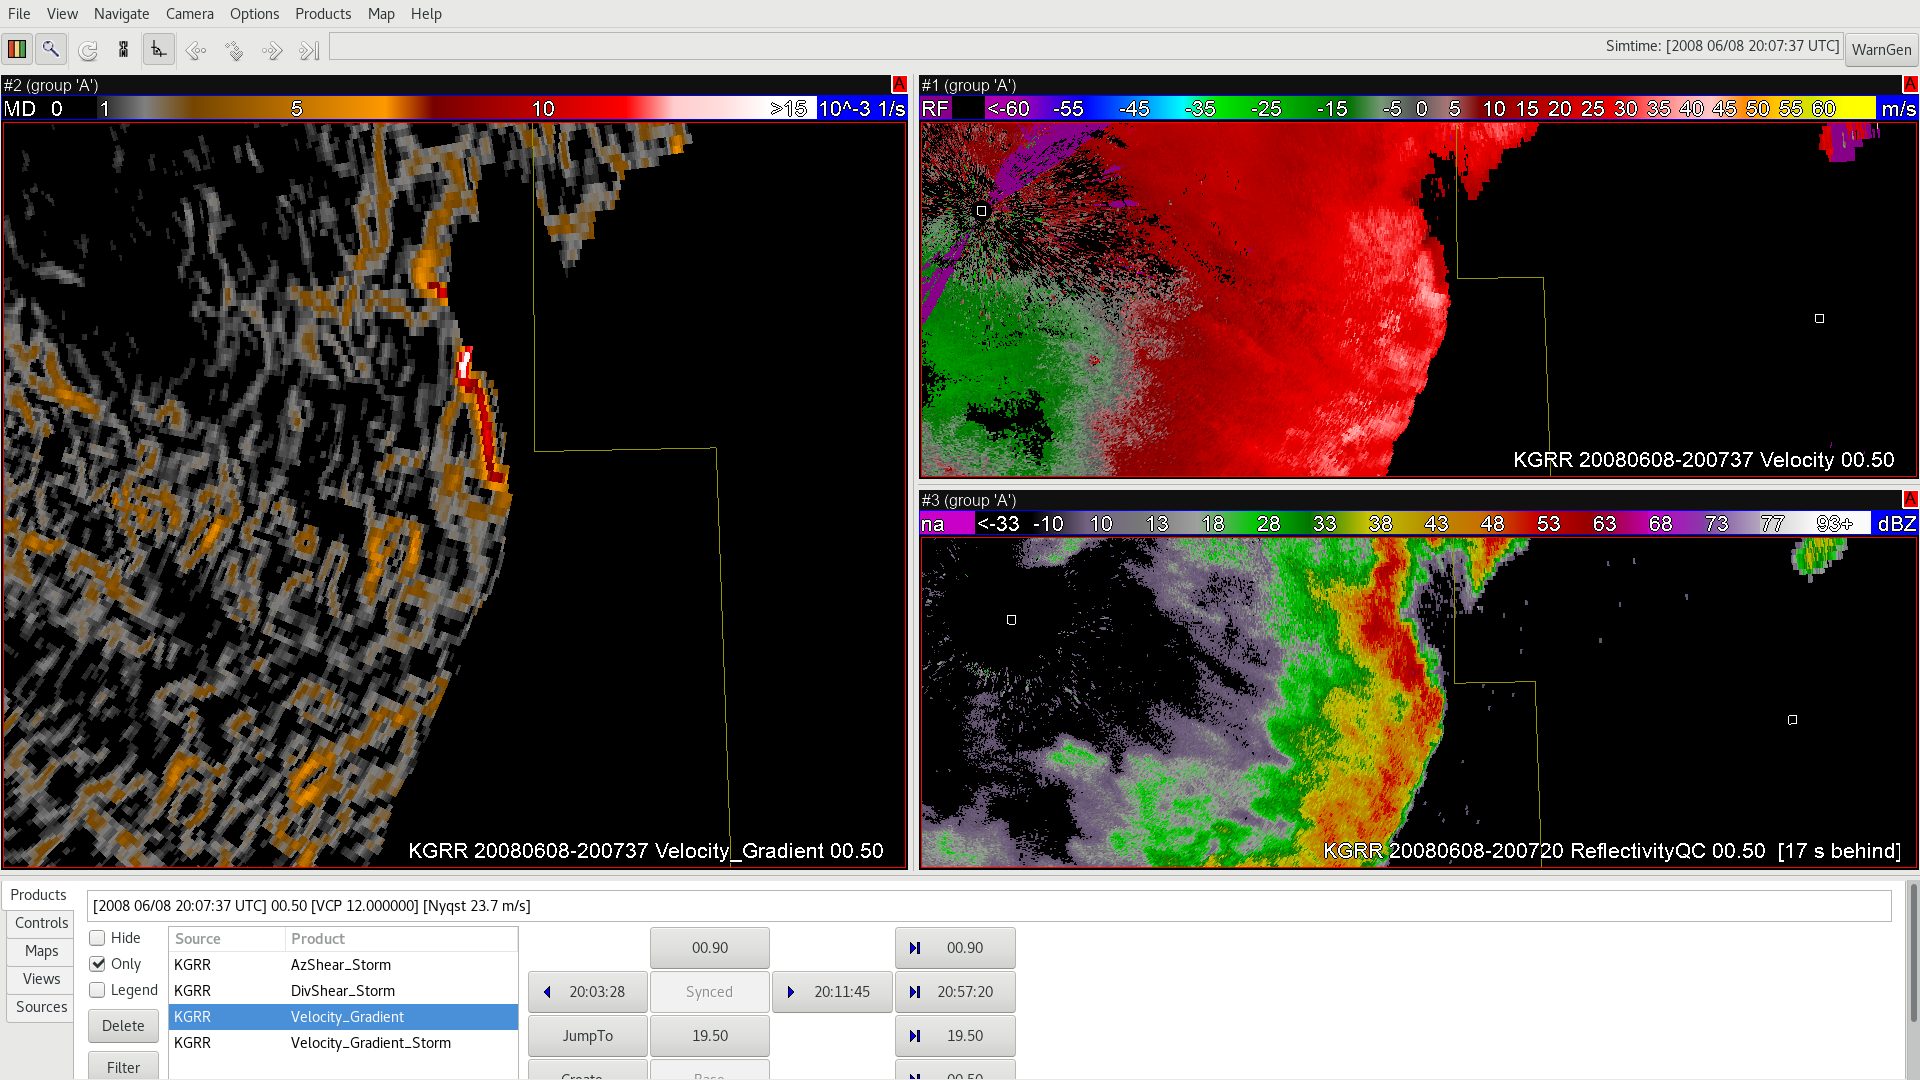
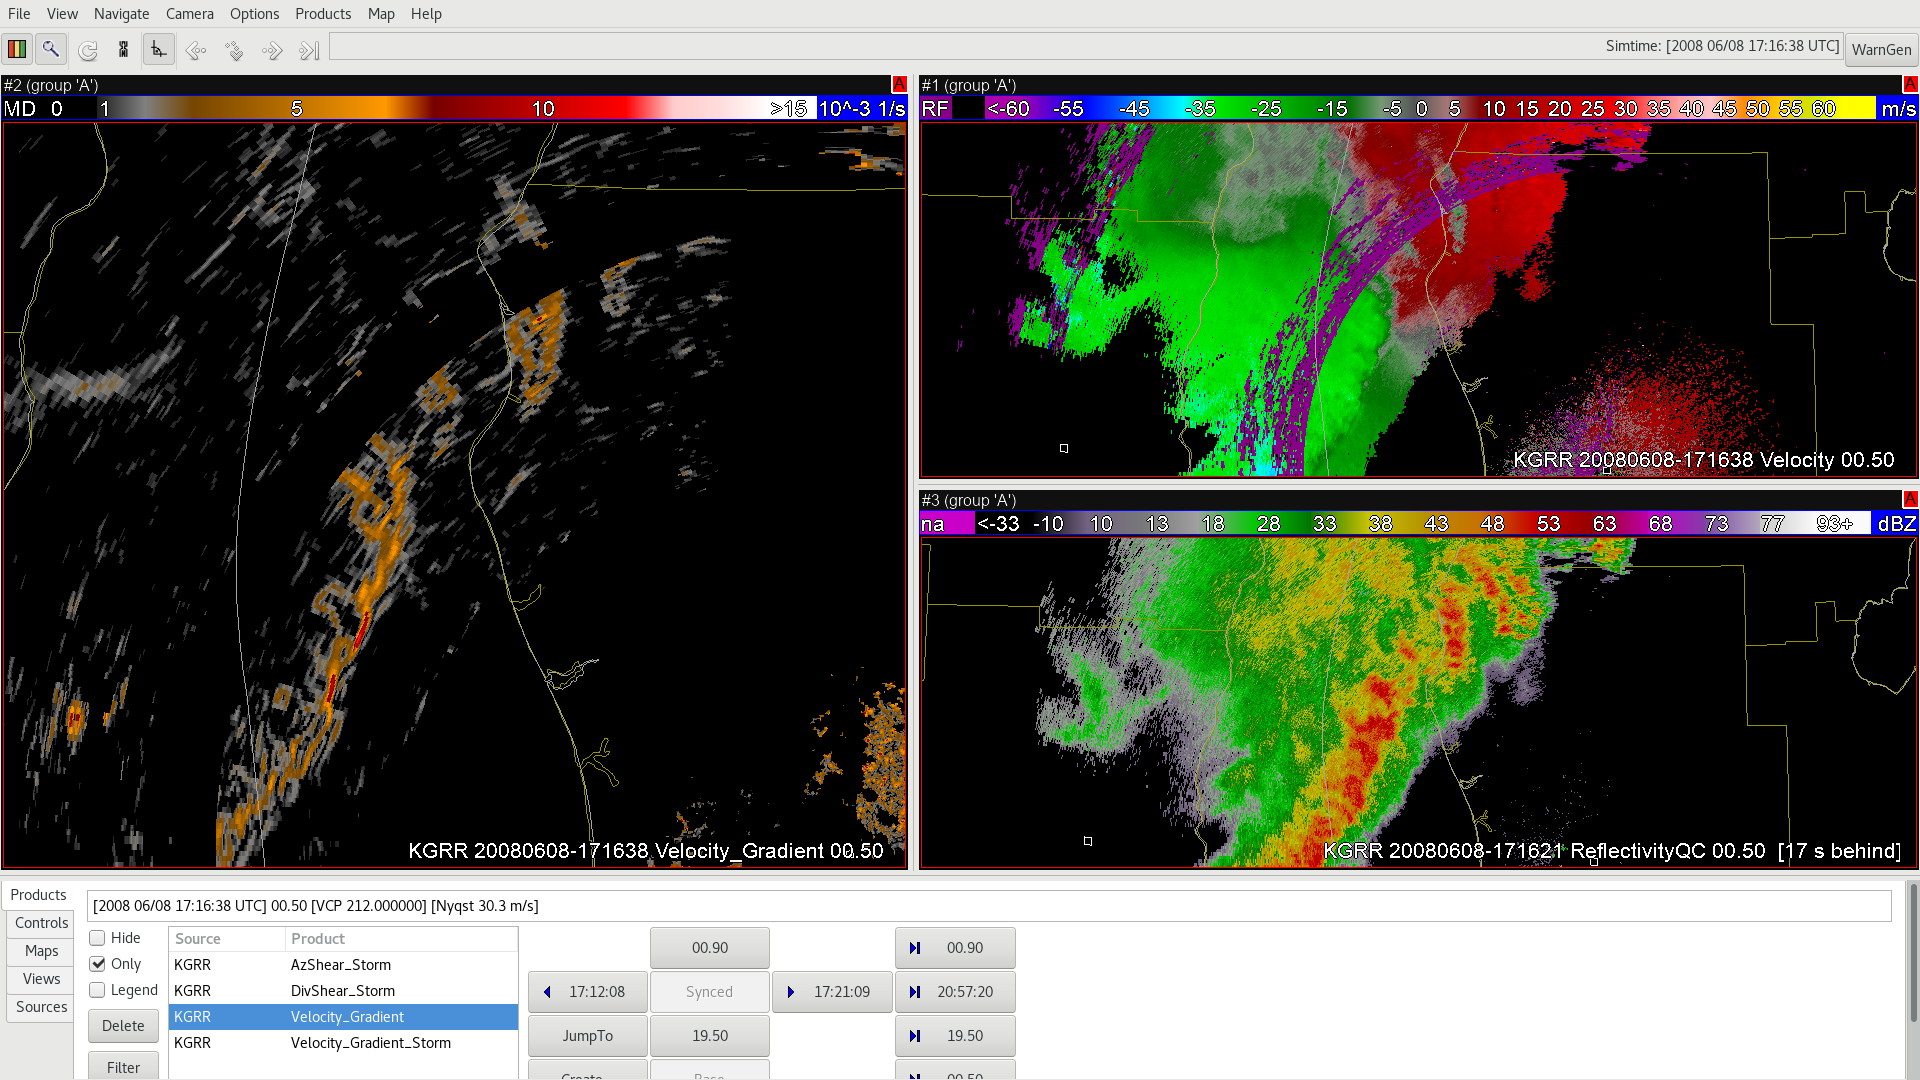
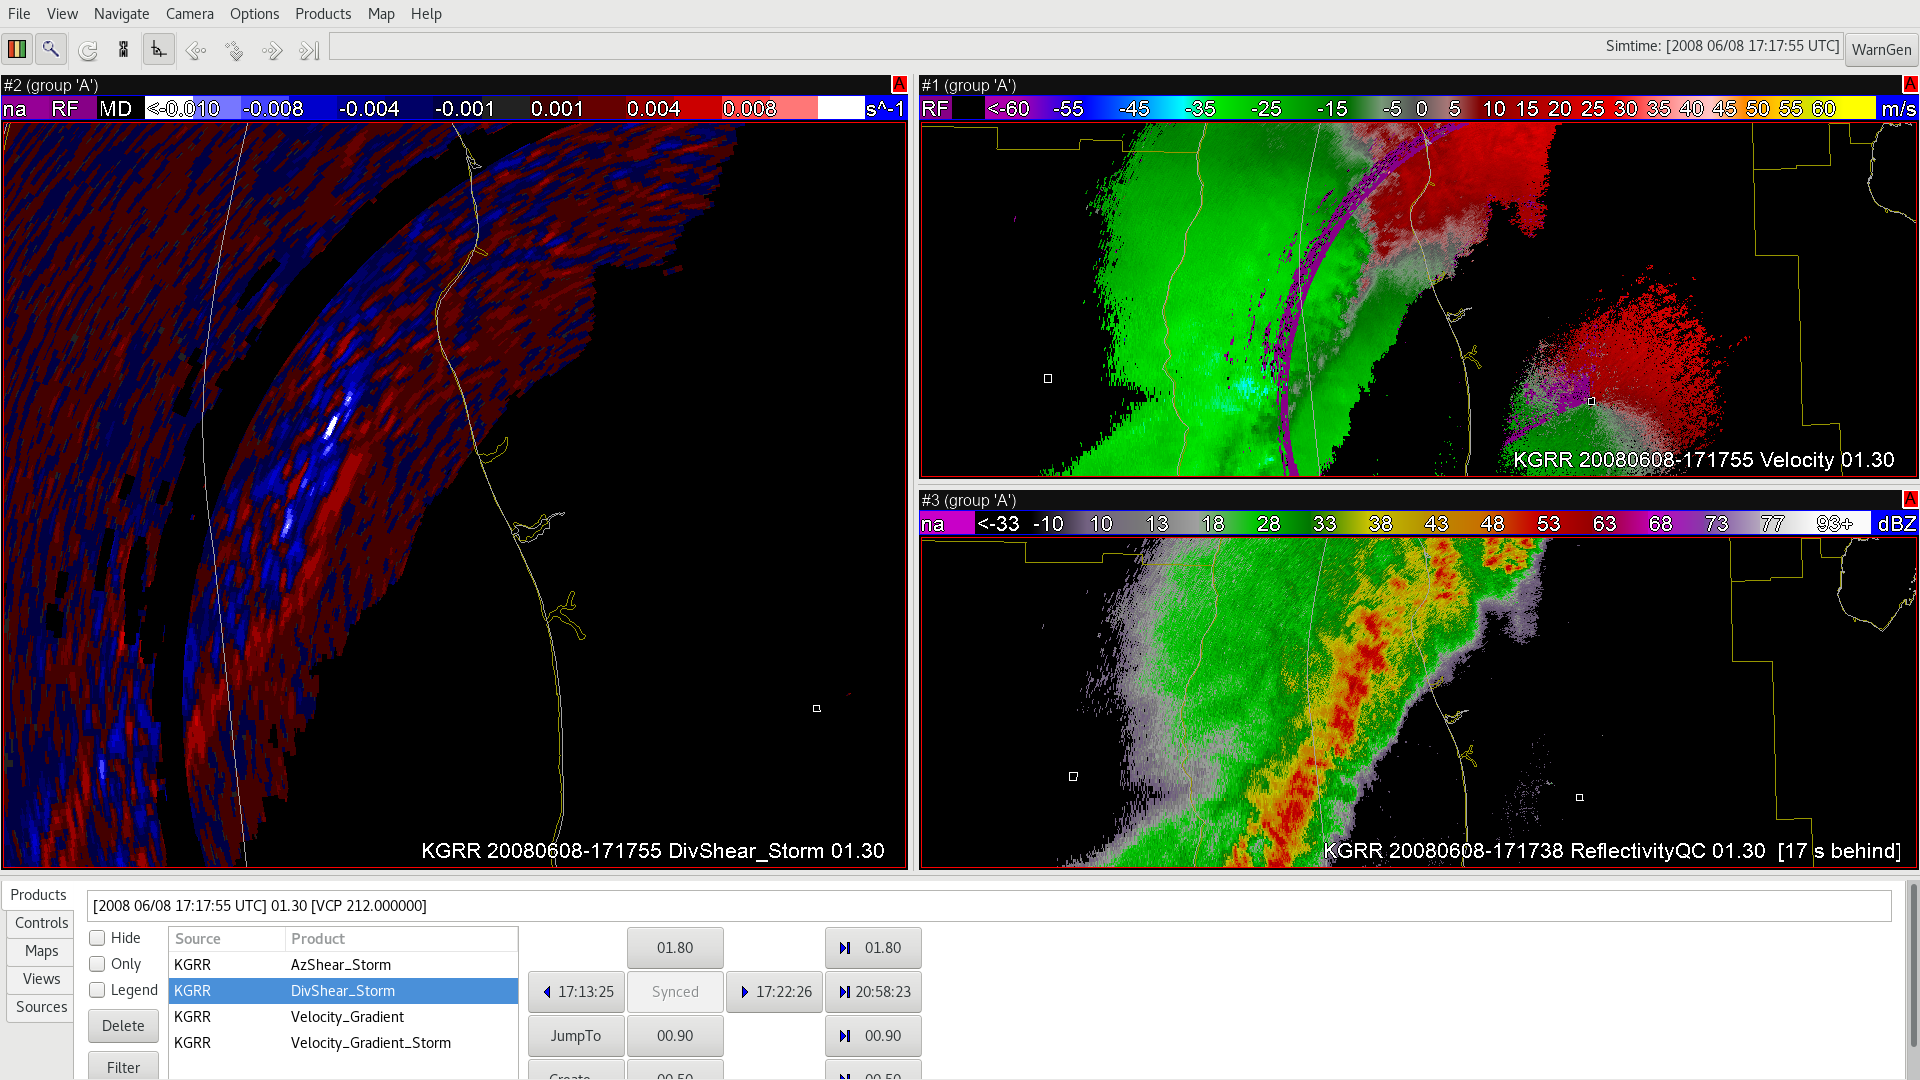
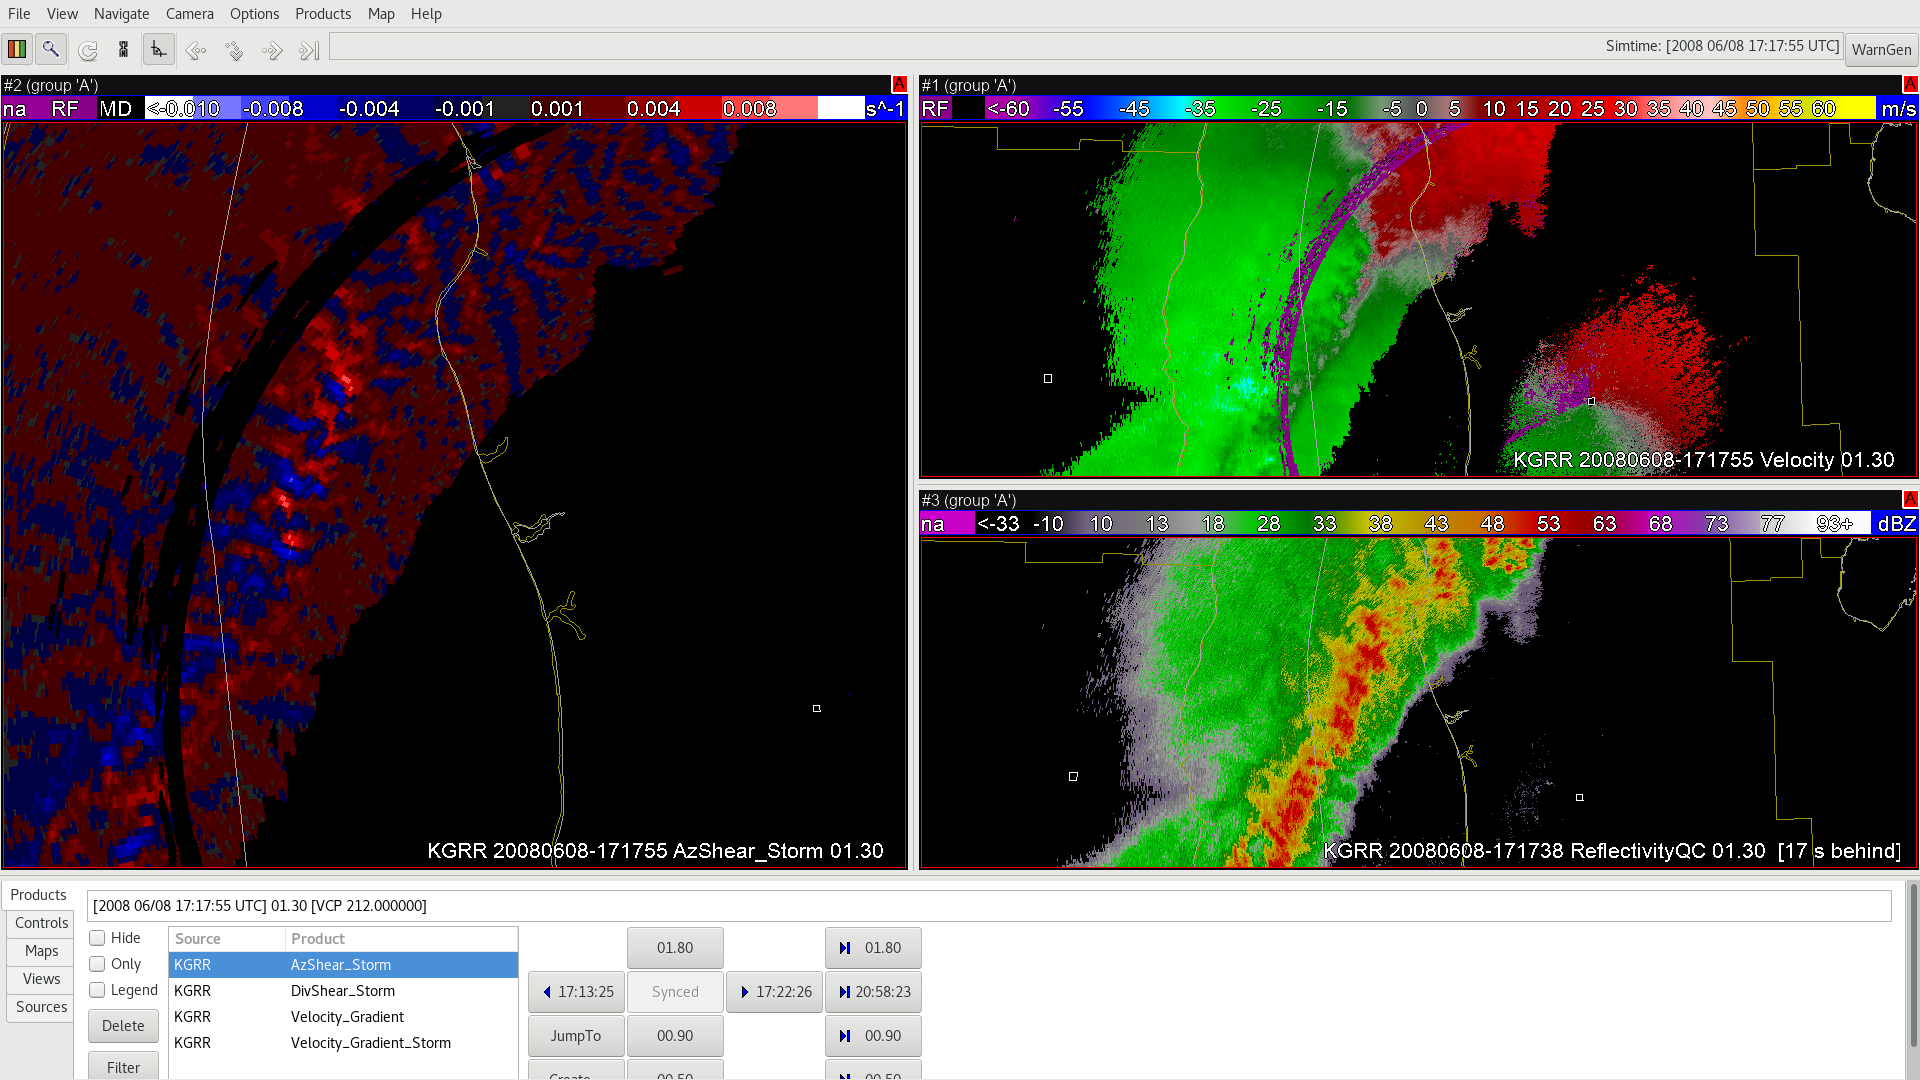
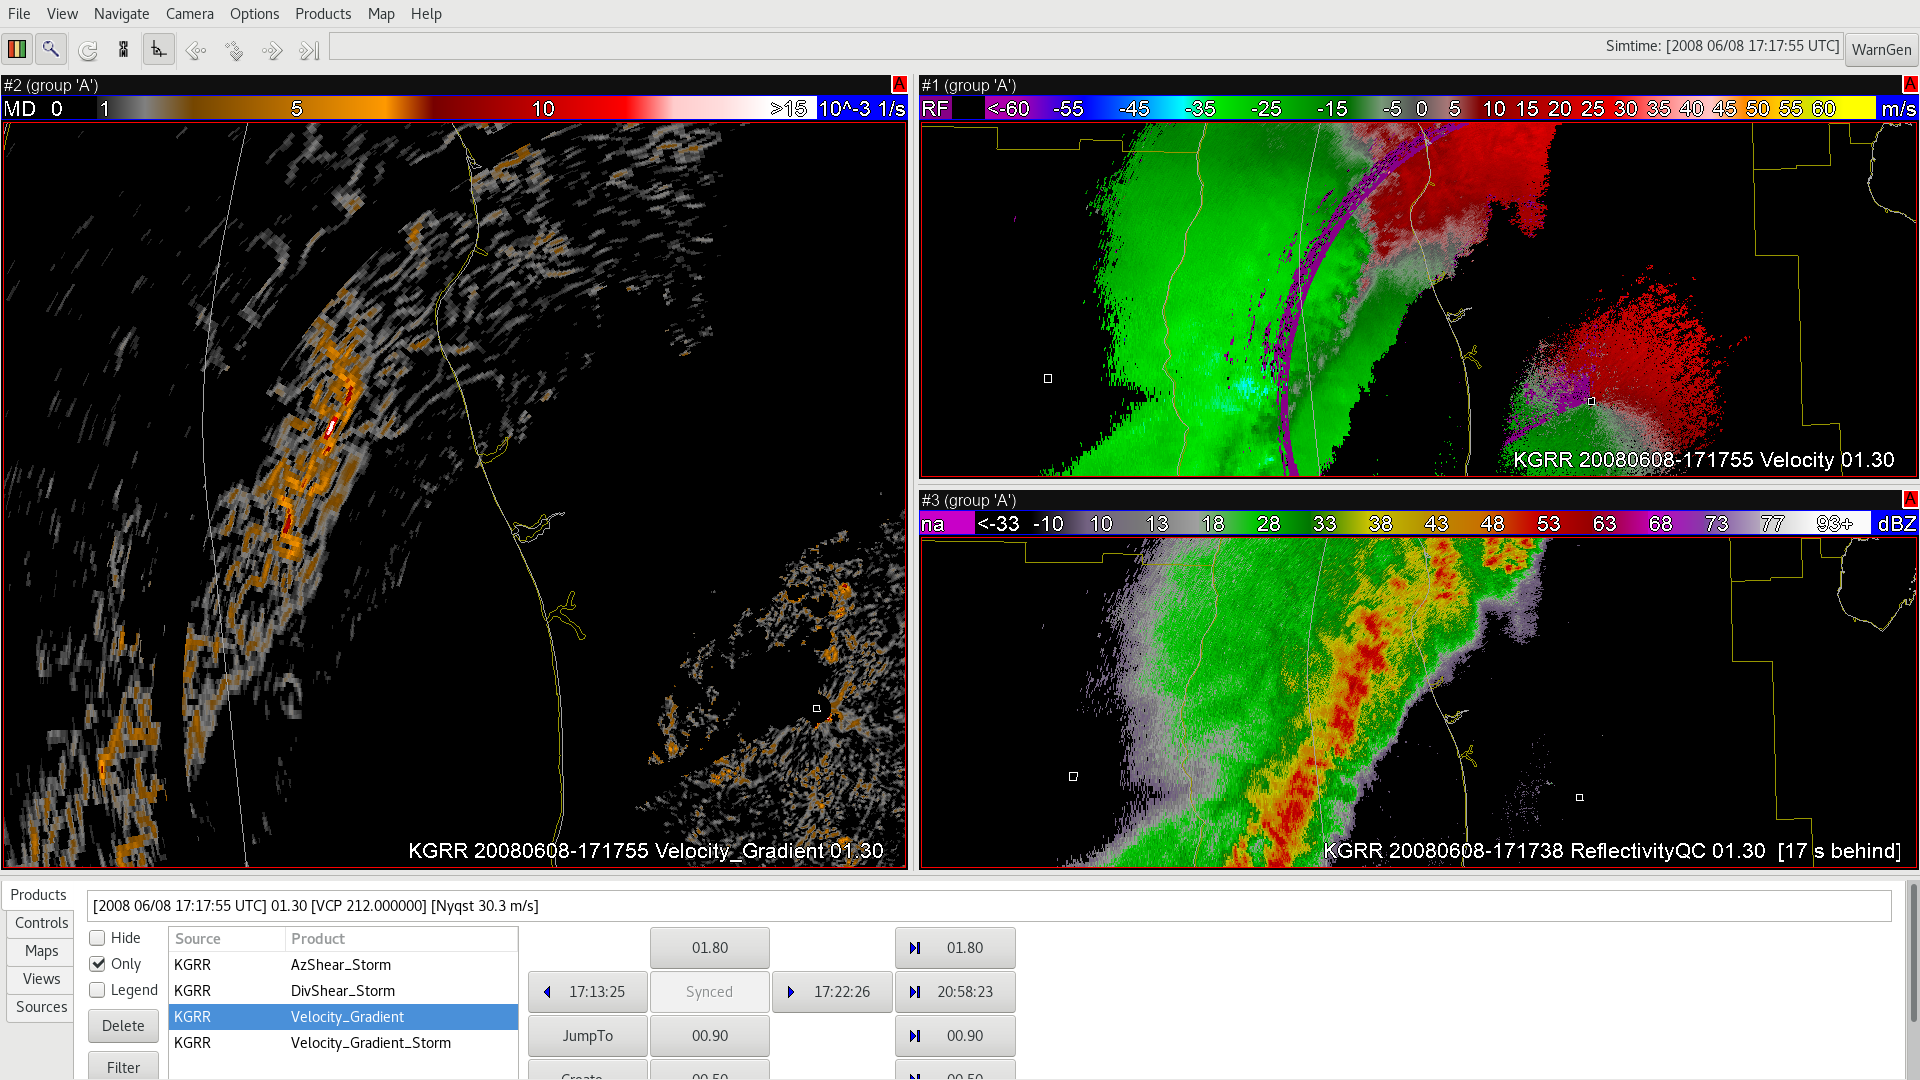
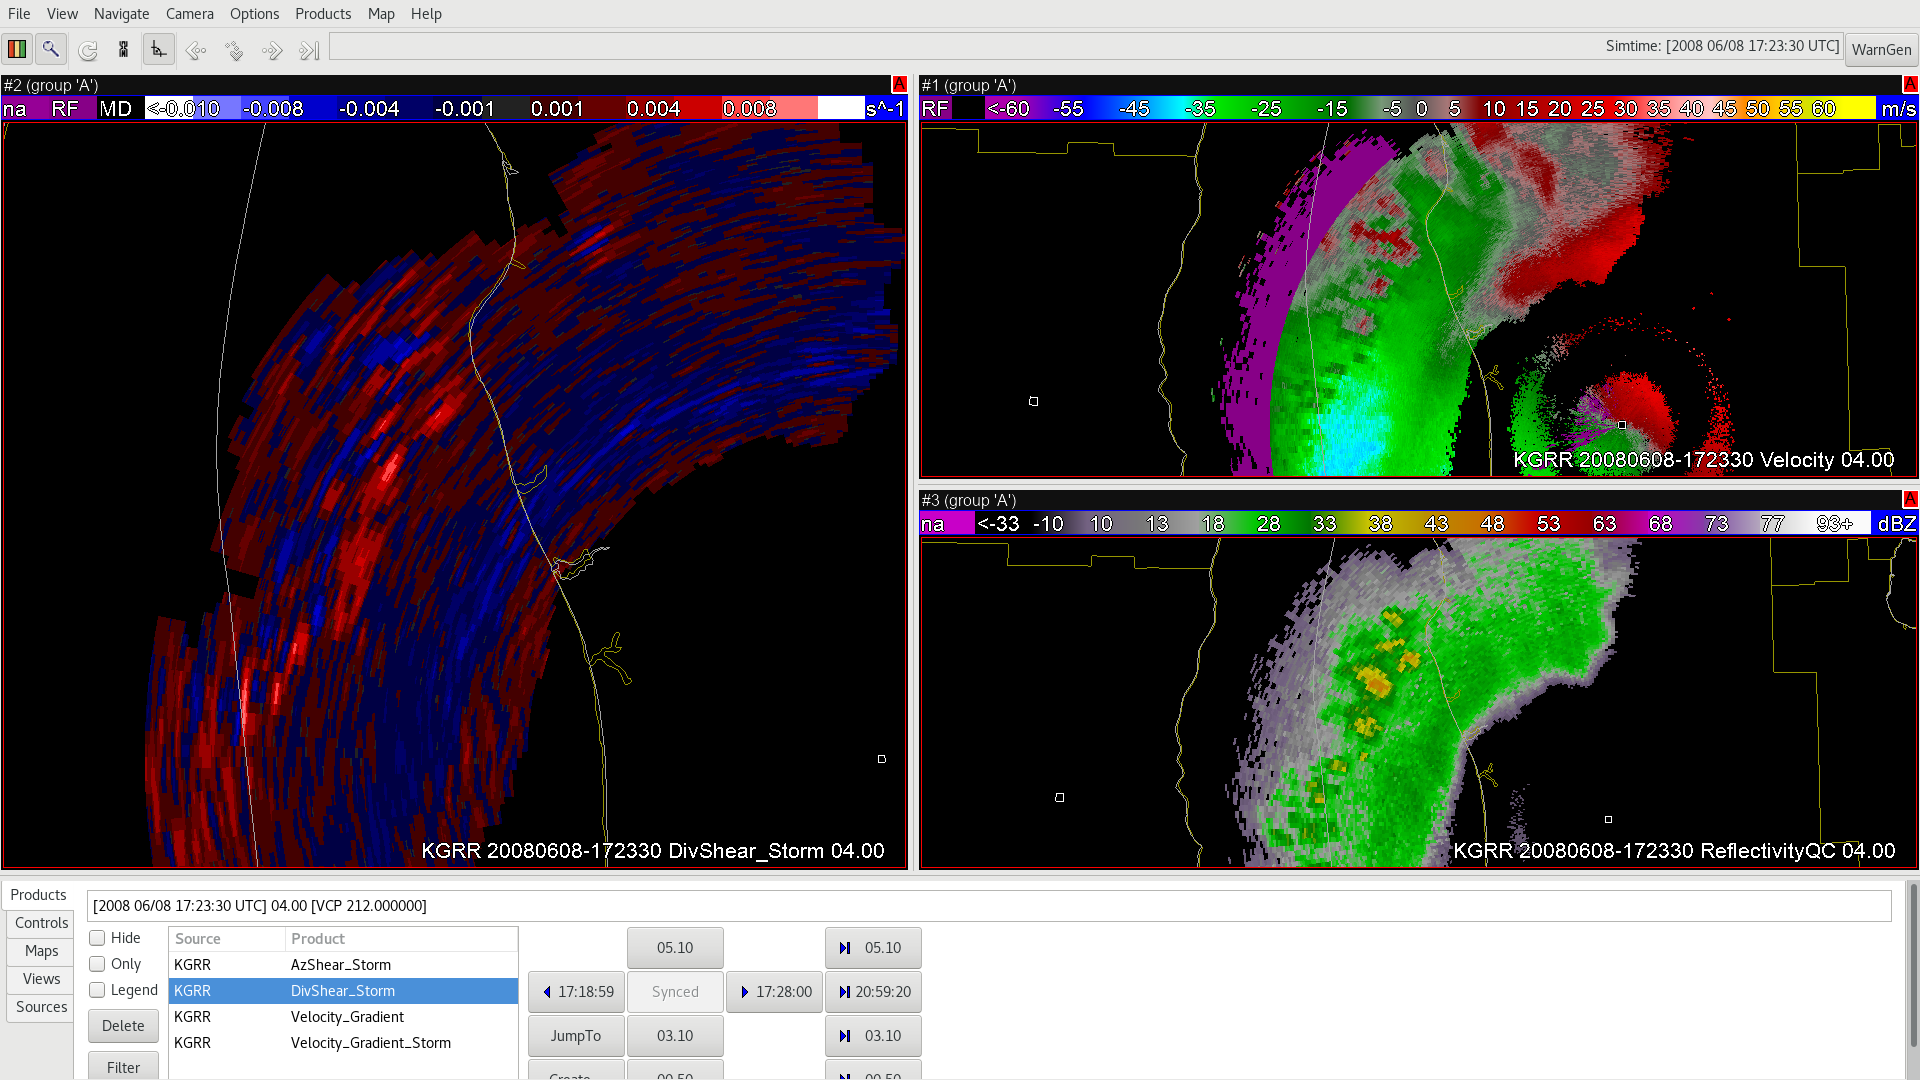
Div Shear and Velocity Gradient associated with a damaging QLCS mesovortex

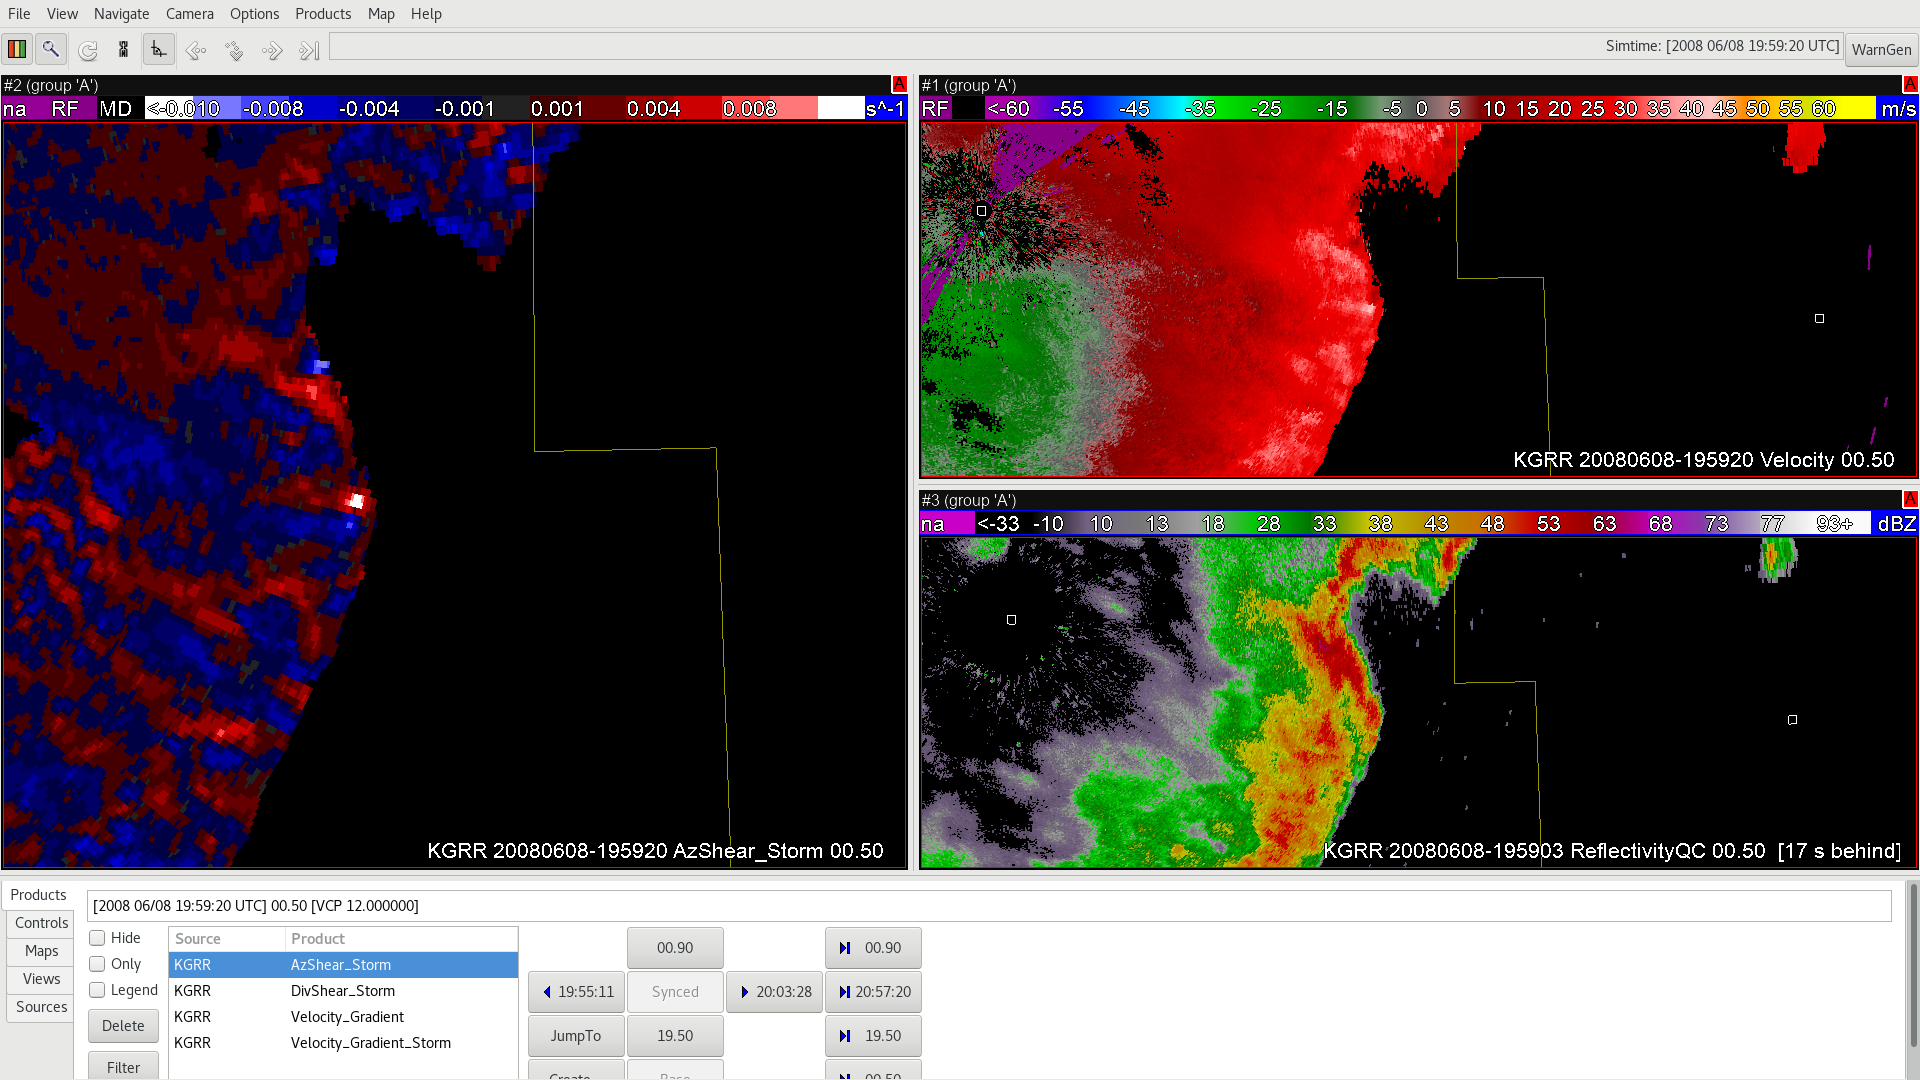
All righty, now let’s take a look at a maturing QLCS mesovortex, starting with AzShear…

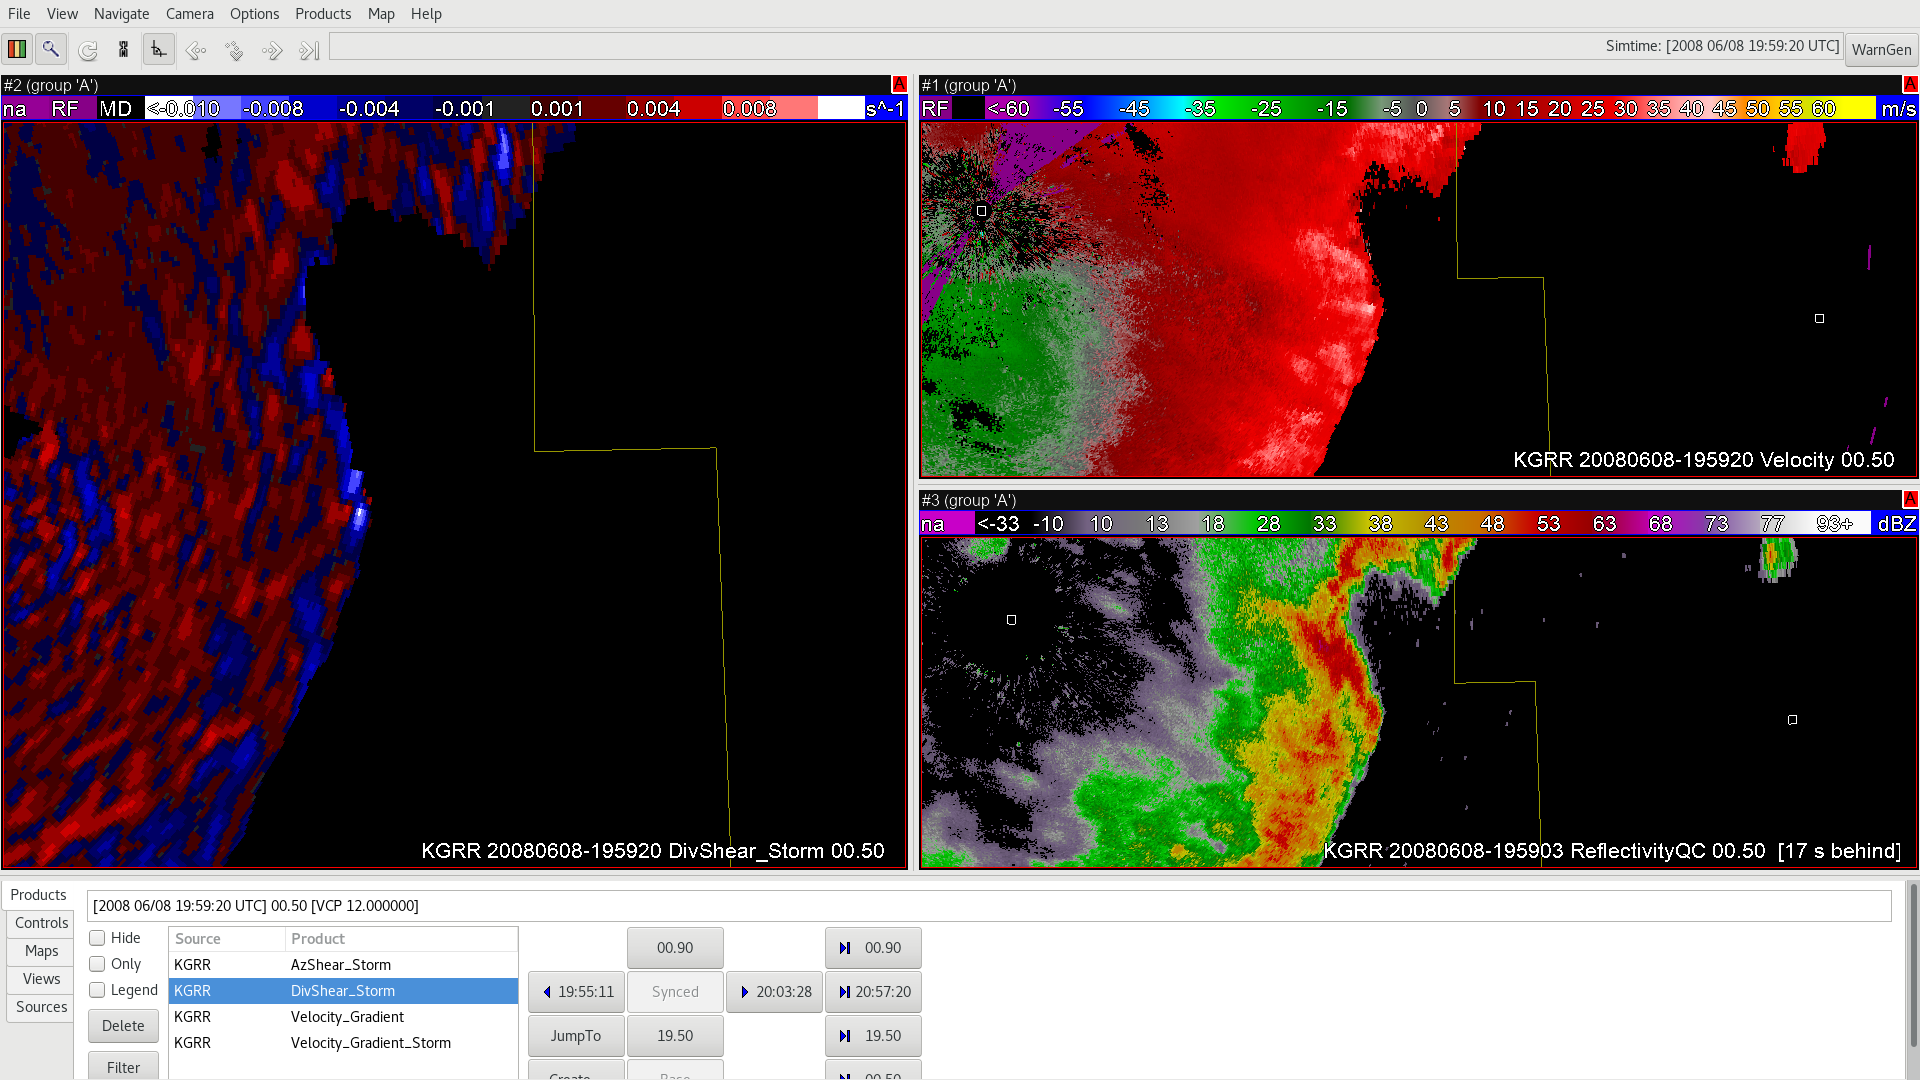
At the apex of the bow we see a bit of an AzShear couplet (maximum at the apex with a weaker “blue” minimum just to the south). Comparing this to DivShear…

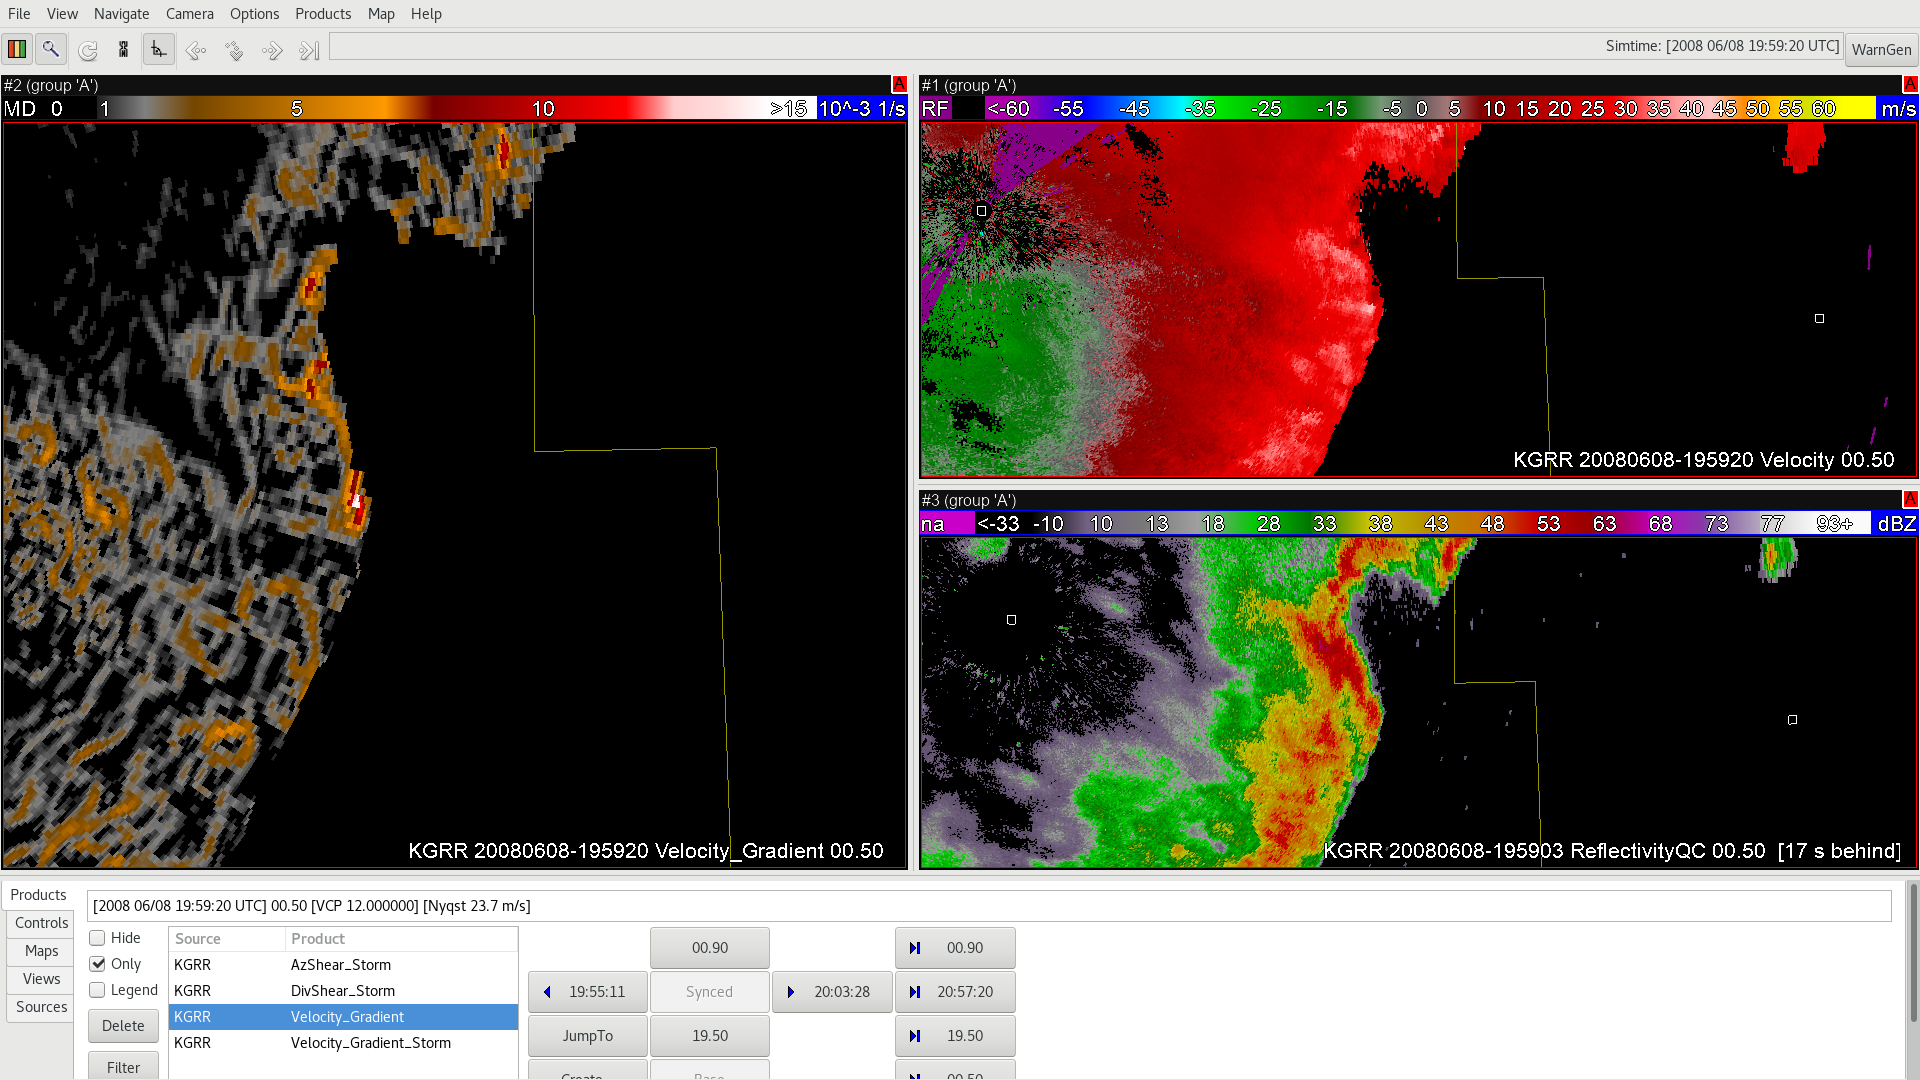
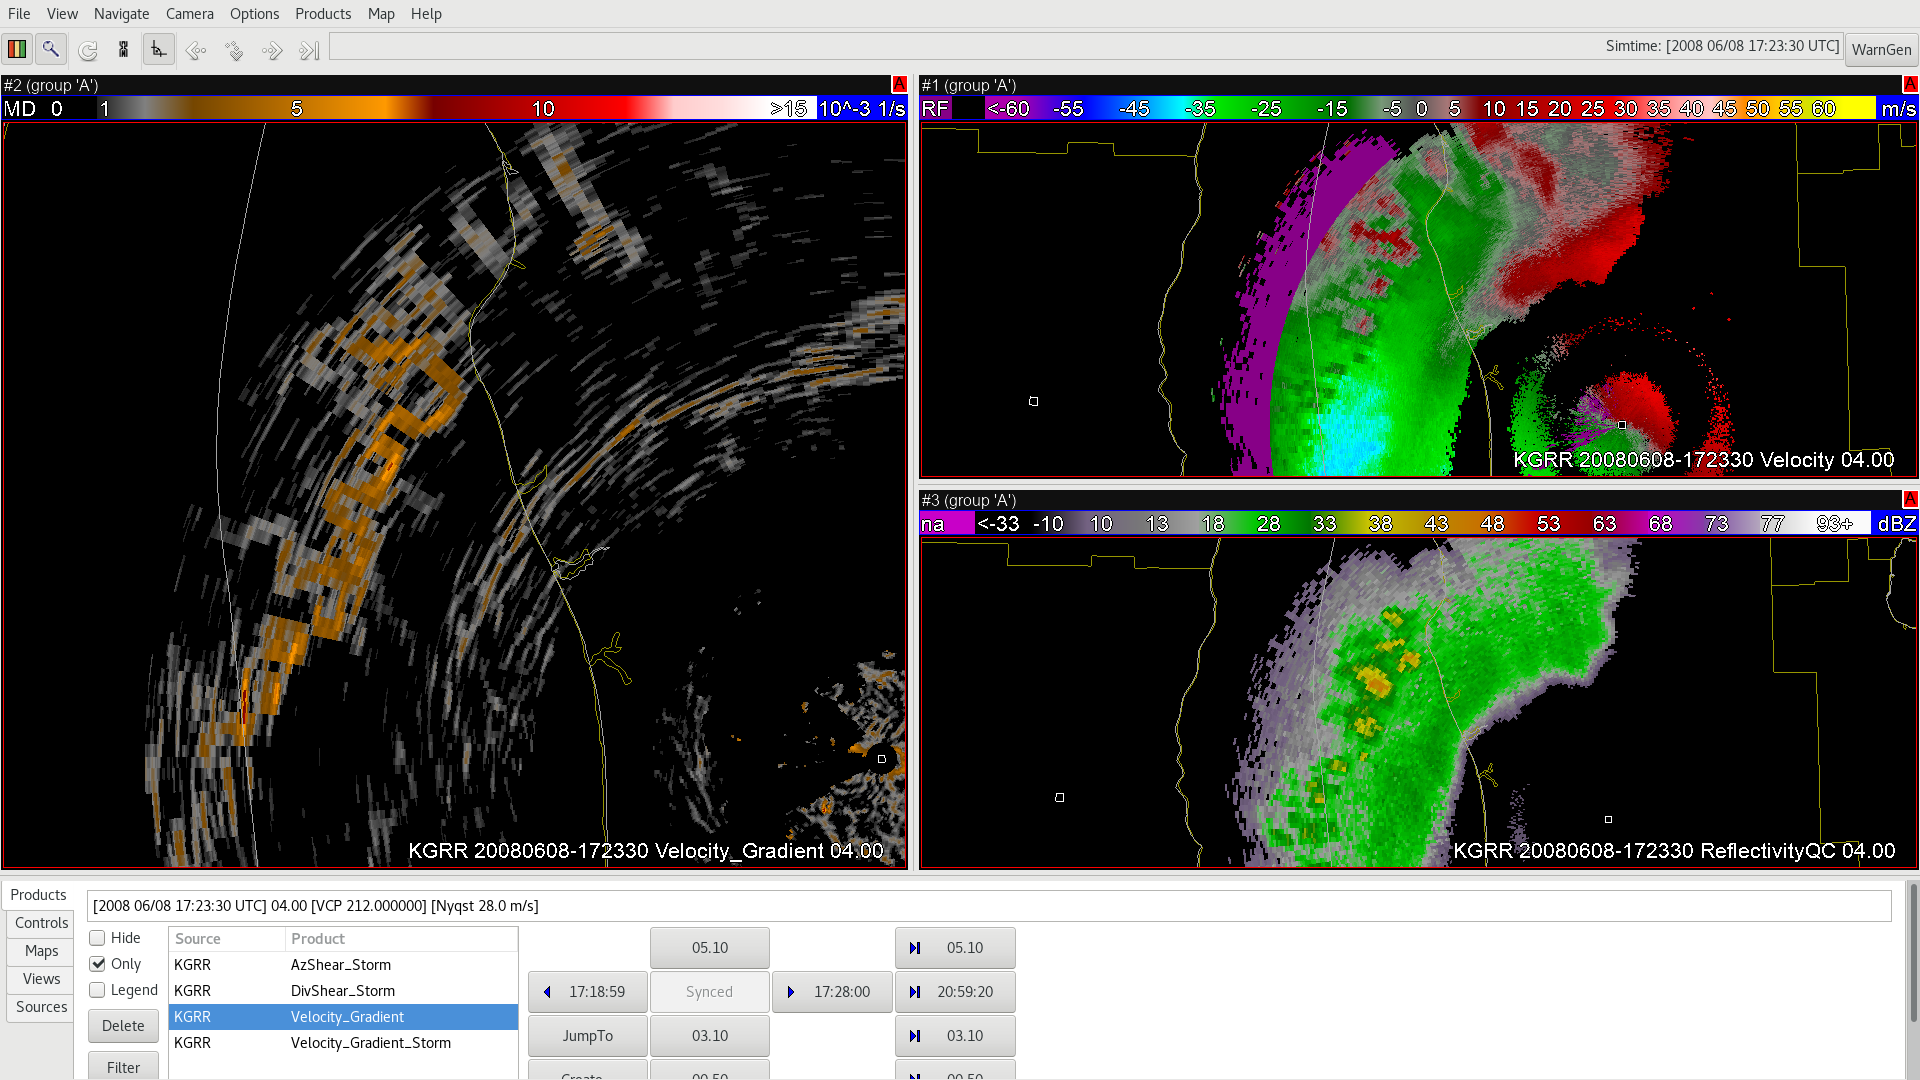
Hmm, certainly some blue negative divergence (i.e., convergence) there too. Now putting them together into Velocity Gradient…

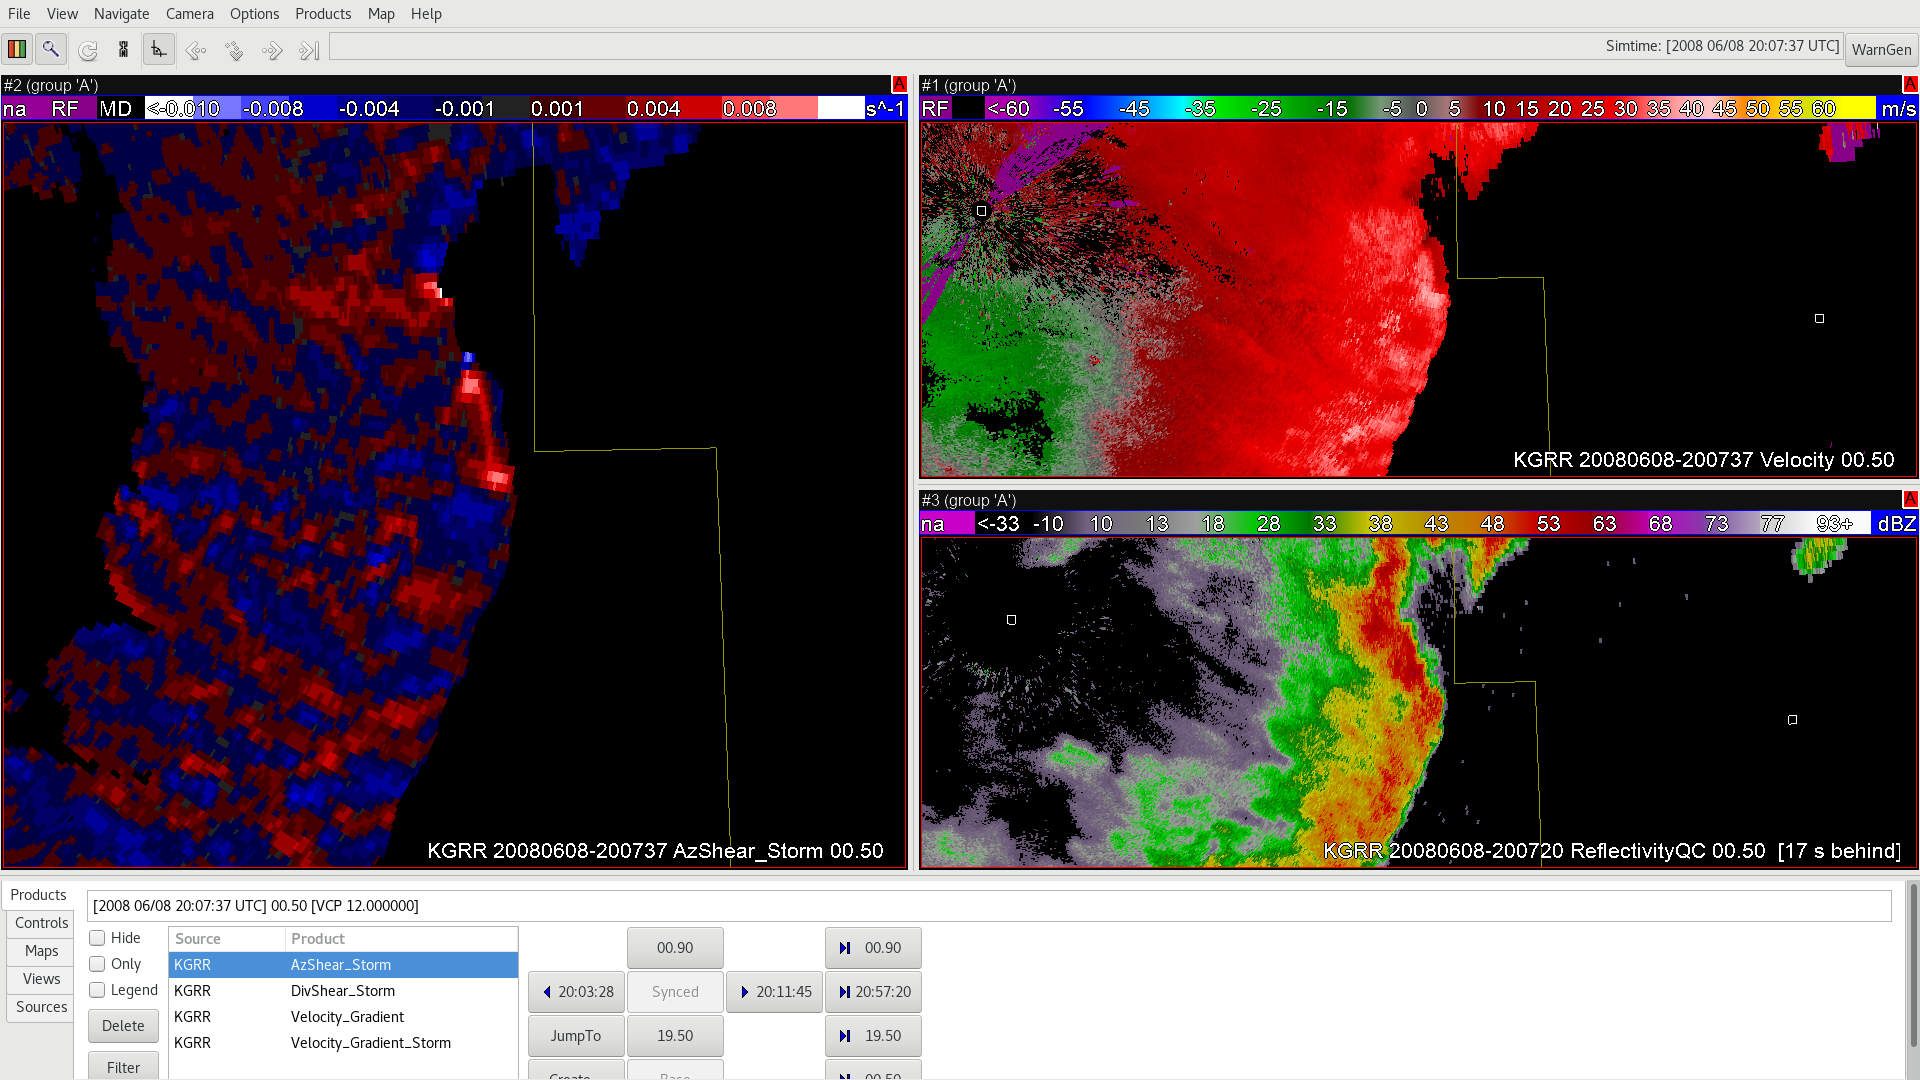
…things really really start to pop. At this point, it appears that the azimuthal shear is a bit more of a contributor than DivShear. Now looking later when the mesovortex is shifting away from the apex, starting with AzShear, we see a much less focused area…

However, DivShear has really taken up the slack here with a strong convergence signature…

Finally, again putting it all together, we see a very clear signal in the Velocity Gradient showing the best superposition of cyclonic shear and convergence (white area). This is absolutely huge for diagnosing mesovortex evolution since we often see a shifting balance between convergence and azimuthal shear and we can use something like Velocity Potential to get it all at once.

I really appreciate the efforts of Thea and others here who made this dataset available on such short notice. They also showed some examples of these products with tornadic supercells that blew my mind.

#MarfaFront


Velocity Gradient – A product that is even cooler than it sounds

What’s even better than AzShear?

AzShear + DivShear = Velocity Gradient

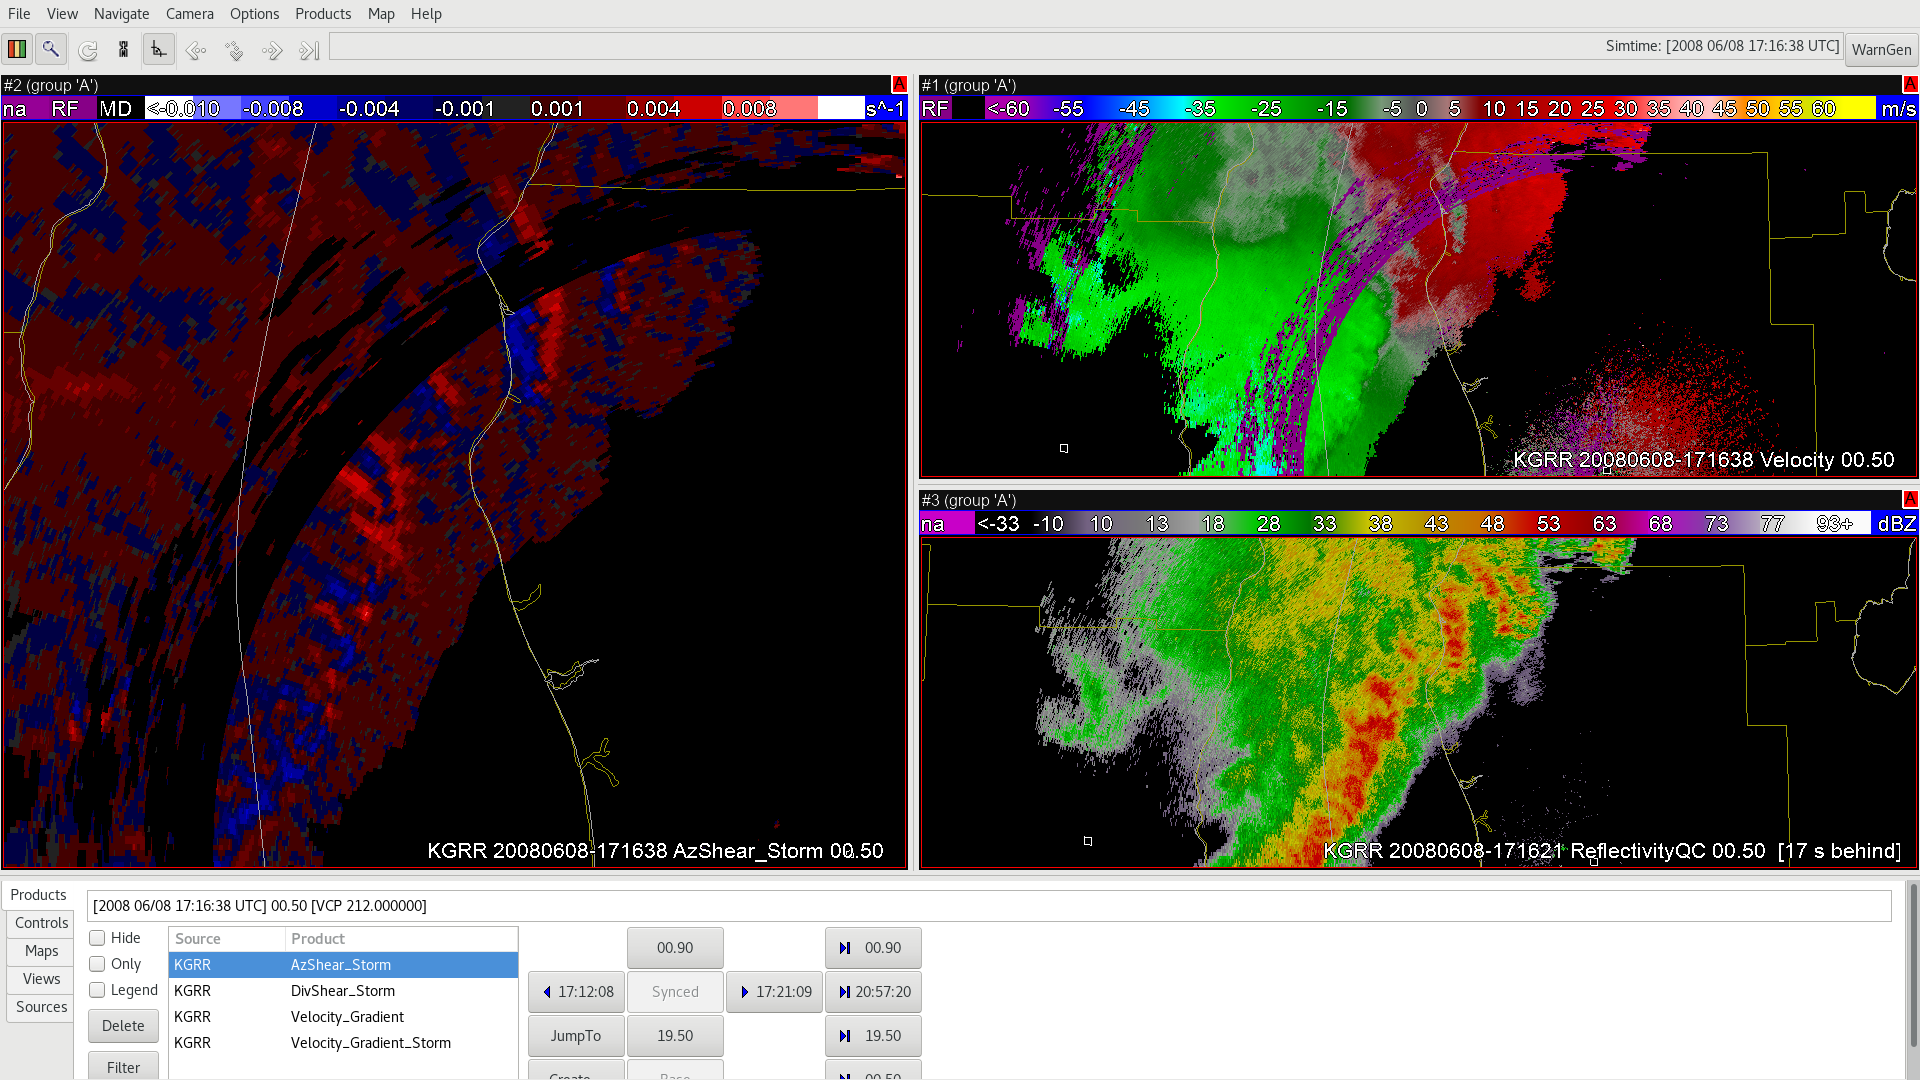
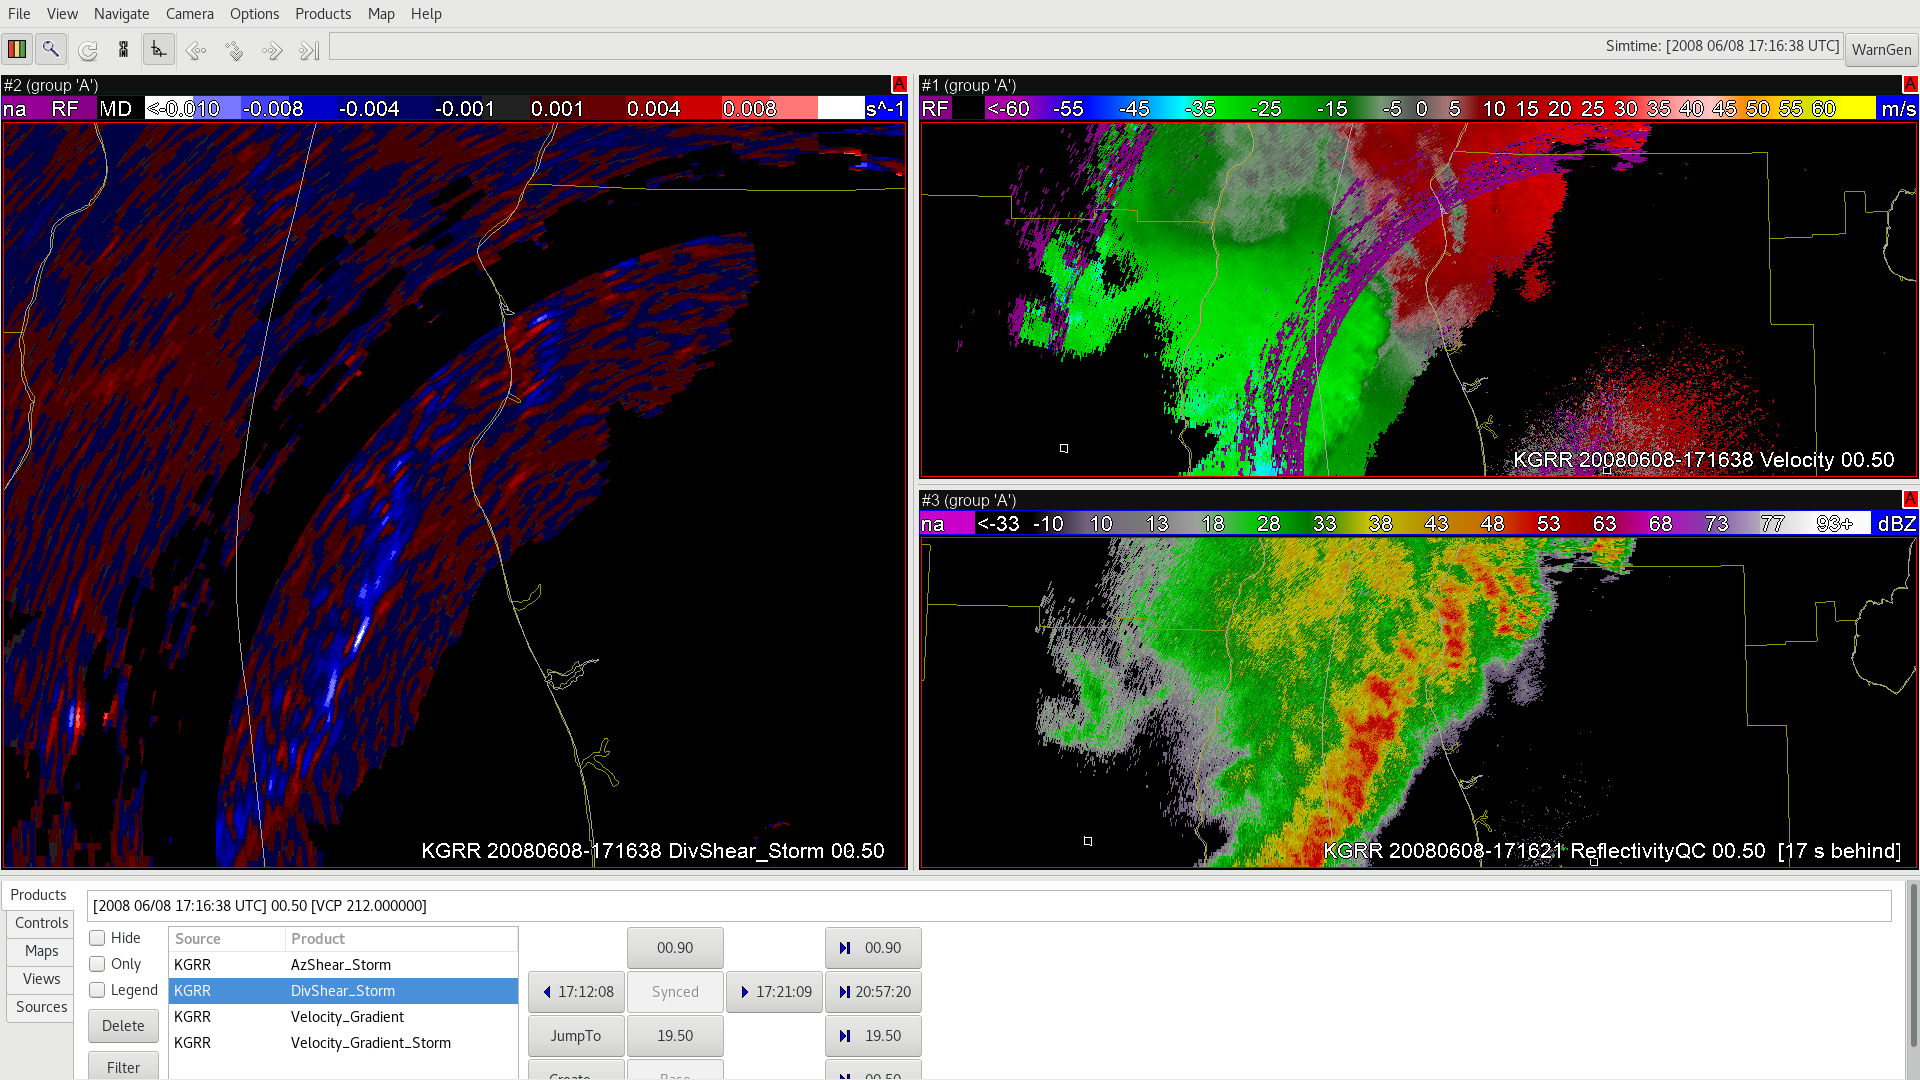
Below is a look at AzShear down low with an approaching QLCS. Fairly noisy right?

Here is another view using DivShear – in other words, divergence along a radial similar to how shear is computed across radials. The convergence (i.e., negative divergence) shows up nicely, eh?

Now combining those fields together with Velocity Gradient, things really start to jump.

Look how well DivShear works with MARCs , too:

Certainly better than AzShear when it comes to mid-level convergence…

And then putting them together for Velocity Gradient…


Now, closer to the QLCS “summit”, we see fairly coherent DivShear…

And this is how Velocity Gradient shows it.

Hoping to show some extremely cool results with these fields involving a QLCS mesovortex later in this case if time permits…

#MarfaFront

Vertical Data Smearing – the bane of AzShear’s existence

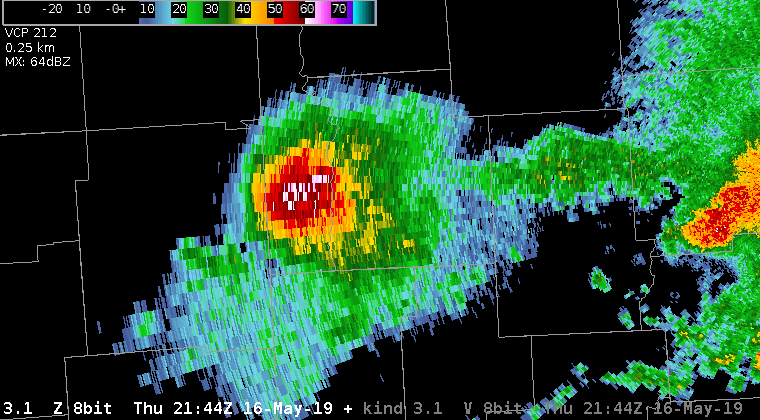
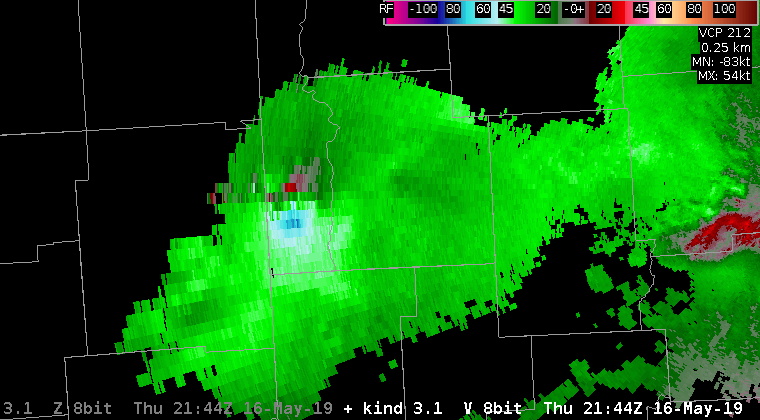
All right, maybe that’s a bit over-dramatic, but at least I got you still reading. I’ve discussed elsewhere the sensitivity we’ve seen with low level AzShear and Rotation Tracks when it comes to surface features such as outflow boundaries or artifacts such ground clutter. Here we see sensitivity to what’s going on above – i.e., velocity data with a high reflectivity mesocyclone aloft being smeared downward with sidelobe contamination. To illustrate…

KIND 3.1 degree Z
KIND 3.1 degree V
KIND 0.5 degree Z
KIND 0.5 degree V

So, it’s fairly evident that velocity is being contaminated down low. Unfortunately, this also affects the AzShear calculations…

Just something else to be aware of…

#MarfaFront

AzShear: The Good and the Bad

Low Level AzShear (0-2km) correctly identified an area of rotation associated with the western supercell, however, AzShear was also saturated above 0.01 along the leading edge of the bow echo in the MCS as well. While it’s good to drawn attention to the latter area, as it was producing severe wind (61kts), it was not tornadic.  Additionally, there is some noise in the merged LL AzShear that wouldn’t exist in the single radar AzShear. I believe single radar AzShear would perform better in this situation.

Clockwise from Top Left: KIND 0.5 Ref, 0.5 SRM, 0.5 Vel, Low Level Az Shear (0-2km)

-Tempest Sooner

My AzShear Manifesto

Those of us who use GR2Analyst already have access to AzShear via its NROT product. I stated elsewhere that the negative values are important, and here I’ll attempt to explain why.  Below is a schematic of a Rankine vortex, which is akin to a rotating cylinder. Radial velocities are maximized at the edge of the cylinder and then drop off as an inverse  function  of range.
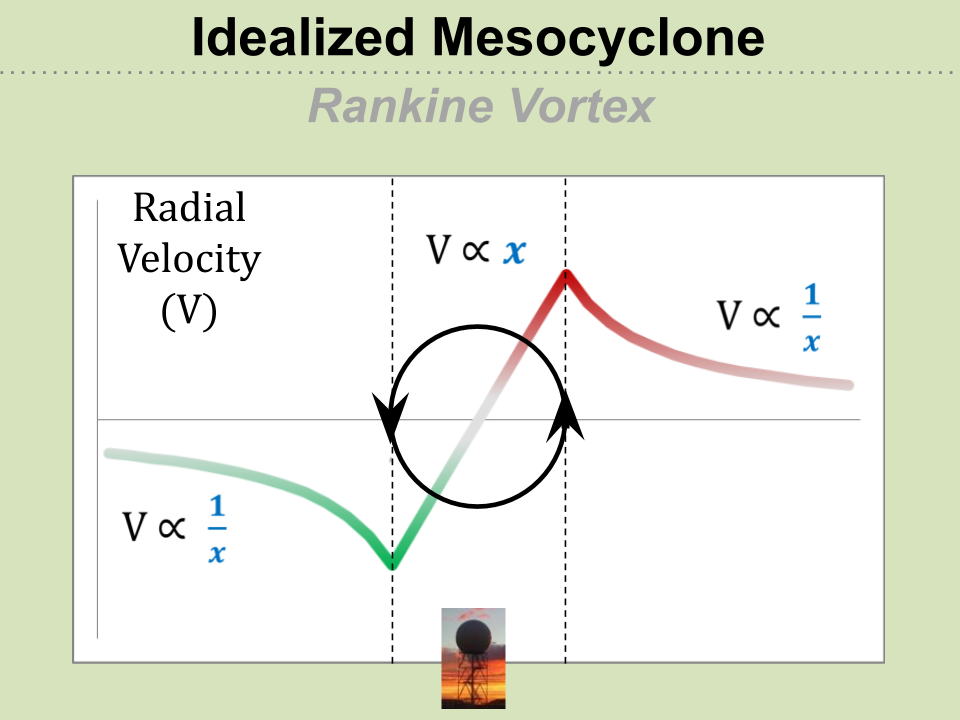
We know azimuthal shear is positive across the entire “cylinder”….
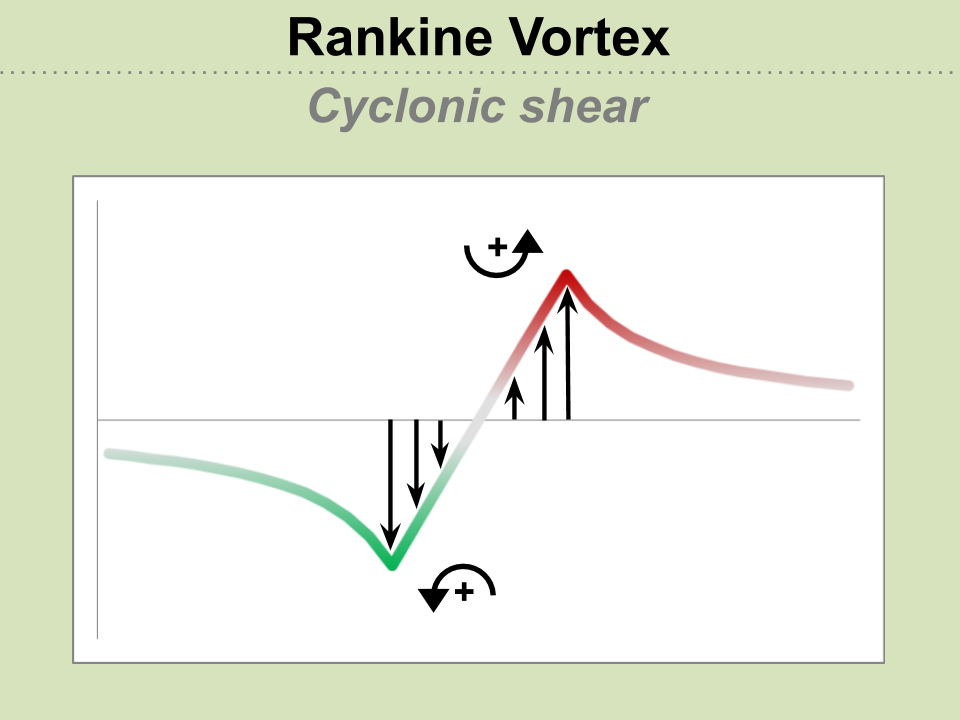
What about just outside the cylinder? If you look closely, you’ll see that there are *negative* AzShear regions on the radials that are just outside of the max/min radial velocities positions…
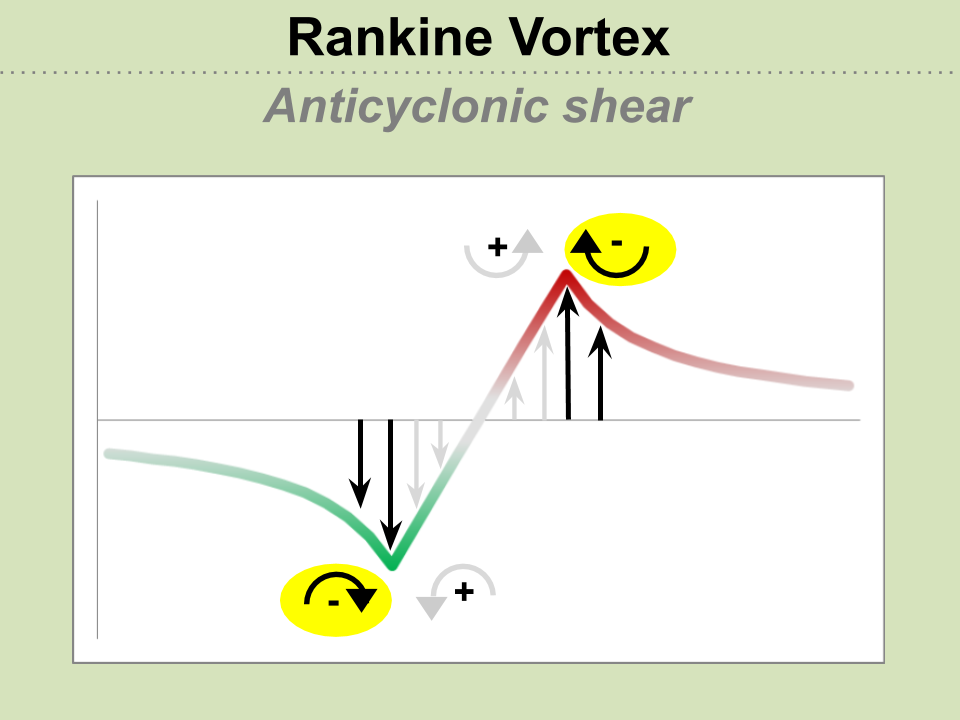
Putting it all together and thinking of azimuthal shear as a running average of shear as we move across the radials, we get a plot of AzShear that looks something like the black trace below.
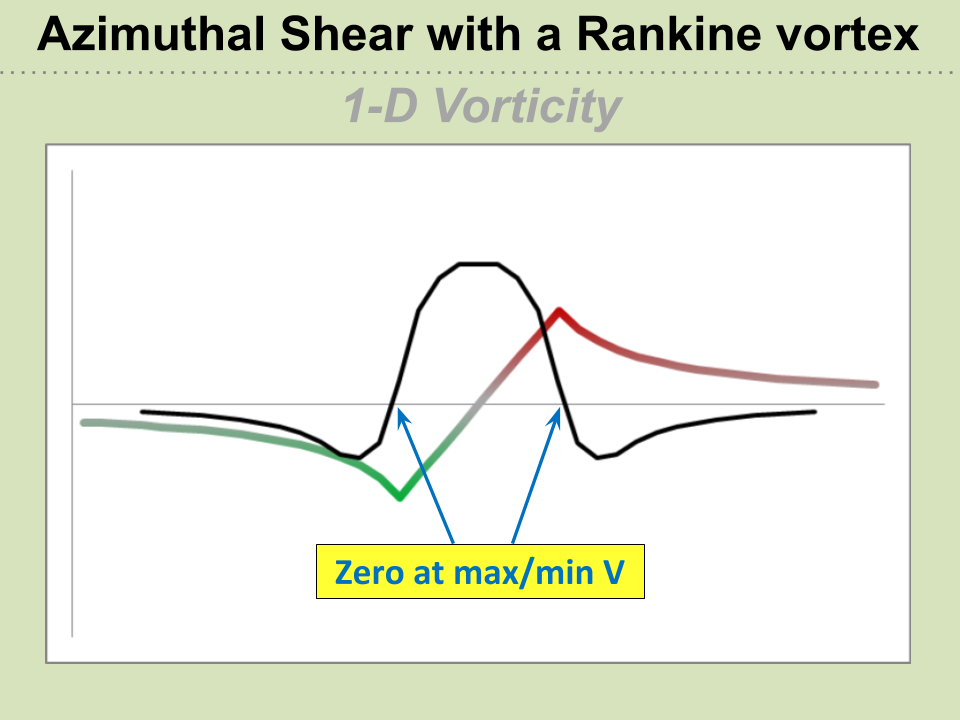
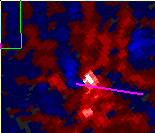
We see slightly negative AzShear regions flanking the AzShear maximum, which would be observable for a well-sampled mesocyclone, such as seen on the right hand side of the image below…
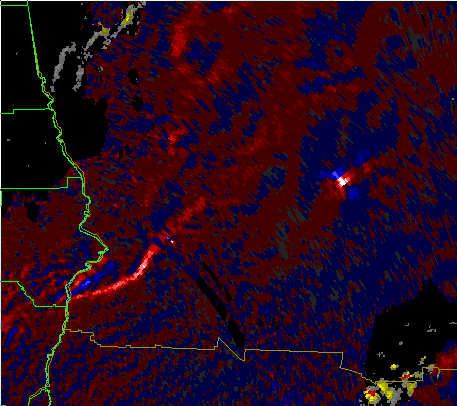
Also notice in the figure above that the maximum inbound/outbound velocities line up with where AzShear crosses zero.  Now, let’s pretend we have a rear flank downdraft or RIJ surge by boosting the “inbound” side of the circulation…
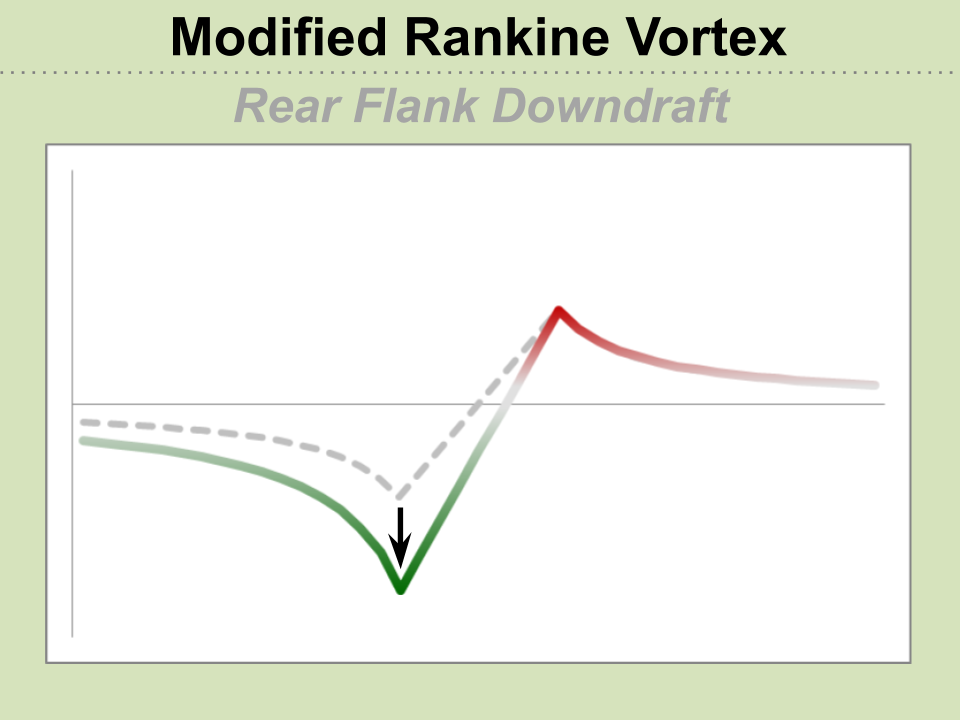
 

Now what does the new AzShear trace look like?
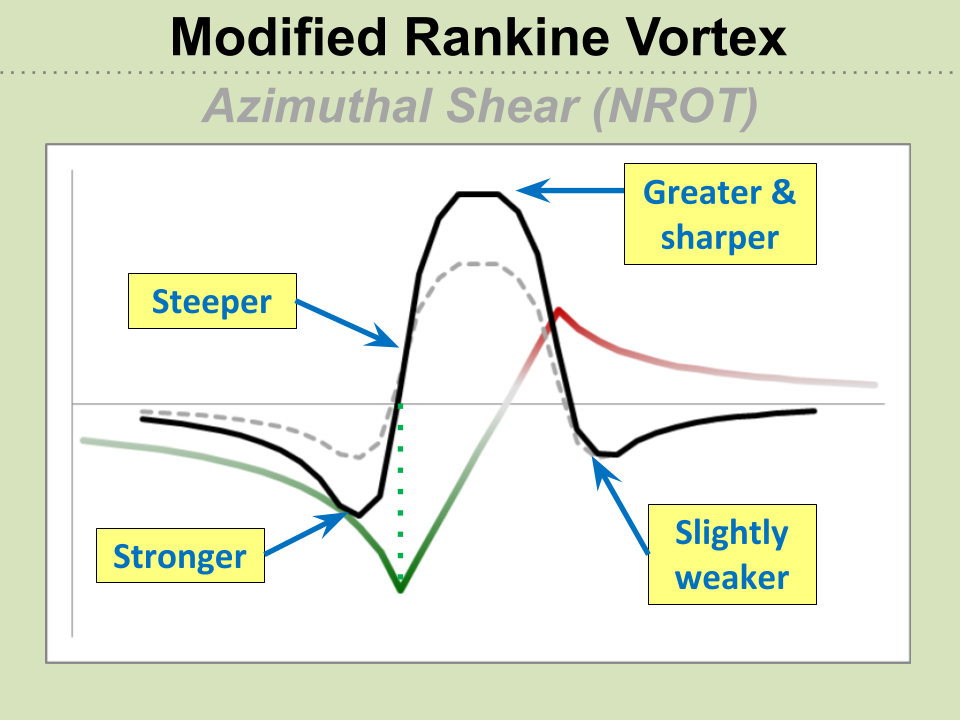
Well, we see more of an AzShear “couplet” as both positive *and* negative shear increase on either side of the surge. The maximum winds are still occurring where AzShear equals zero and this is located directly in between the AzShear maximum and AzShear minimum in conjunction with the center  the surge.

I’m firmly convinced that looking between these two features is an effective way to pinpoint where the most damaging wind will occur, whether it’s tornadic or straight-line. For the smaller tornadoes that most of us get, the southern edge of the AzShear maximum is a sweet spot that has the cumulative effects of rotation, translation, and inflow to maximize winds.

#MarfaFront