An official website of the United States government
Here’s how you know
Official websites use .gov A
.gov website belongs to an official government
organization in the United States.
Secure .gov websites use HTTPS A
lock (
) or https:// means you’ve safely connected to
the .gov website. Share sensitive information only on official,
secure websites.
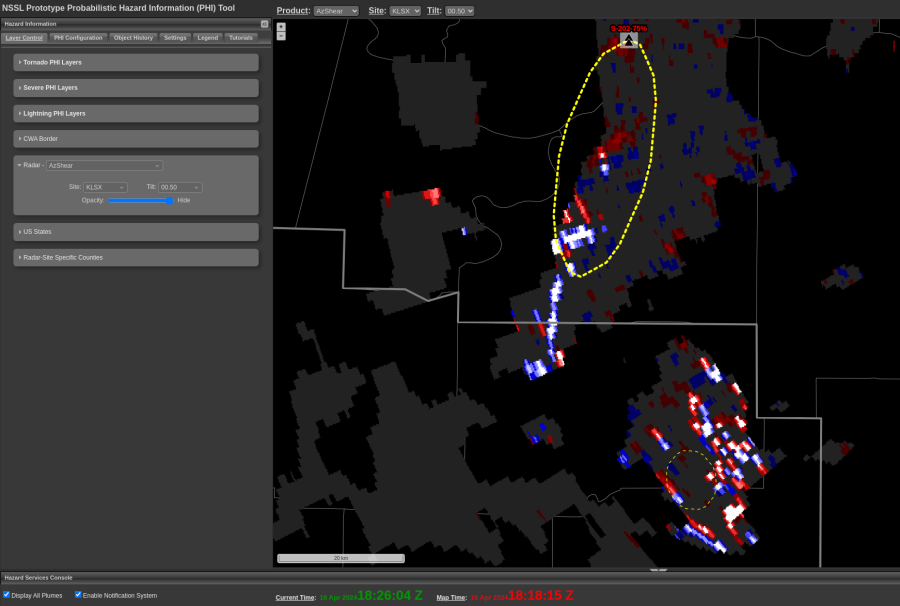
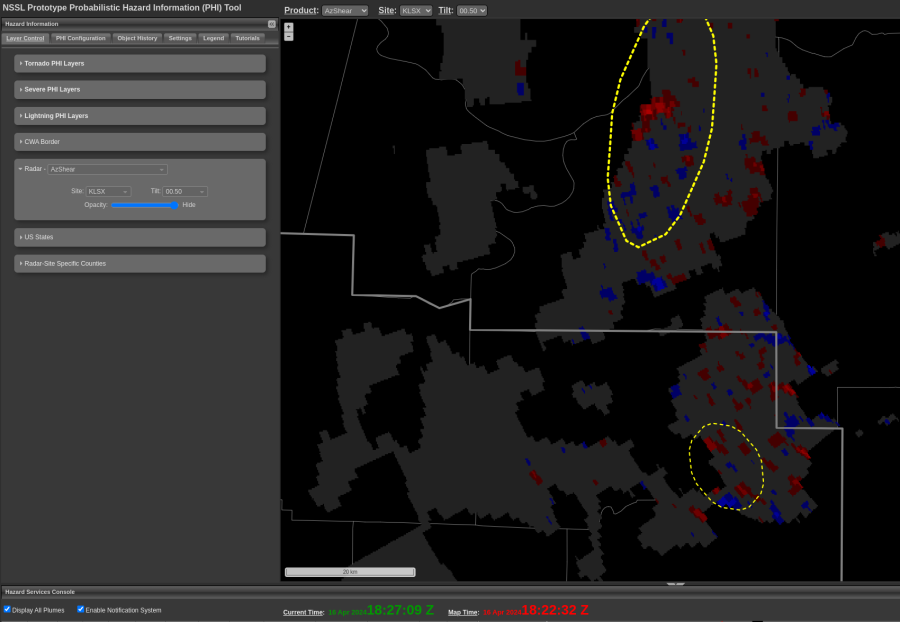
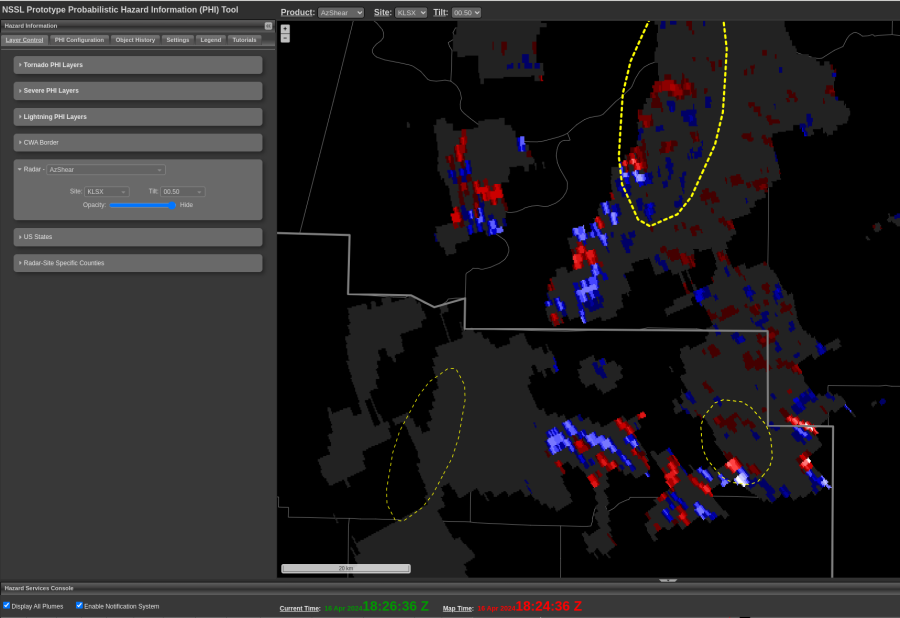
Collection of AzShear images from KLSX between 1818-1824 UTC. Values appear to “flash” from unrealistically high to low values (given background environmental assessment) over successive images. No obvious DA issues in base data/velocity during this period. Radial range from KLSX was ~90-100 km. The most notable instance of this occurred to the southwest of the KLSX RDA. -QLCS
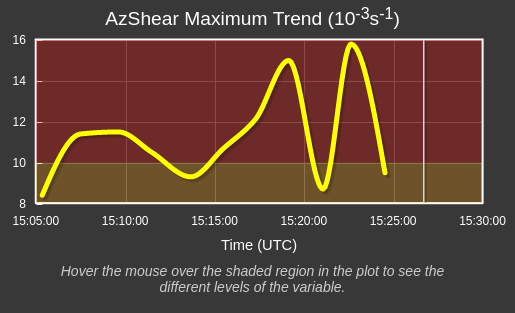
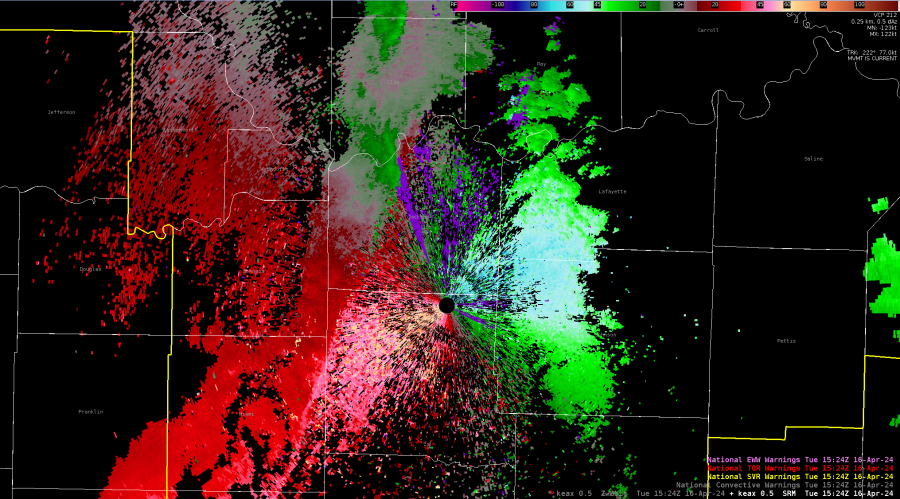
With a storm in close proximity (~20 miles) to the KEAX radar, AzShear had some rather large jumps in maximum values. The data was pretty noisy due to the proximity to the radar, so the rapid change in AzShear makes sense in this case.
After looking at the base velocity data, it looks like to drop off of the max AzShear had to do with range folding or bad radar data close to the radar. When the range folding affected the couplet pasing to the NNW of the radar, AzShear dramatically dropped off in response.
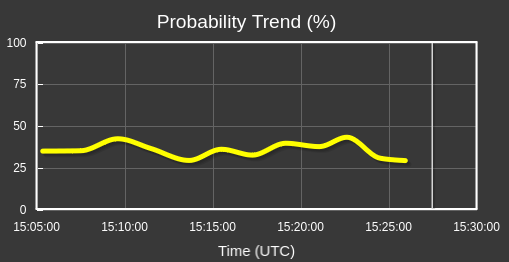
TORP also displayed various jumps as well in response to the variance in AzShear, but was way more tamed than the AzShear. This is good to see that there is not as much variability in TORP even with the jumps in AzShear as AzShear is the top parameter TORP relies on. This could be confusing if TORP jumps back and forth from 20% and 60% (just throwing out numbers), so it is good to see it’s more smooth than the jumps in AzShear.
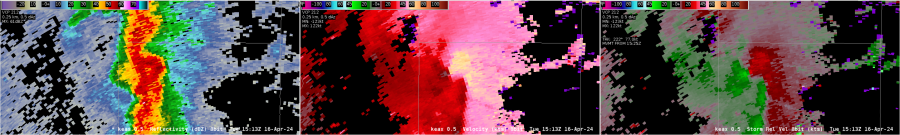
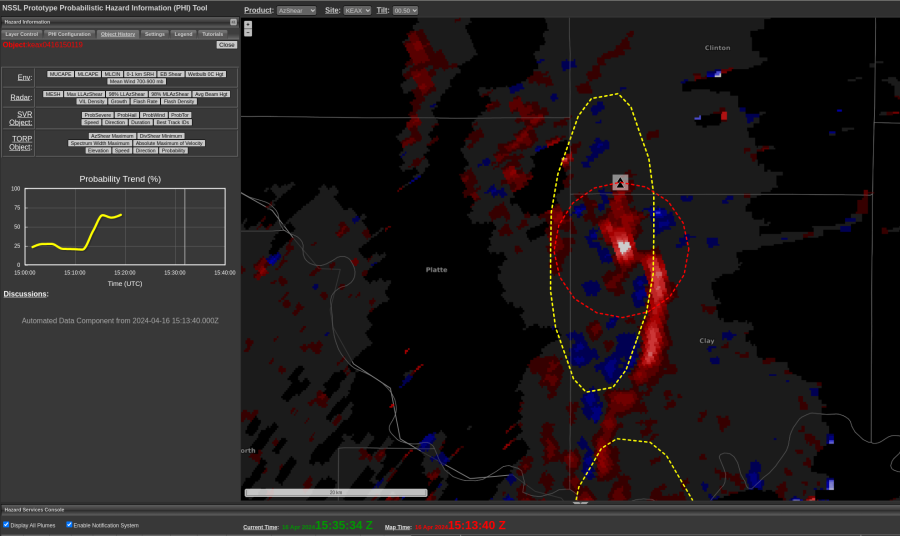
From 1500-1515 UTC, a brief increase in organization and rotational increase occurred along a broad shear zone in Clay County, Missouri. Eventually, a rather pronounced cyclonic convergence signature appeared at the north side of the convergence zone, with TOR warning consideration made. However, despite prolonged period of critical AzShear threshold values met, TORP was slower to respond, and by time values spiked towards relative maximum (~65%) for this event, the signature had abated from a base data perspective. -QLCS
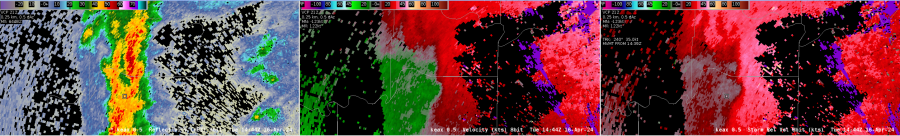
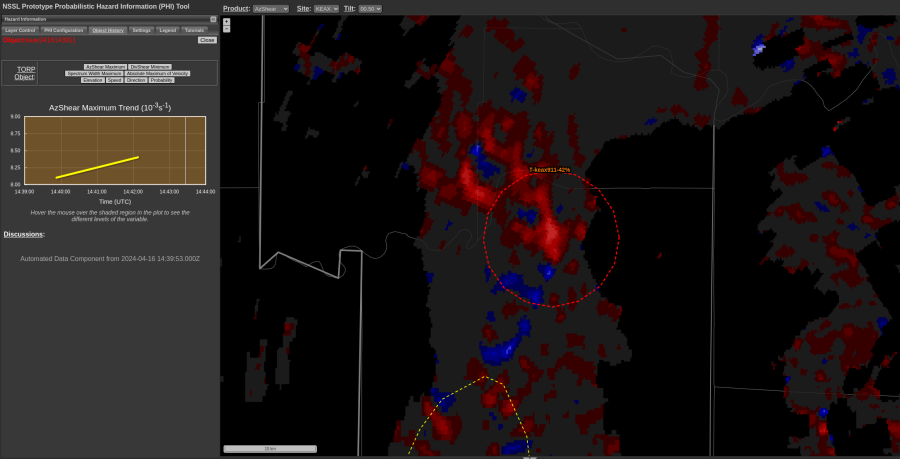
Around 1445 UTC Tuesday, with evidence of weak cyclonic convergence from base data/KEAX (top), a TORP object (~40%) was generated. This occurred despite AzShear remaining below critical threshold. The cyclonic signature on base data/SRM weakened over subsequent scans, and the TORP object ended. In early days of the experiment, I have been using ~40% as a baseline threshold for TORP situational awareness. Will continue to assess if similar instances occur, requiring a shift in baseline TORP percentage. -QLCS
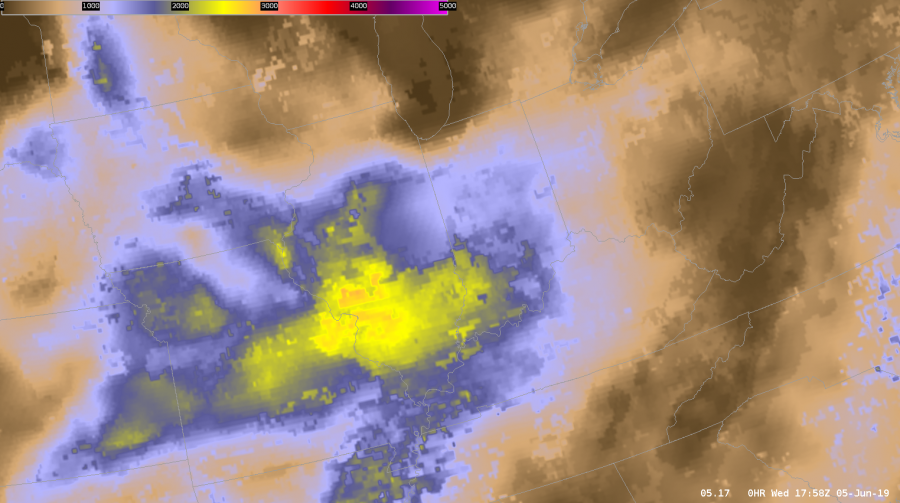
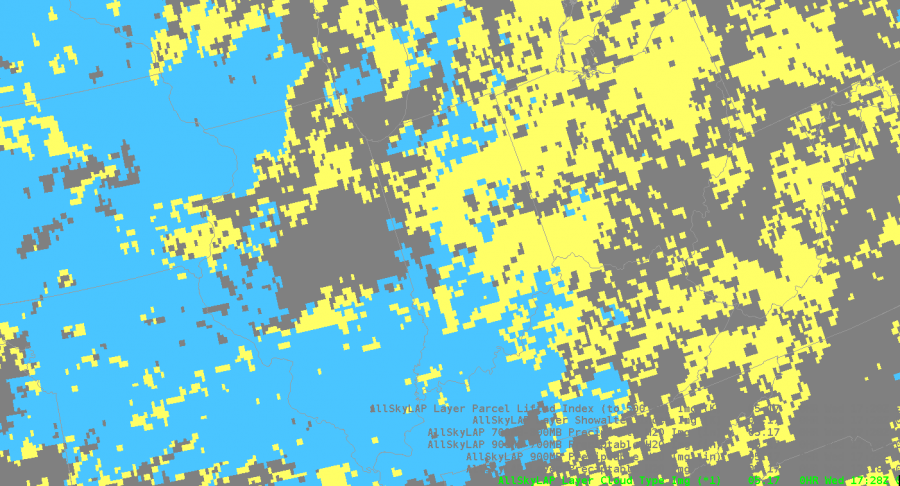
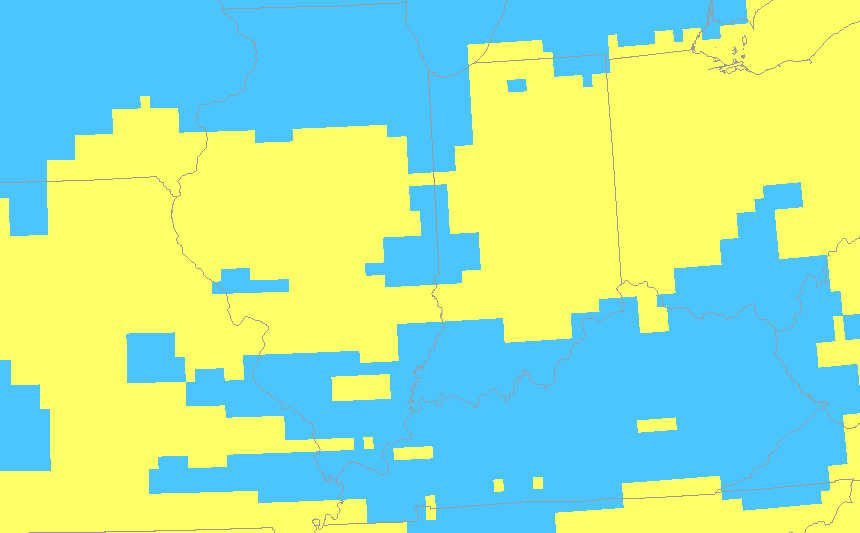
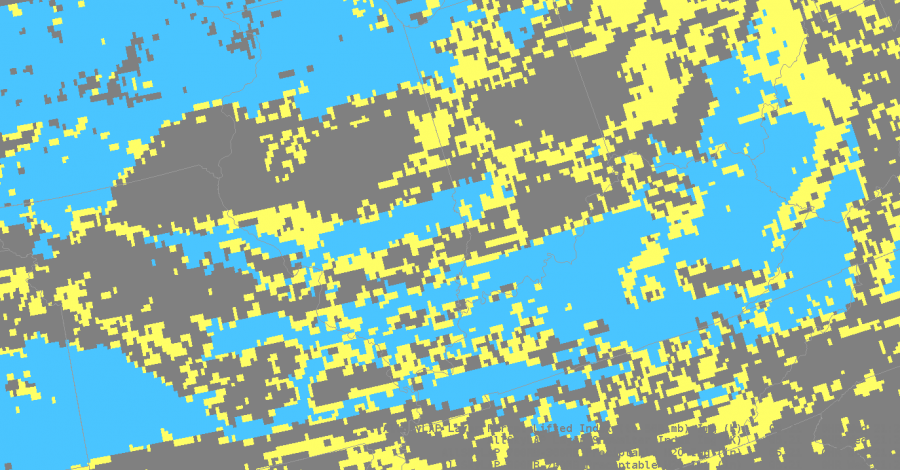
Right now I’m analyzing the various new products to nowcast where and when storms will intensify. Currently I’m comparing ALLsky cape to the mesoanalysis from the spc. Right now the mesoanalysis is higher with cape compared to allsky. Over our area the it’s cloudy so the it’s taking data from the GFS.
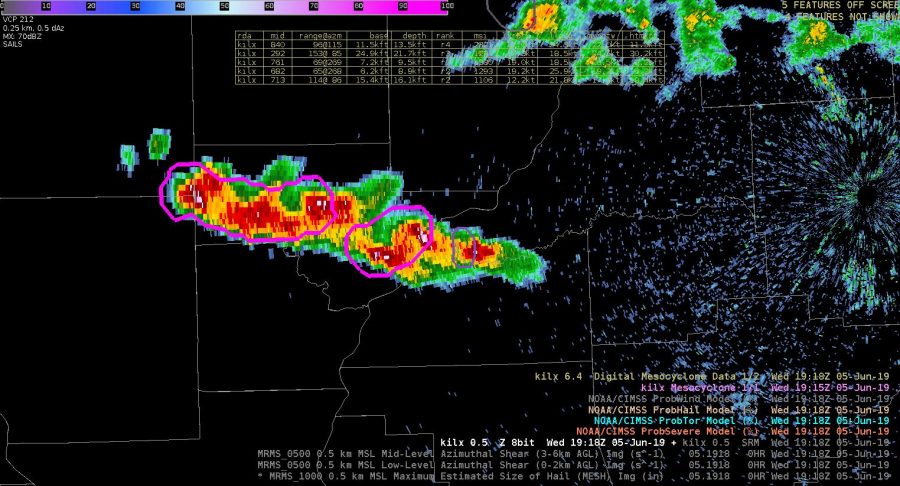
A cell in our western counties ramped up very quickly while our computers were down. Prob severe immediately directed our eye to the cell. The probsevere lined up with an uptick in vil values and velocity.
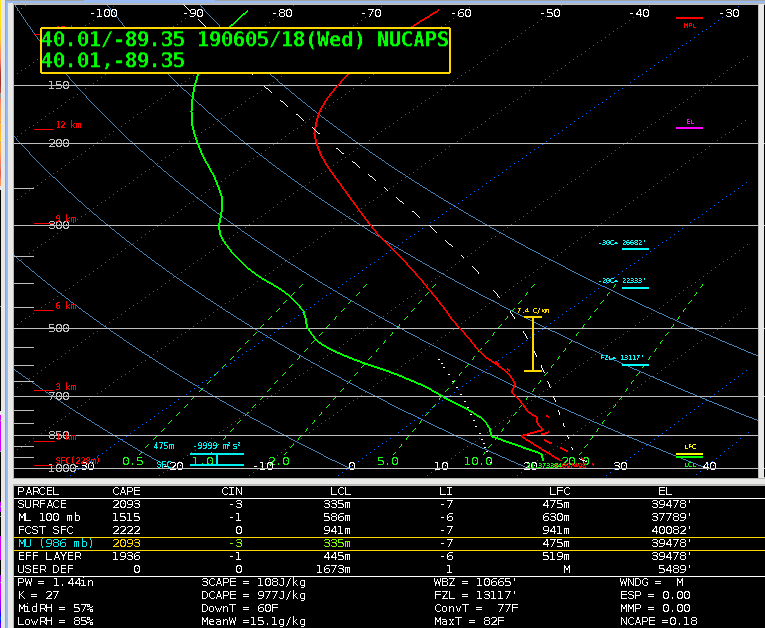
I’m comparing the actual sounding to what’s shown on nucaps, and allsky to see what’s initializing the best. The actual sounding shows 3025kj of surface lavyer cape and 1453 of mixed layer.
Around the same time allsky shows a similar value of cape.
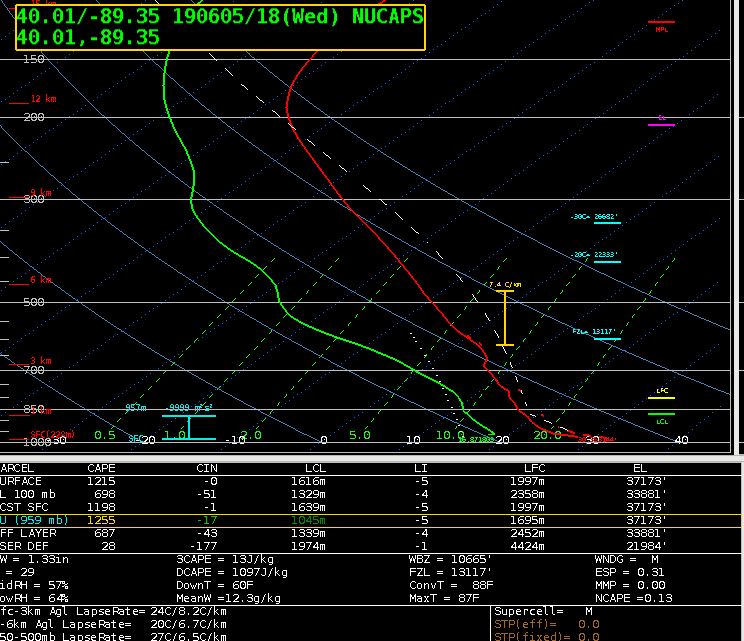
The modified sounding was closest to the actual sounding with 1515kj of mixed layer cape
The nonmodified sounding is much lower when it comes to mixed layer and surface cape. In the case the modified sounding was more reliable and gave a more accurate picture of the current state of the atmosphere.
The all sky cape was much higher, around 2300kj.
That increase might be due to the fact that the sampled area of interest was filled in by the GFS. Whatever input the GFS was taking into might have lead to it overestimating the amount of CAPE.
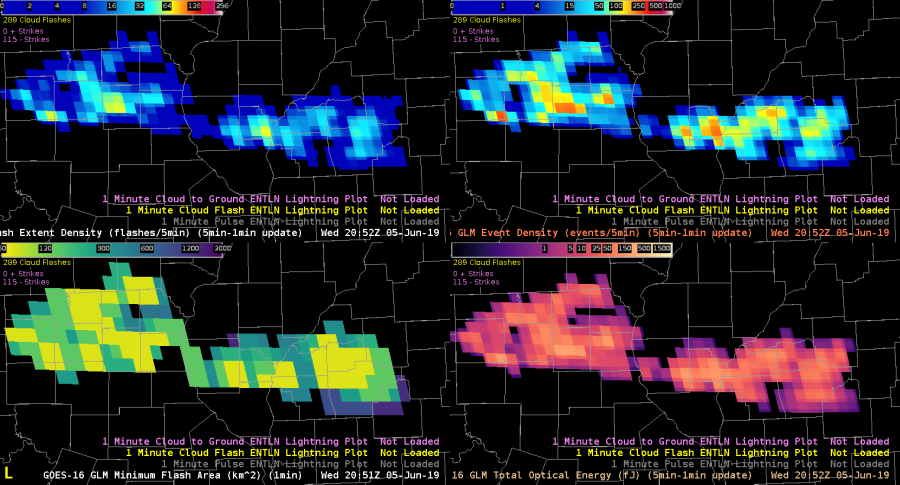
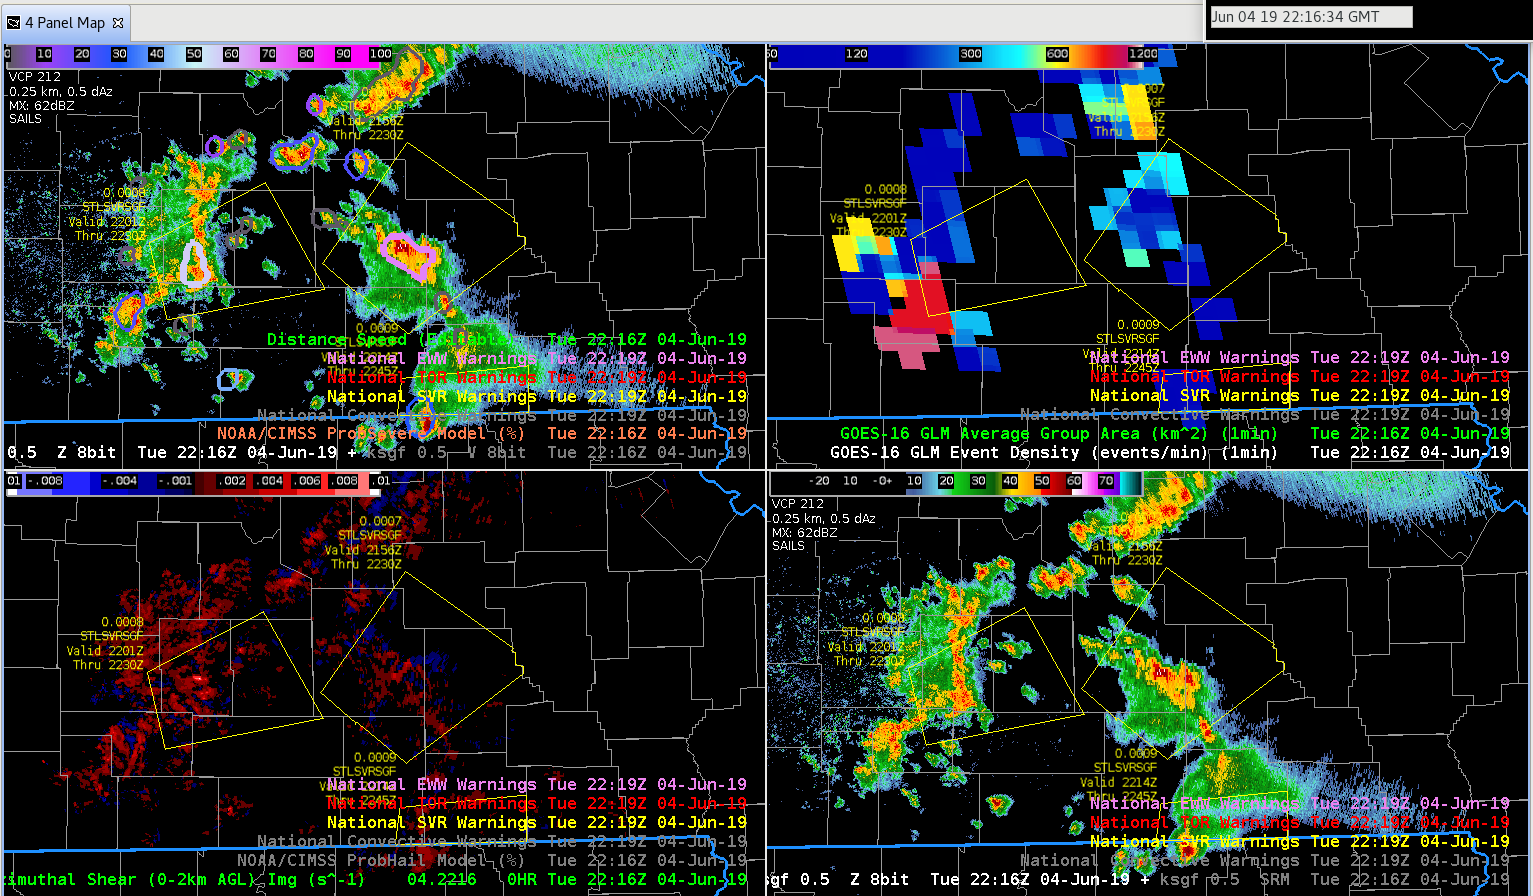
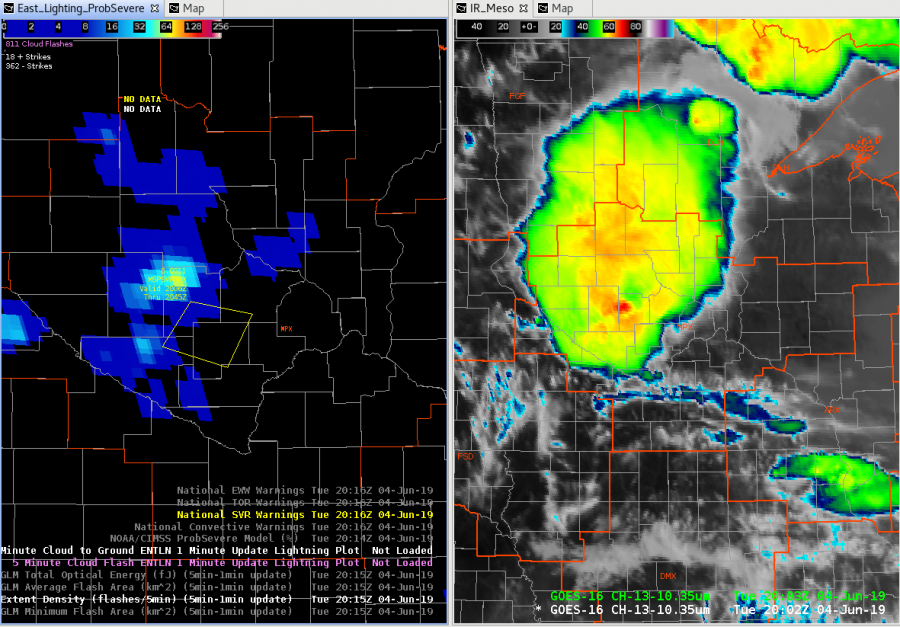
I’m also looking at GLM products to see trends with convection. The combination of event density and GLM minimum flash area help me to see the rapidly growing updrafts as well as cell that are producing hail. That’s the case right now. My warned cell is producing penny size hail.
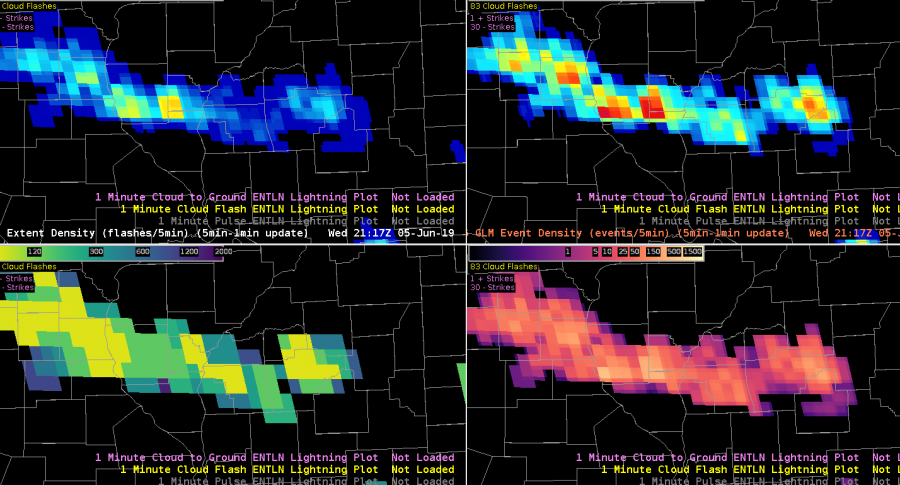
About an hour later the FED Is starting to pick up on longer flashes, but the event density is still showing higher values. The lines up with satellite which shows overshooting tops, but storms are overall keeping their intensity. The overall trend combined with looking at stability indices aids me in nowcasting that storms will at least maintain their strength over the next hour or so.
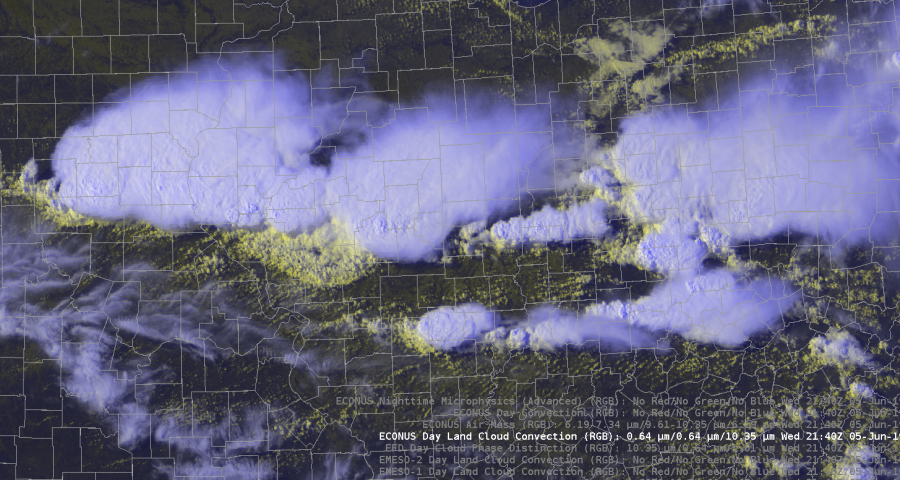
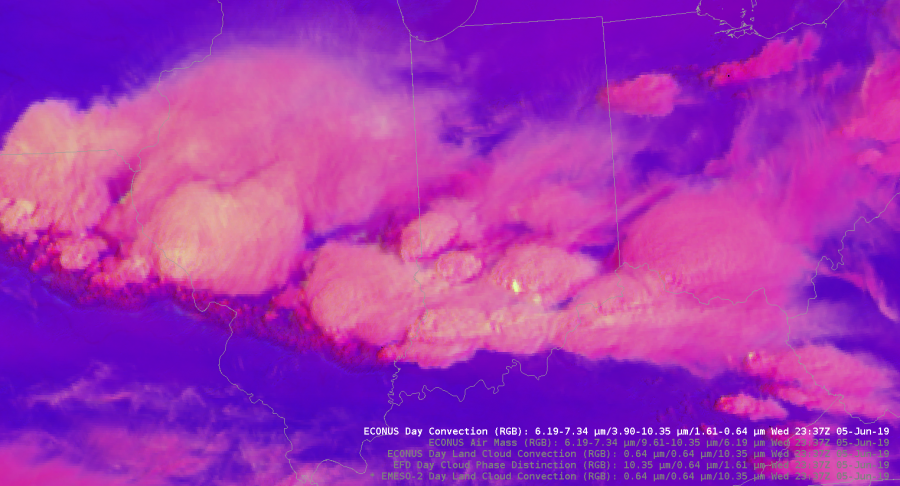
The Day Land Cloud convection RGB was helpful in analyzing different cloud tops. The color scale highlighted the thin cirrus compared to the lower thick clouds. It also dipicted the outflow boundary from our southern storms very well. It gives much more detail to the cloud types compared to the visible satellite.
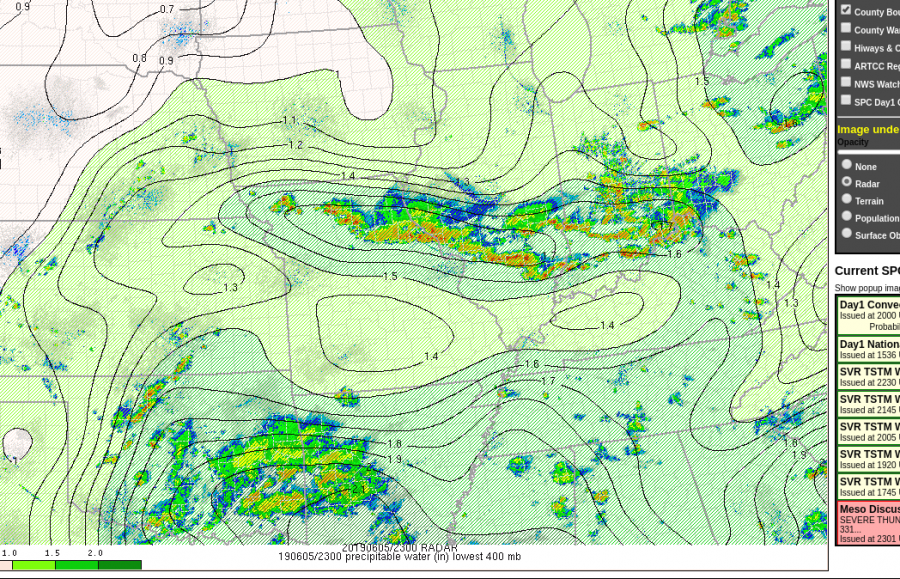
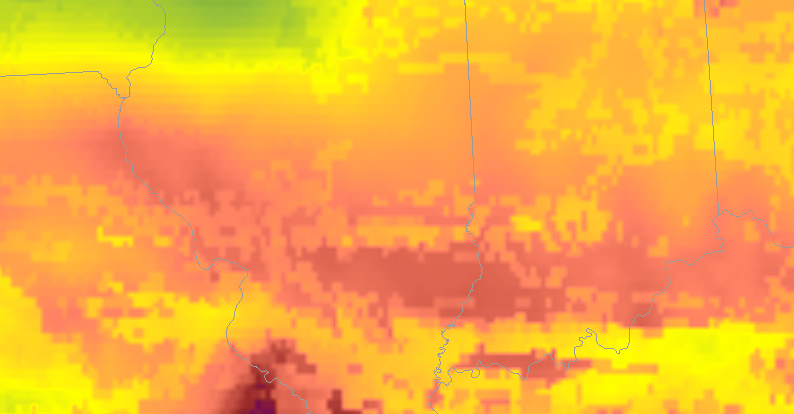
Today I also got the chance to analyze and compare the merged TPW precipital water with the allsky.
During the afternoon the PW values stayed fairly steady across the northern half of the state while moisture increased in southern Illinois.
The TPW decreased PWATS to close to 1 inch as storms moved through. T
That data was sampled in a cloudy environment.
Meanwhile, the AllSky does show a decrease in PWATS but’s farther north compared to what actually happened. That data was pulled from the GFS since it was in a cloudy location. It was helpful to see how each product performed in this environment. It’s nice to have access to both in order to see which one has the best handle of the current atmosphere. That initialization helps me monitor trends and nowcast.
As storms moved south out of my DMA I used Day convection RGB just to monitor growing cells. It was clear to see the strongest storms because they had the bright yellow maxes.
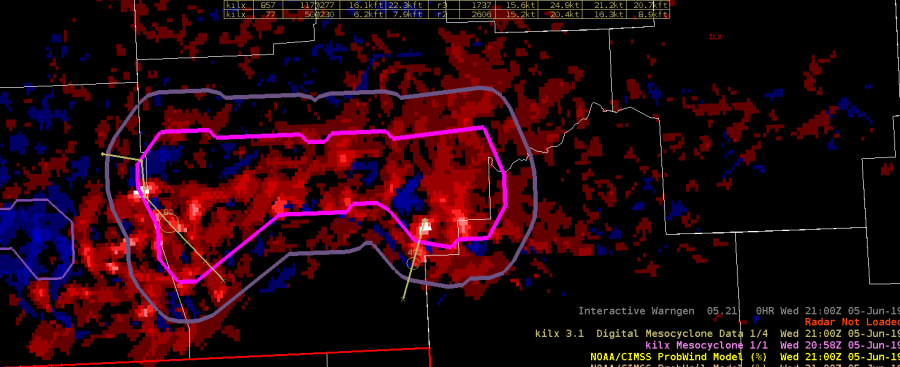
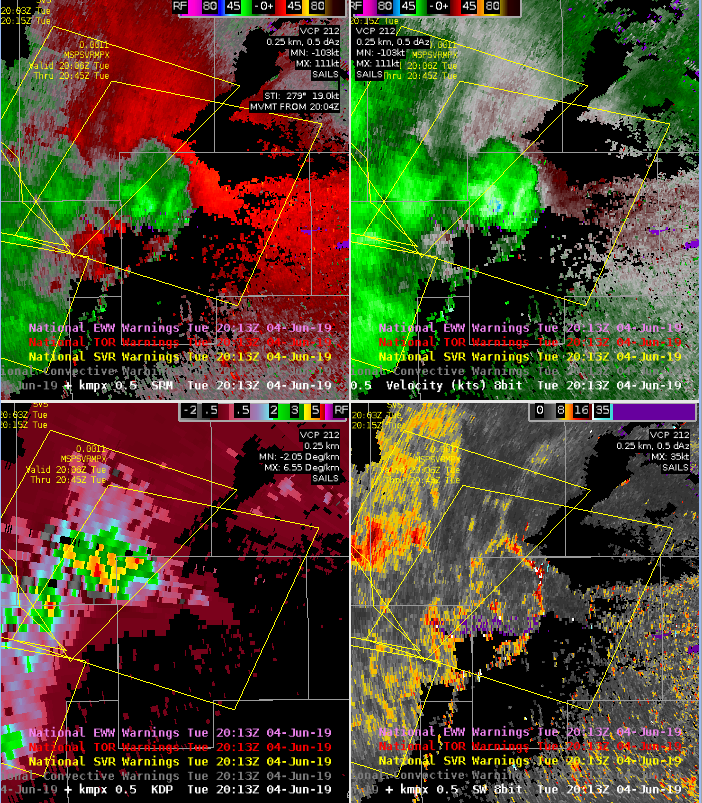
Earlier in the day was able to compare NMDA with the low level azshear. Tornadoes were’t a major threat, but the NMDA did line up with peak areas of Azshear. That storm did produce wind damage, and strong wind gusts.
While monitoring convection across southern Missouri, the merged AzShear and ProbSevere have been great tools in diagnosing the primary severe threats: wind and hail.
AzShear has shown a few areas higher in shear, yet the ProbTor has been very low and V data has been unconvincing of the presence or threat of a tornado. ProbSevere has been useful in indicating the severe storm hazards that would be the most probable, and when compared with other data: GLM event density / avg group area, and V data, I’ve been able to issued warnings with higher confidence. GLM data will be increasingly useful with better understanding of what the different data sets mean in relation to convective development or decay.
Lightning on FED starting to go up again, right as cell with rotation starts to meet up with east-west oriented boundary to the east of that cell (see bottom right spectrum width product).
AzShear product following that rotation over time well…watching for increase in intensity there.
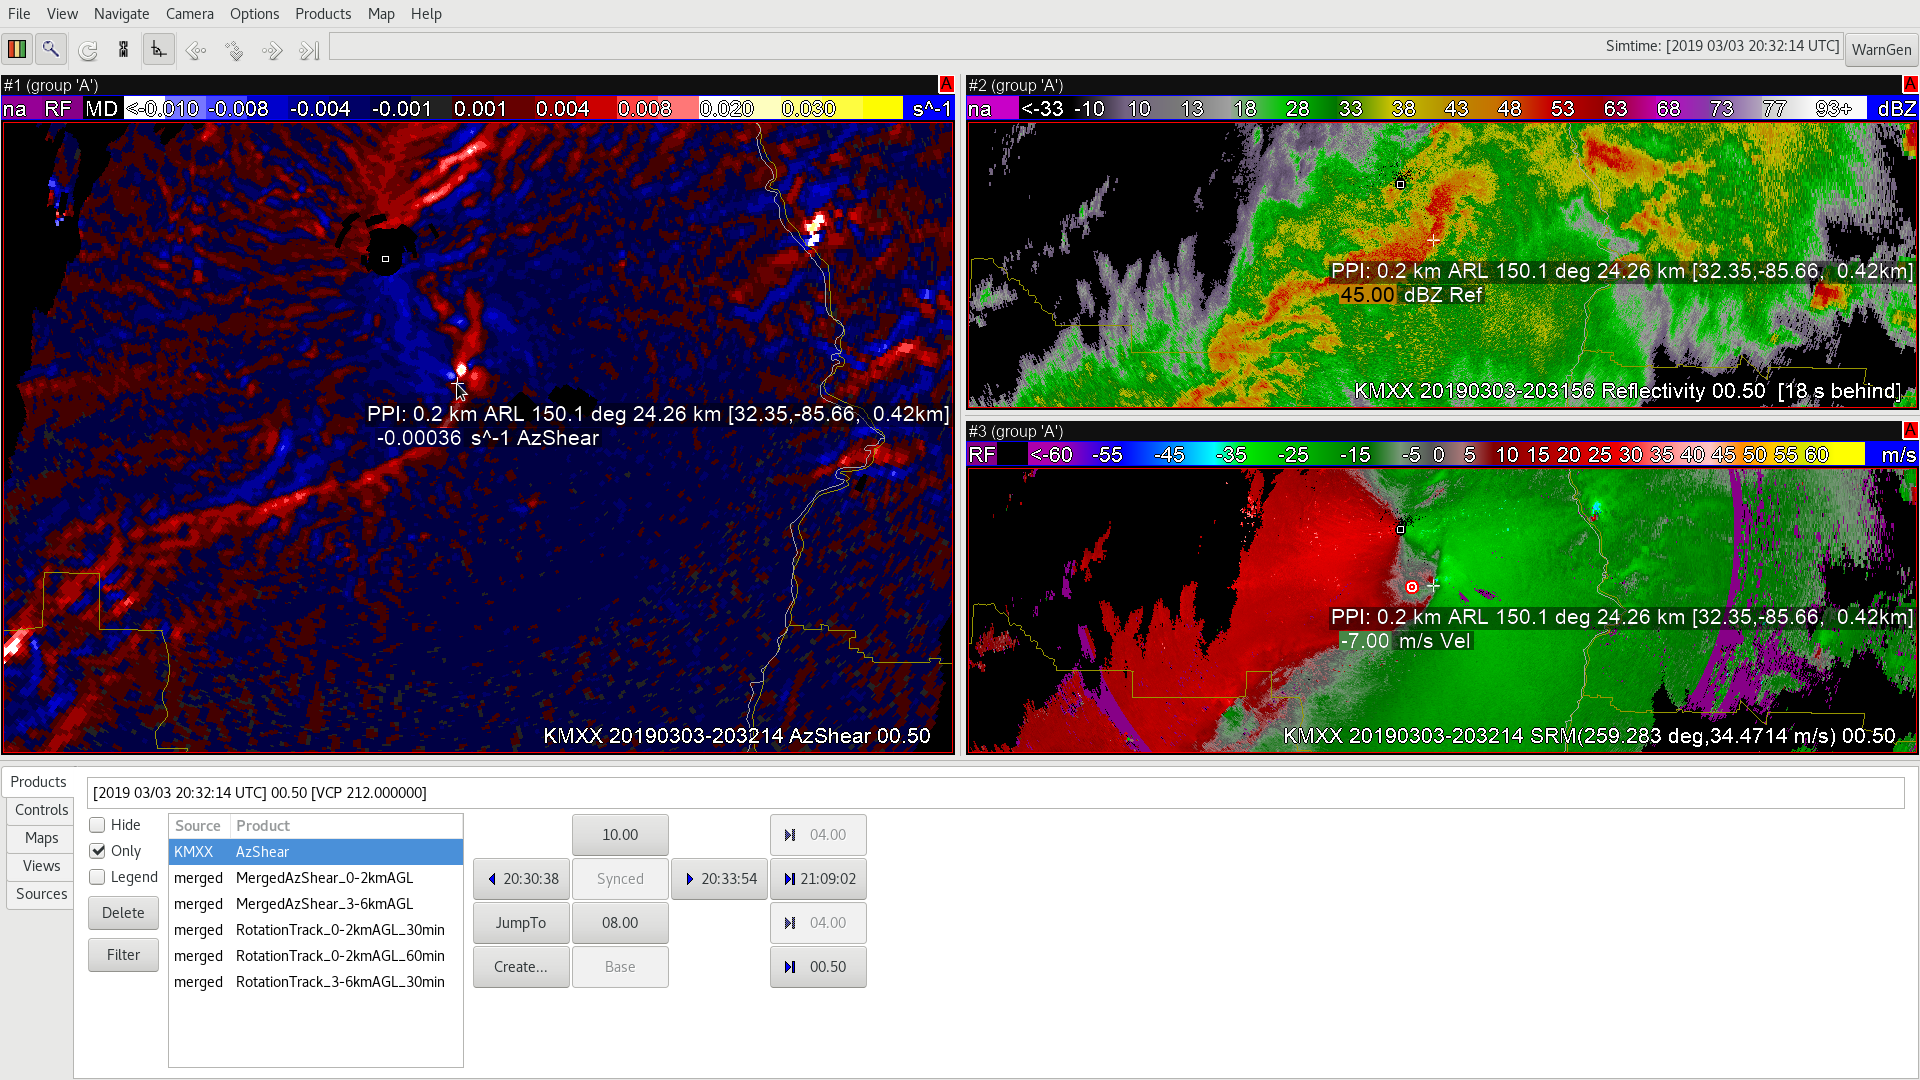
Today’s case focuses on the March 3rd Eastern AL/Western GA AzShear Case, with the goal of evaluating the use of single radar AzShear and two merged AzShear products (i.e. 0-2km and 3 0 6km AGL).
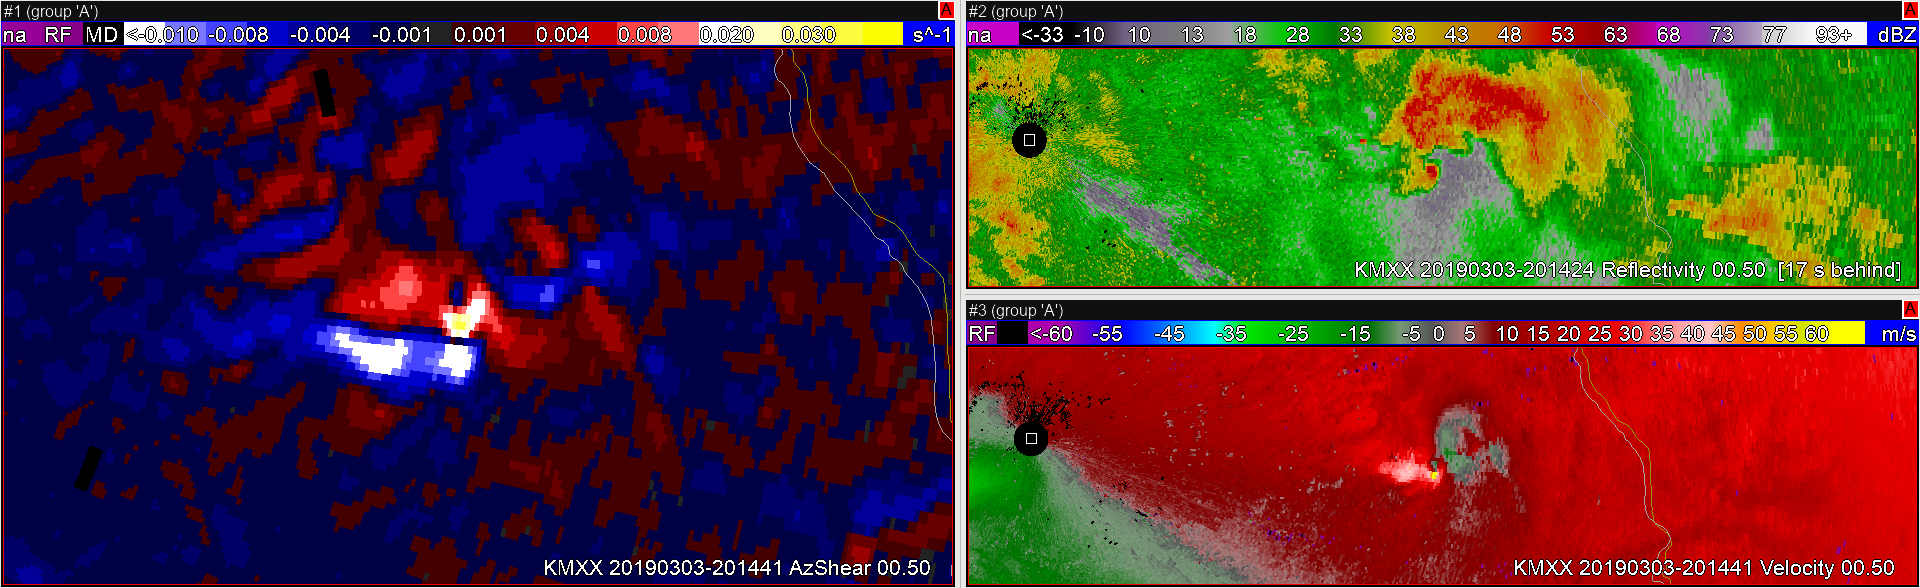
The first tornadic event was a semi-discrete supercell located out ahead of a developing QLCS type storm. Pictured (Left) is the single-radar AzShear product at the 0.5 degree slice, (Top Right) base reflectivity and the 0.5 degree slice, (Bottom Right) in the base velocity at 0.5 degree slice.
The first, more discrete cell, in the event was very noticeable in the single-radar AzShear product, with pretty persistence high values (0.02 to 0.035 S^-1) evident throughout the eventual life-span of the tornado once overlaying the post-event analysis track. It did seem to become slightly more muted as the storm progressed further east (85km from the radar site), although, to its credit, the AzShear product looked more pronounced than the BV product at said magnitude from the radar site. From a warning forecasters point of view, if just using BV, this would become a benefit of the product, however, a quick conversion and/or use of SRM fixed this issue quickly on my end. More on distance…The product, similar to it’s ingested data, did seem to get displaced a bit once the feature progressed over 100km downstream of the radar beam, no longer matching up with the post-event analyzed damage survey track (example below).
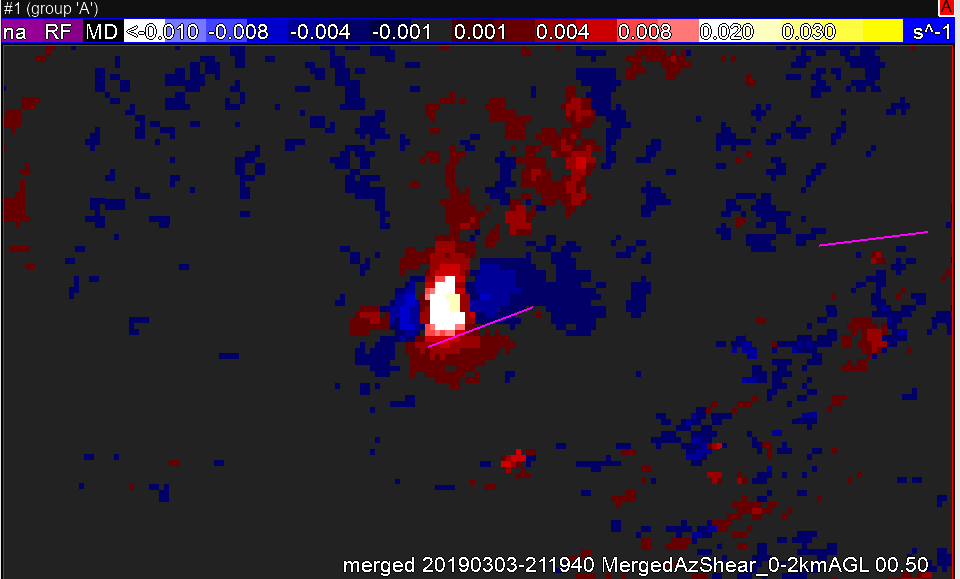
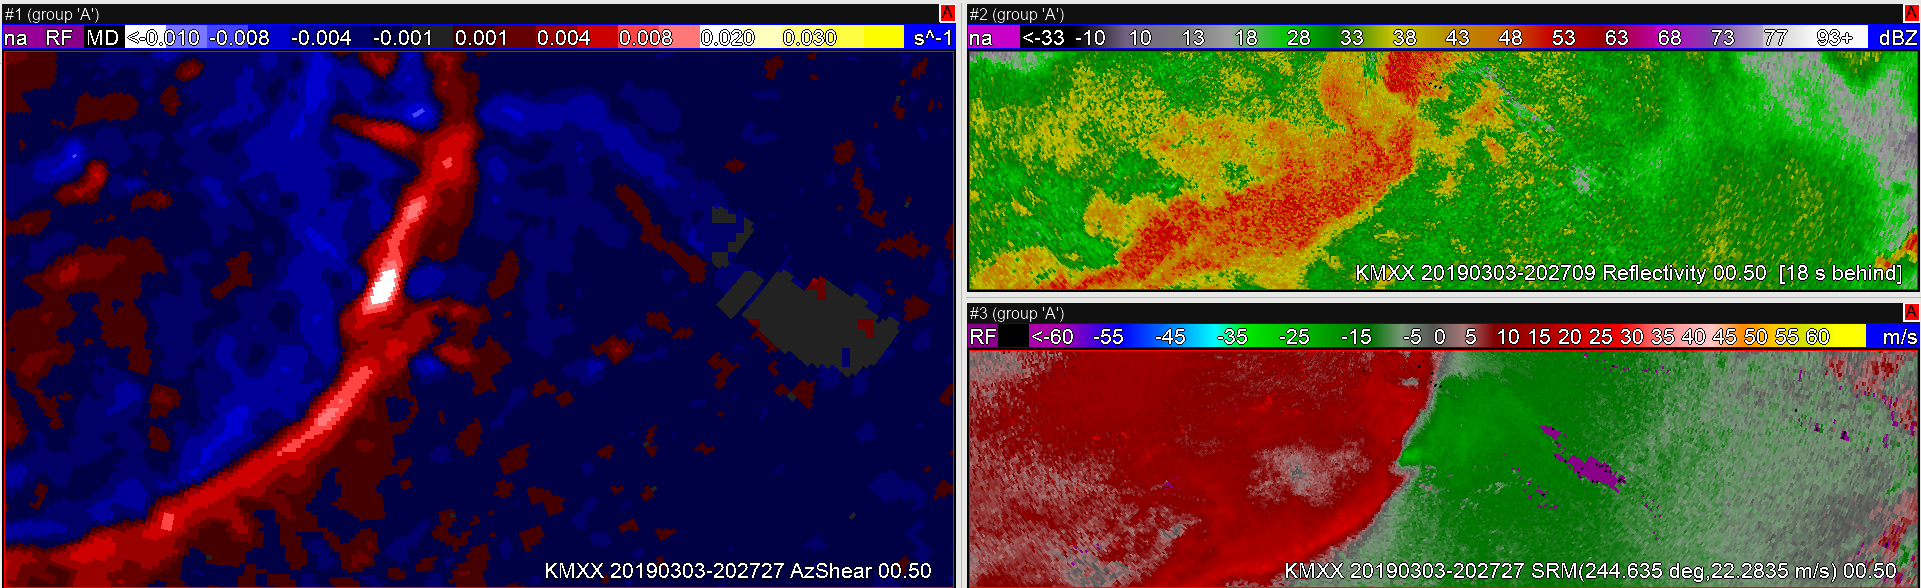
AzShear (0-2km) merged product roughly 143km away from KMXX and 145km from KEOX.The second Tornado event analyzed was a QLCS stlye embedded tornado that formed along the leading edge. Pictured (Left) is the 0.5 degree AzShear product, (Top Right) is the 0.5 degree base reflectivity product, (Bottom Right) is the Storm Relative Motion all from the KMXX radar.
There does seem to be some utility in utilizing the single-radar AzShear product when monitoring for embedded rotation in QLCS style events. In this case, a clear in-flow notch is not clearly evident via reflectivity, which can act as an identifier and/or precursor to a QLCS style tornadic event. Thus, using the AzShear product to monitor the entire bowing line segment became a valuable situational awareness tour, highlighting potential areas of interest ahead of time. It still, however, did not replace velocity’s utility, and I’d still prefer to use BV/SRM to draw any type of warning polygons in order to minimize unnecessary FAR within the eventual warned area.
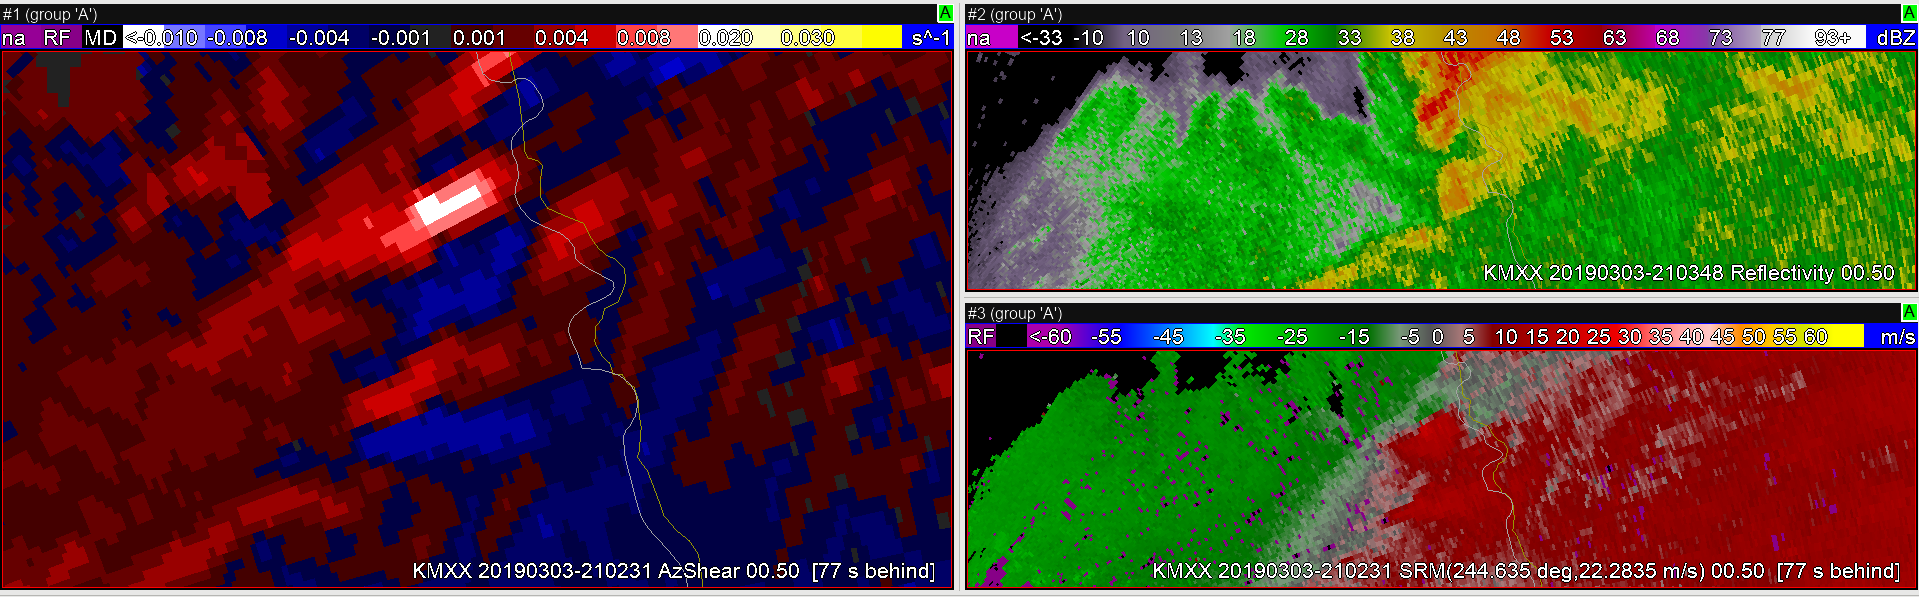
Third area of weak rotation from a semi-discrete cell north of the line. Picture (Left) is the 0.5 degree AzShear product, (Top Right) is the 0.5 degree base reflectivity product, (Bottom Right) is the Storm Relative Motion all from the KMXX radar.
Interestingly, through the analysis process, the AzShear product picked picked up on some weaker rotation from a semi-discrete cell further North of the line, which caused me to investigate the feature further. If just monitoring BV/SRM, this feature likely would have gone unnoticed due to reflectivity/velocity cluttering around the feature. Thus reinforcing the suggestion of utilizing AzShear (All-Tilts) as a situational awareness tool to help trigger areas of interest for the weather radar operator on-shift.
Looking at features further from the radar, AzShear seemed to struggle at depicting some of the weaker features (likely due to the reliance on good velocity data input which also struggled about the same in these scenarios). It did, however, continue to pick up some of the stronger rotational couplets, doing a good job at highlighting those.
Taking a look at both the 0-2km and 0-6km merged products, I am still a bit frustrated by the SAILS induced “skipping” which is apparent. My suggestion here would be to somehow ignore the Sails slices, only producing a new product when all of the 0-2km and/or 0-6km scans are available to do so. This would make for a much cleaner picture… Yes, it would also induce latency issues, but I think the accuracy of what is being displayed would be more useful. The 0-2km and 0-6km merged products also seemed to run a little “hotter,” especially when analyzing the QLCS structure, likely picking up some significant mid-level shear associated with the linear storm-mode of convection/cold pool interaction.
Rapping up a few thoughts…
I think that single-radar AzShear is an excellent product and overall is fairly easy to read as a forecaster (although, not 100% sure of how to fully process the blue/negative colors within operations at this point) . I feel like its best utility lies with situational awareness in operations and in post-storm analysis (i.e. picking out potential damage swaths). Even with some resolution degradation in the 0-2km and 3-6km merged AzShear products, I feel they could also be useful, especially at a regional/national scale where the finer details may not be required/needed. The 0-2km may also be useful in HSLC or Tropical Tornado type environments, where the low to mid-level rotation may be a valuable pre-cursor to short-lived spinups.
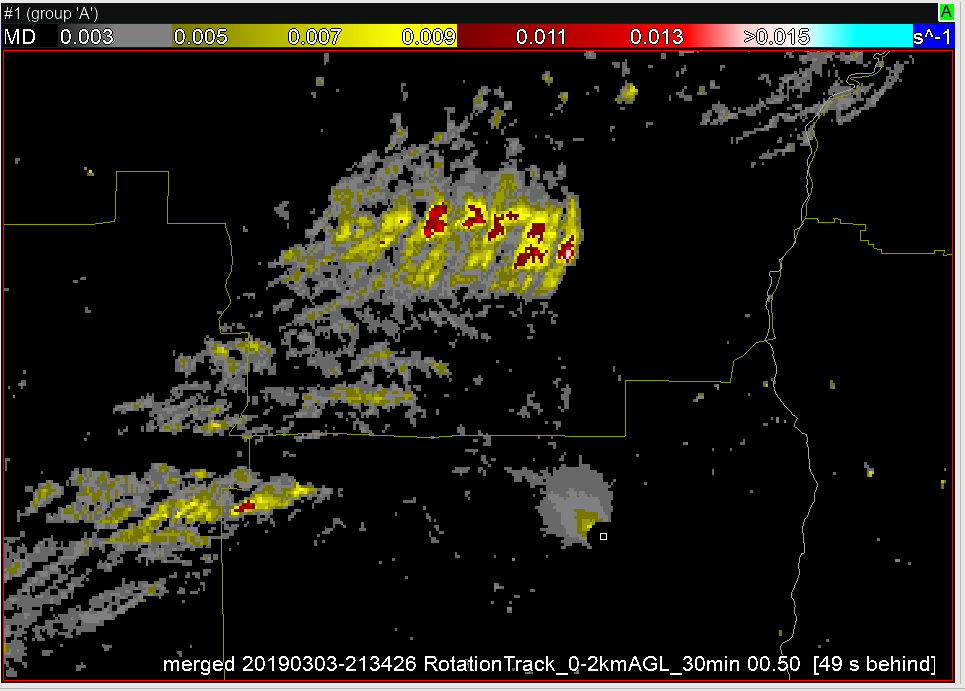
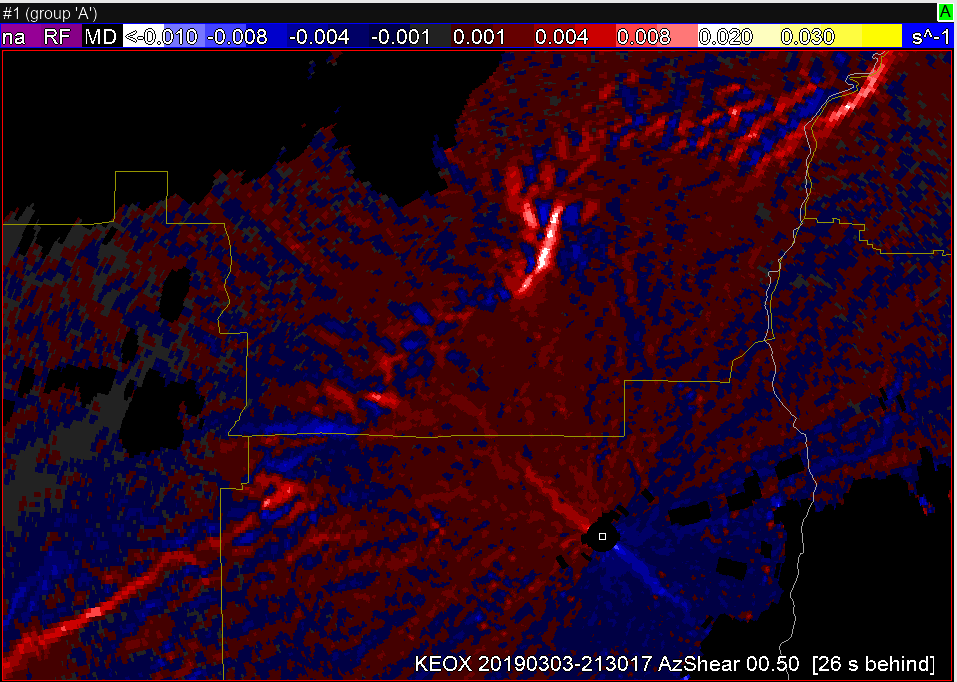
Now that convection has continued to move to the east, I’ve switched to the KEOX radar and, while reflectivity and velocity data show some interesting areas to look at, the AzShear product is guiding my attention to 3 areas, to the west, northwest and north-northwest of radar.
SRM shows a couple areas of possible rotation, but nothing substantial, at least yet. The more notable area is just east of the red/white marker. The 30-min 0-2km Rotation Track shows the recent AzShear history of the 3 cells. My most immediate concern for a developing tornado is the northern-most cell, about to pass north of the radar.
While tracking tornadoes in the beginning of this outbreak, a squall line of heavy convection has been present farther to the west. While notable in reflectivity, the AzShear & Merged AzShear products have been very useful for a quick-glance situational awareness of areas of higher concern for tornadoes. In areas that are equally far from multiple radars, forecasters would have to compare multiple velocity products to adequately interrogate areas along the squall line for rotation, including adjusting for SRM. The AzShear products readily and quickly highlight those areas that should be investigated further.
A secondary tornado near the KMXX radar has developed near the track of the larger tornado earlier. While this one doesn’t look as large, it was more apparent in the AzShear product, and after looking at the SRM of that area, my confidence in the presence of a secondary tornado was increased.


 I’m comparing the actual sounding to what’s shown on nucaps, and allsky to see what’s initializing the best. The actual sounding shows 3025kj of surface lavyer cape and 1453 of mixed layer.
 SRM shows a couple areas of possible rotation, but nothing substantial, at least yet. The more notable area is just east of the red/white marker.
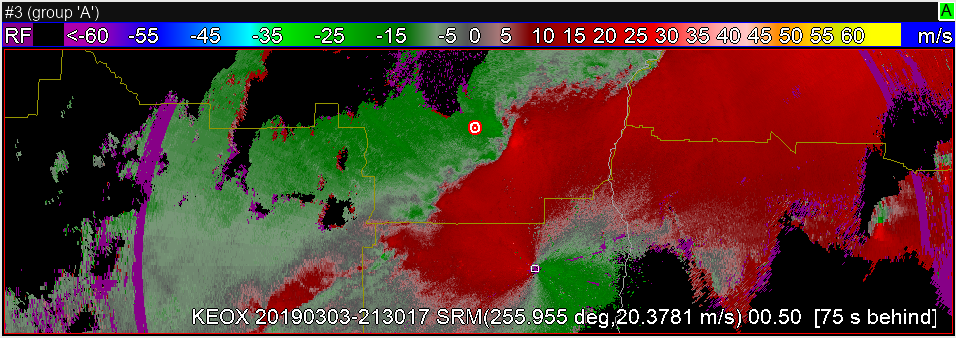 The 30-min 0-2km Rotation Track shows the recent AzShear history of the 3 cells. My most immediate concern for a developing tornado is the northern-most cell, about to pass north of the radar.