

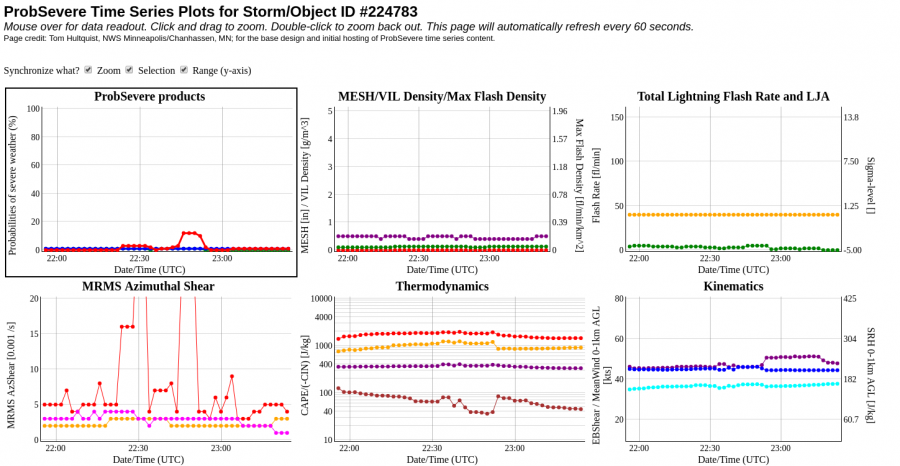
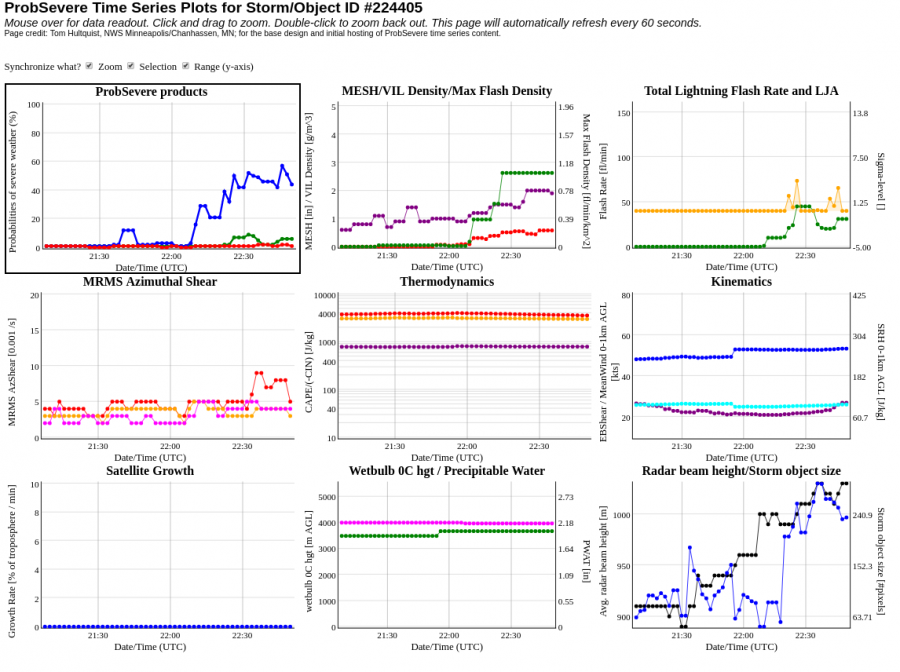
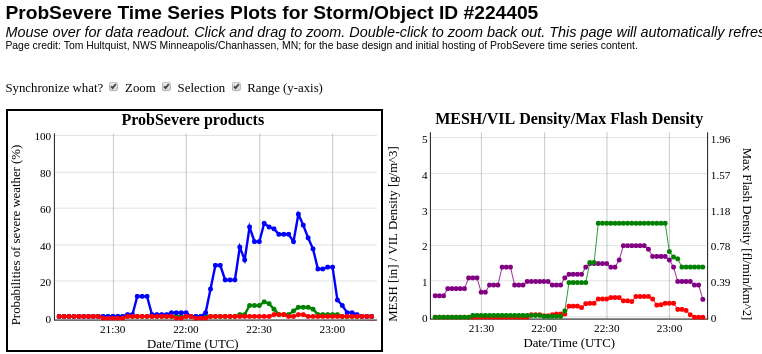
A particular storm in the CWA, which had previously been quite strong, had weakened and I diverted my attention elsewhere. However, I kept the ProbSevere Time Series displayed on another monitor. Later, I noticed that the Time Series indicated that the storm was potentially re-intensifying (top left image) and it caused me to direct my attention back to the thunderstorm.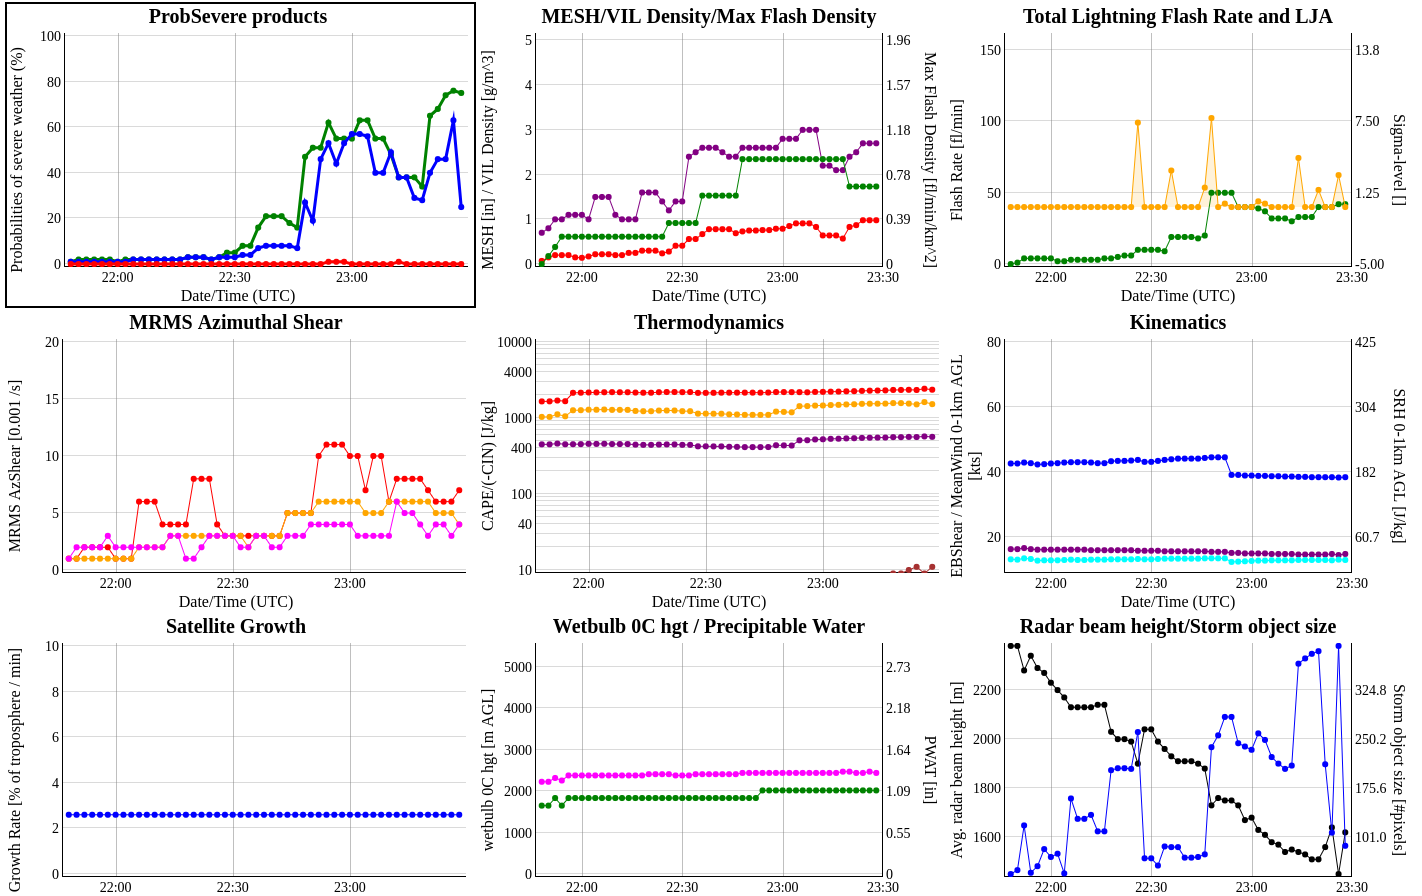
Tag: ProbSevere
ProbTOR in Stratiform Rain???
Here is an example where the ProbSevere algorithm identified an area of concern in heavier stratiform rain. ProbTOR values peaked around 12% in this area. This is a good reminder that YMMV when using ProbSevere.
The Life and Death of a Gulf Storm Through the Eyes of Experimental Products
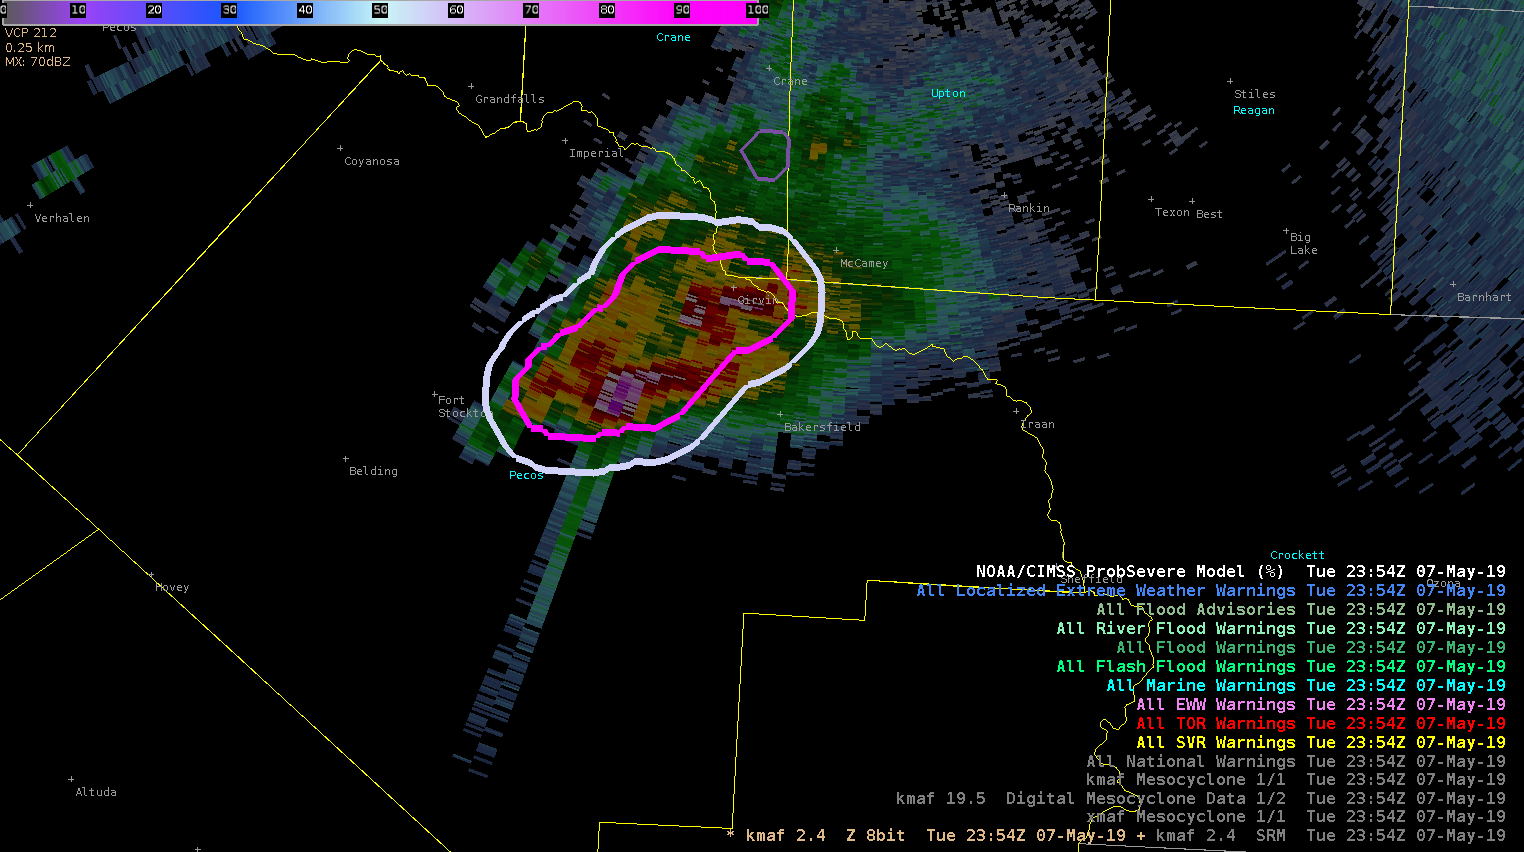
In this case of a rapidly developing storm, GLM data was leaned on to issue a SVR Warning on what otherwise may have been a marginal storm. AllSkyLAP showed the storm was developing in an area of MLCAPE values over 2000 J/kg, and ProbWind model had rapidly increased to ~50%. GOES-16 1-minute imagery showed rapidly cooling cloud tops, with a sharp increase in lightning activity. Given GLM values comparable to other severe storms on the day a SVR warning was placed on the storm. The warning was sent out relatively early to try to capitalize on lead time.
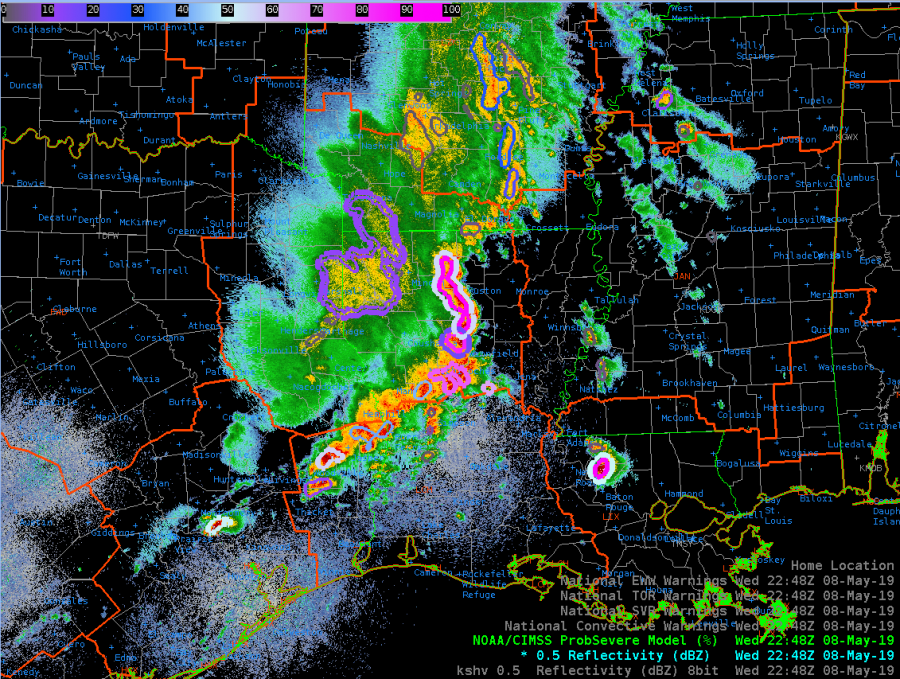
Radar w/ ProbSevere:
IR-Sandwich:
Flash Event Density:
Minimum Flash Area:
Event Density:
Total Optical Energy (too fast, whoops!):
AllSkyLAP CAPE:
ProbWind Model Increase:
UPDATE: Shortly after warning on the storm, it completely fell apart after failing to become rooted in the boundary layer and all indicators (i.e., ProbSevere, GLM imagry) dropped to null. Initial warning was shamefully cancelled.
Really living up up to my name!
Radar w/ProbSevere:
Flash Event Density:
ProbWind Model Increase:
#ProtectAndDissipate
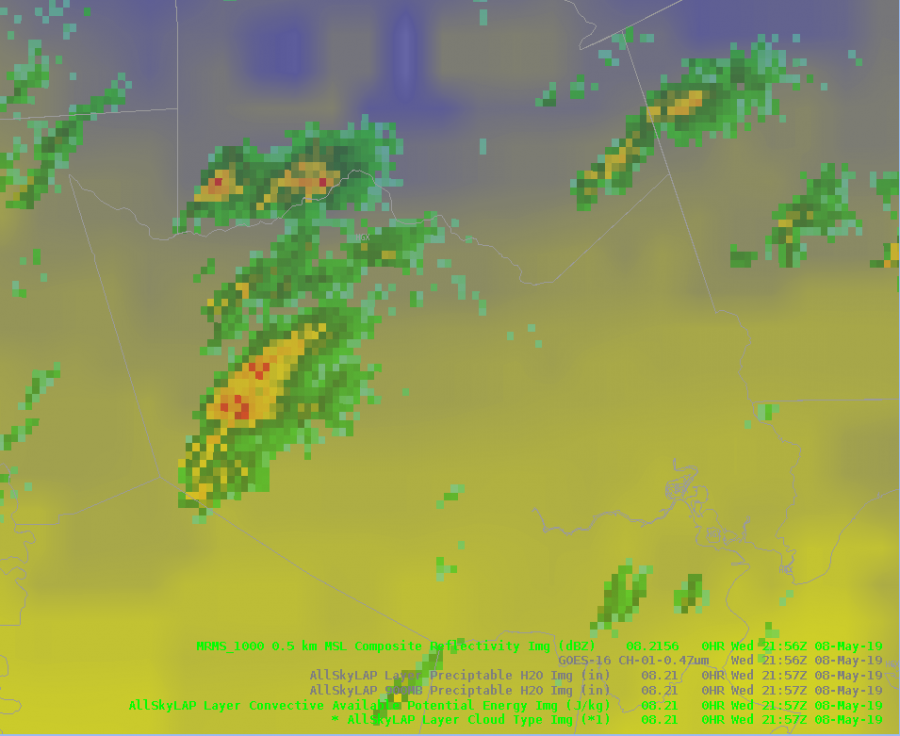
ProbSevere & Satellite Imagery
Although ProbSevere products are typically used coincident with radar data, but can also be applied to satellite imagery. Using ProbSevere with satellite imagery can provide a visualization as to where the strongest parts of a thunderstorm may be located .
This loop shows developing & strengthening convection across the Texas Panhandle and far western Oklahoma, via Day Cloud Phase imagery with ProbSevere overlaid. 
Jumping TORprob
Fluctuating TORprob occurring within small group of weak updrafts. Nothing of note to show on AzShear.
ZDR_Arcophile
ProbTor Increase – False Flag
Here’s a case where the ProbTor model significantly increased in an area where tornado potential was extremely limited. Below are animations of the radar velocity at the closest radar (KGRK), the low-level Merged AzShear, and the time series of the ProbSevere product. The cell in question was small and behind the main line of storms in the more stable airmass, yet the ProbTor model jumped to 79% for several minutes. The time series seemed to indicated this was due to an increase in AzShear yet the Merged Low-Level AzShear product showed no distinct signature (same for Mid-Level AzShear not shown).


UPDATE:
After consulting with the fantastic Mr. Cintineo, he found that the false flags were likely from a jump in the Low-Level Rotation tracks in MRMS (shown below). These false signatures, however, were not making it into the aforementioned AzShear product.

#ProtectAndDissipate
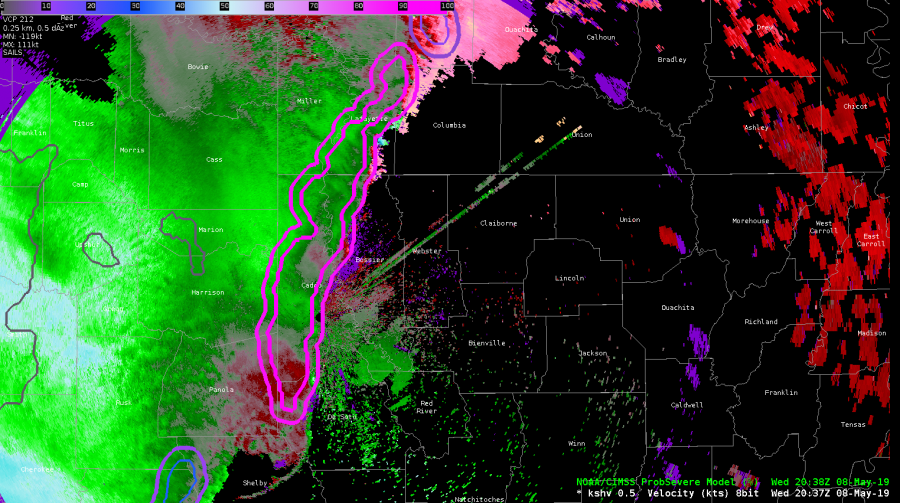
ProbTor 97% / Is It Useful For a Line?
The Prob Tor is 97% for this long line in the SHV CWA. Is that useful as a forecaster? It might seem like it isn’t, but let’s discuss. We’ve been watching circulations along the line through the shift. Early on, we issued several TORs, but in a number of cases, the circulations have been short lived along the segment.
So, as a forecaster or a WFO, you’ve got two ways you can go here in the current environment….
1) You can issue a SVR for straightline wind for the whole segment for a longer length of time (45-60min) given that the environment the line is moving into isn’t changing, and try to keep up with shorter lived, individual TOR warnings for the circulations
-or-
2) You can issue a severe thunderstorm warning for a shorter period of time for straightline wind (30 min) and tag that “lines can produce tornadoes) and see if that characteristics of the leading edge show clearer tornadic signs at some point.
At least the ProbTor alerts you to a decision to be made. It goes both ways in WFO offices in this situation.
NMDA and ProbTor Helping Along Line

ProbTor and NMDA helping forecaster confidence for issuing TOR warnings along bowing segment in SHV CWA. This is a situation that I don’t deal with much and in consultation with my partner for today we issued another TOR within the line we have a SVR out for.
-icafunnel
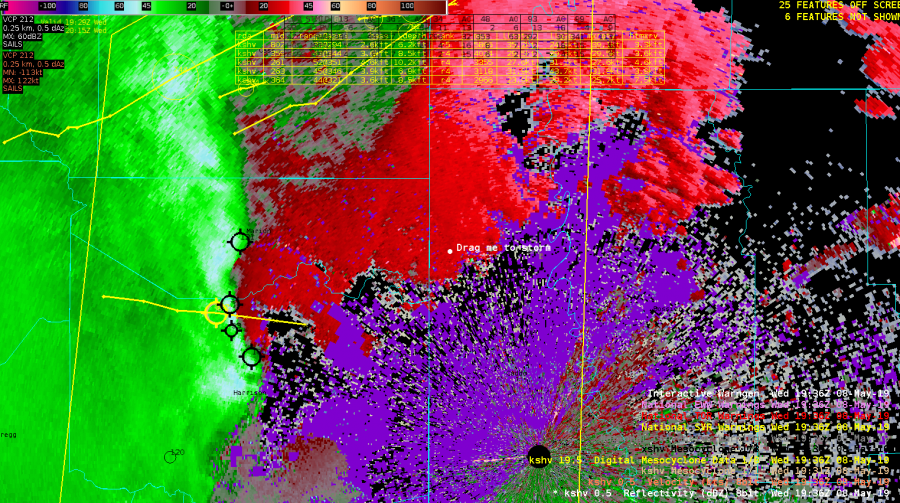
Tornado Warning Prompted with Merged AzShear
Radar imagery f/ KGRK showed rotational low-level organization within the QLCS. While ProbSevere was putting near 80% for the wind threat with and increase to a 9% for a tornado threat. The Merged AzShear product was showing strong 1D pseudo-vorticity in the area of interest and was used to push the SVR warning w/ Tor possible tag up to a Tornado Warning. Immediately after issuing the warning the circulation seemed to fall apart, however, a couple minutes after the warning a report of a wall cloud with a rope tornado came in through the chat. Lead time may have been nill (also due to not having a Text Workstation up yet), but the warning seemed to have verified thanks to the dependency on the AzShear product. With a single-radar AzShear in operations it would have been possible to increase lead time.


UPDATE:
Going back and looking at the GLM data showed intensification of the cell which spawned the reported tornado before genesis (or at least before the report). GLM FED shows the previously warned cell to the north fading in strength and the intensifying updraft of the cell to the south that prompted a tornado warning.
#ProtectAndDissipate
TBS with max MESH hail 3.15 inches
Had to give a shout out to the utility of MESH as we received hail reports of 3 inch hail near the time of an impressive three body scatter that maximizes at the 2.4 degree slice.
ZDR_Arcophile