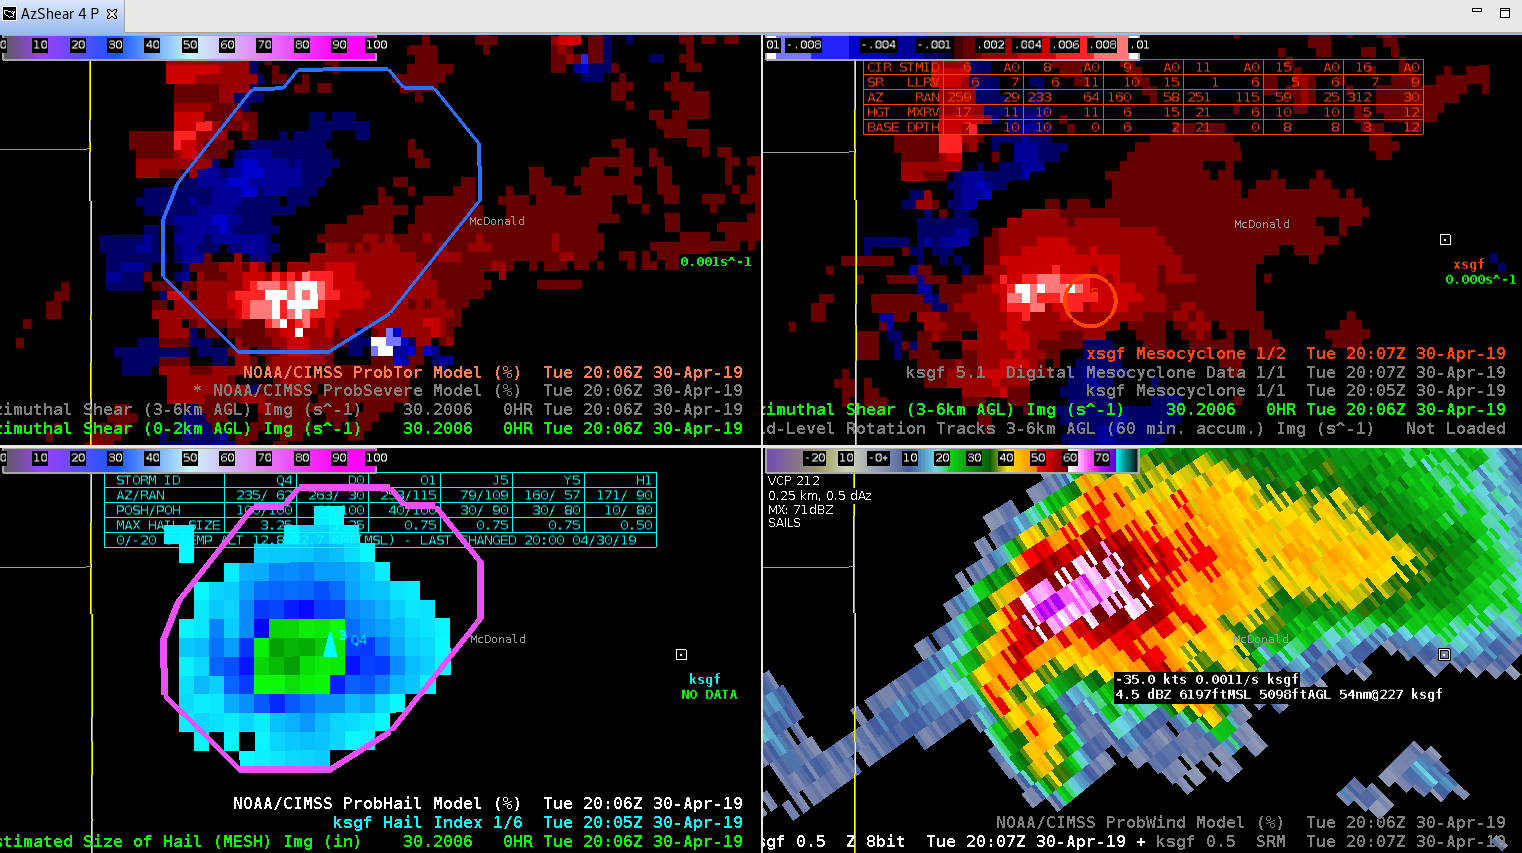
I’ve seen some great promise from the low level az shear this week so far. One thing that I do not like about the default product is that it has a lot of noise/extra info in it that tends to clutter up your screen. An idea that I had was to filter more of the noise by making a large portion of the scale transparent. Take a glance at the velocity field and see how it matches up with the AZ shear extremes.

Another advantage I could see with only displaying the “extremes” would be the ability to include velocity data underneath the image. This can be especially useful since the MRMS data is feeding the AZ Shear. Why? Well the velocity couplet you are examining is likely to progress a bit “faster” using the baseline radar data rather than MRMS, so they likely will be right next to each other.
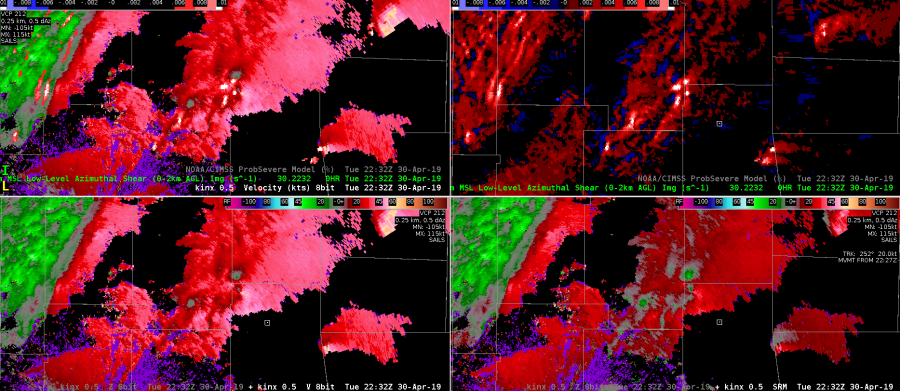
Other thoughts I have had going this route is possibly changing the “red” side of the color scale to something other than red so that it doesn’t match the color scale used by velocity data on radar. I did like a “yellow” scale as it did not largely conflict with the color scales expressed by the velocity data.
As a whole I think this product has some great potential at drawing your attention to portions of the storm very quickly.
South Beach
 Sandor Clegane
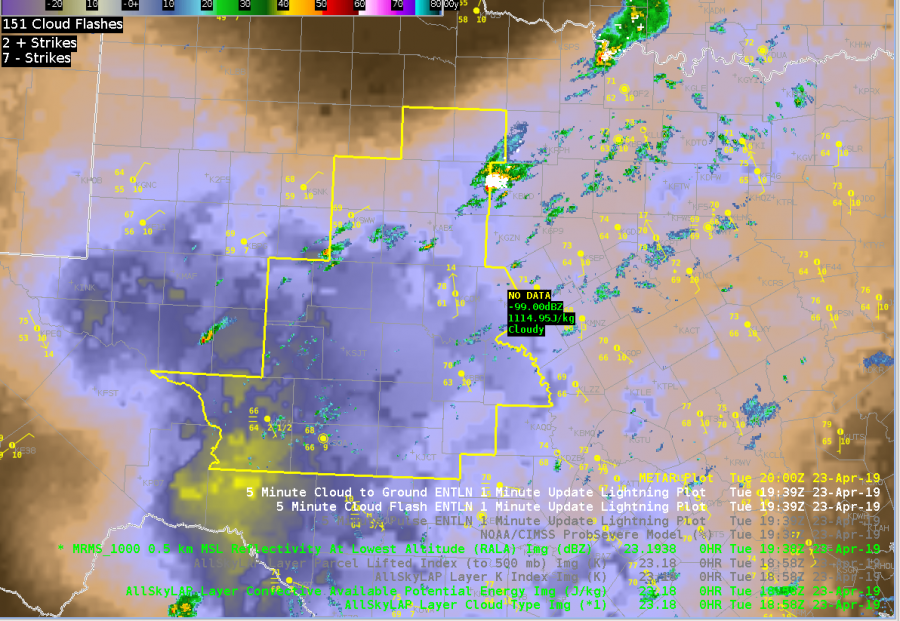
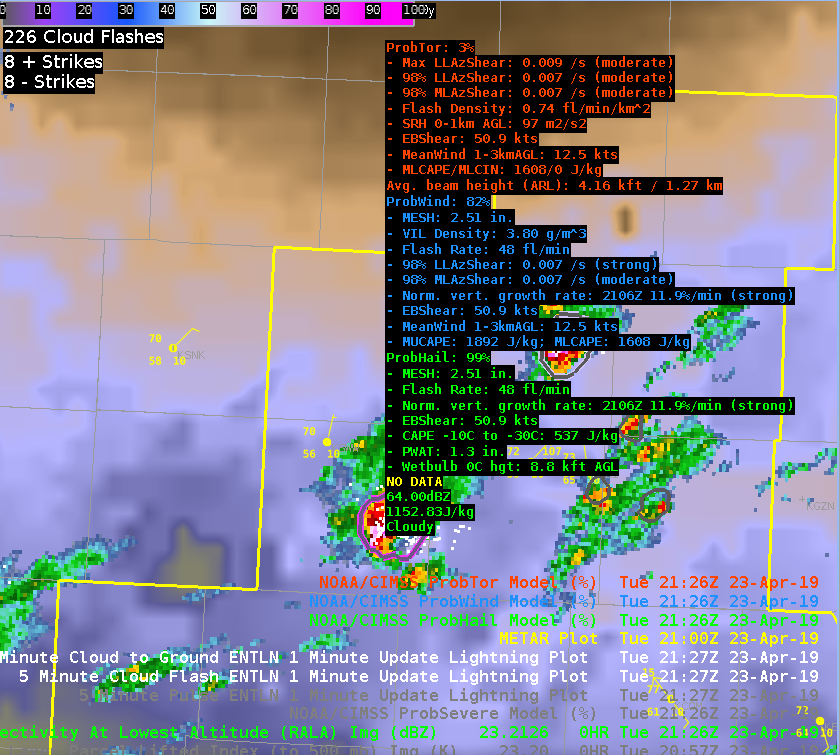
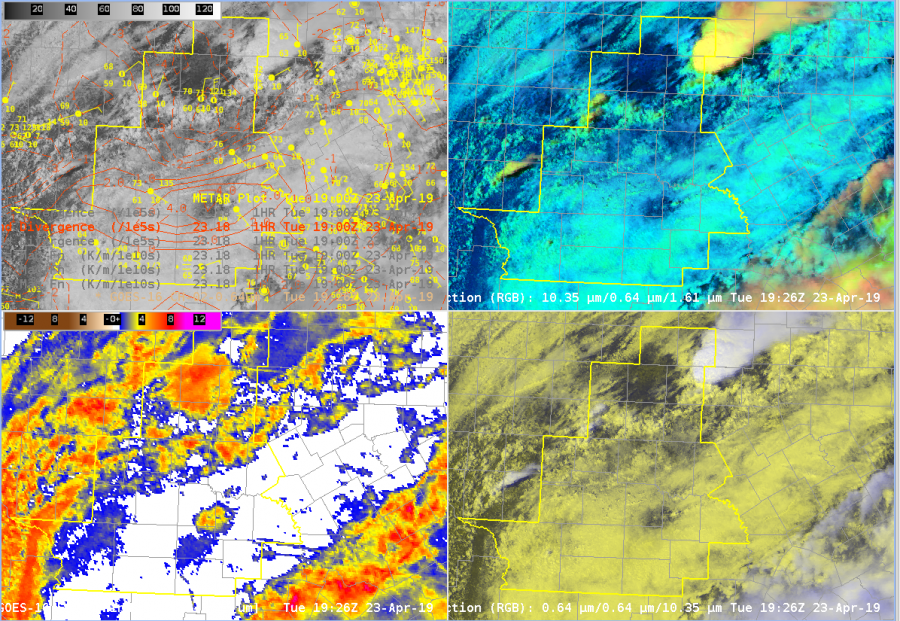 Laps All Sky retrievals show a relatively sharp instability gradient along warm front where our convection initiated. Storm motion is likely to be parallel to the front, so convection that does will likely be relatively long lived. (Below)
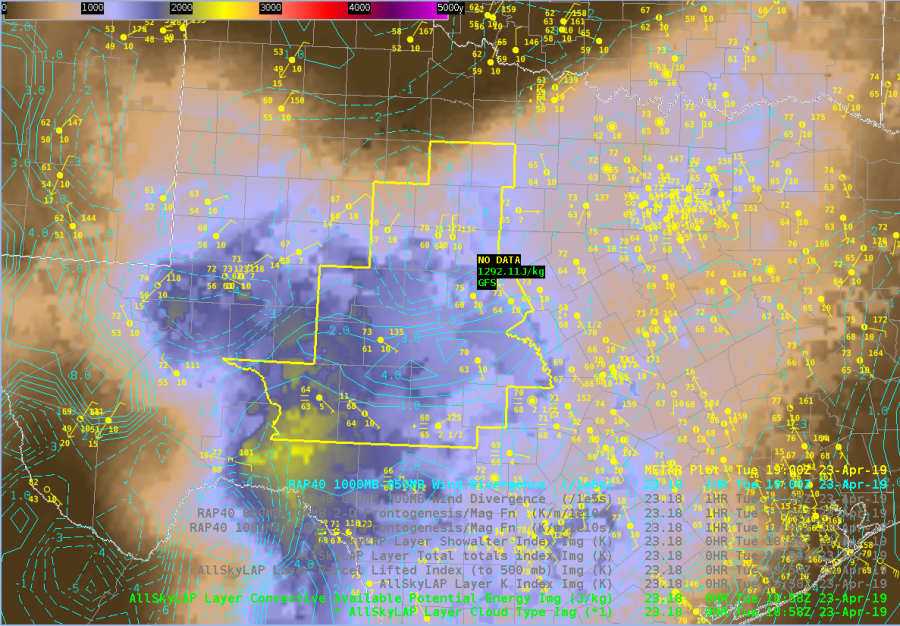 Laps All Sky LI further indicates that the airmass is relatively unstable and there will be little convective inhibition at least in the midlevels. (Below)
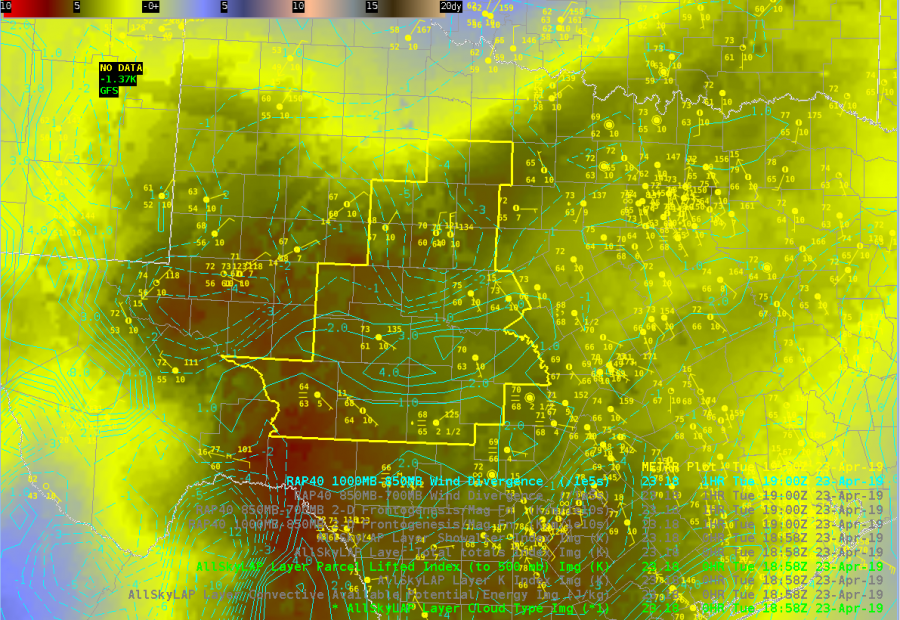 All Sky TPW indicates a relative moist airmass across the CWA with PWs above 1″ for most of the CWA. This matches the 12z sounding from MAF relatively well, and is well above the 90% threshold of the sounding climatology for that location and date. It’s interesting that the mid-level moisture (bottom left) is higher than the low level moisture (bottom right). Not quite sure what to make of that at this point. (Below)
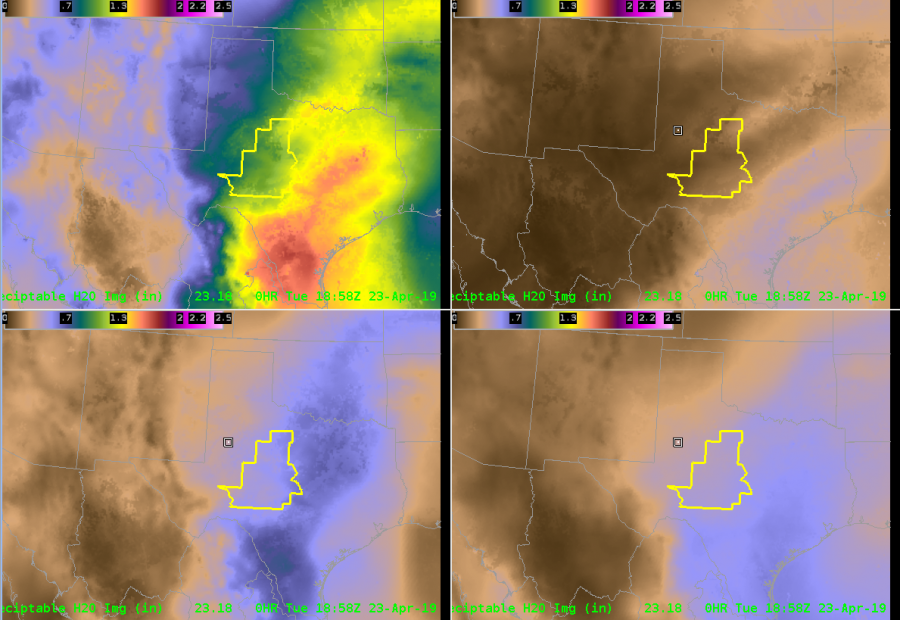 Finally, MRMS RALA indeed shows that showers and storms have developed along the front. When animated (not shown), you can see that the storms are tracking along the front, heightening my concern for flooding.