An official website of the United States government
Here’s how you know
Official websites use .gov A
.gov website belongs to an official government
organization in the United States.
Secure .gov websites use HTTPS A
lock (
) or https:// means you’ve safely connected to
the .gov website. Share sensitive information only on official,
secure websites.
A semi-discrete cell tracked NNE of Little Rock, Arkansas. This storm developed a very tight reflectivity gradient on its southeast flank. A few other notable features were an inflow notch and hook-like appendage. Mitigating the severe potential with this storm was an outflow boundary displaced to the east of the updraft and low cloud flash counts (ground based) or cloud extent flash density (GLM).
The 0-2 km azimuthal shear generated what seemed to be a spurious bullseyes south of Searcy, Arkansas with values over 0.020 S-1. This data was input into the ProbTor algorithm, causing the spike to 72%. The 0-2 km azimuthal shear derived with the new dealiasing technique never plotted values over 0.008 S-1. In fact, the bullseyes which were located slightly to the NW of the primary rotation track, never showed up in the new azimuthal shear product. -Roy
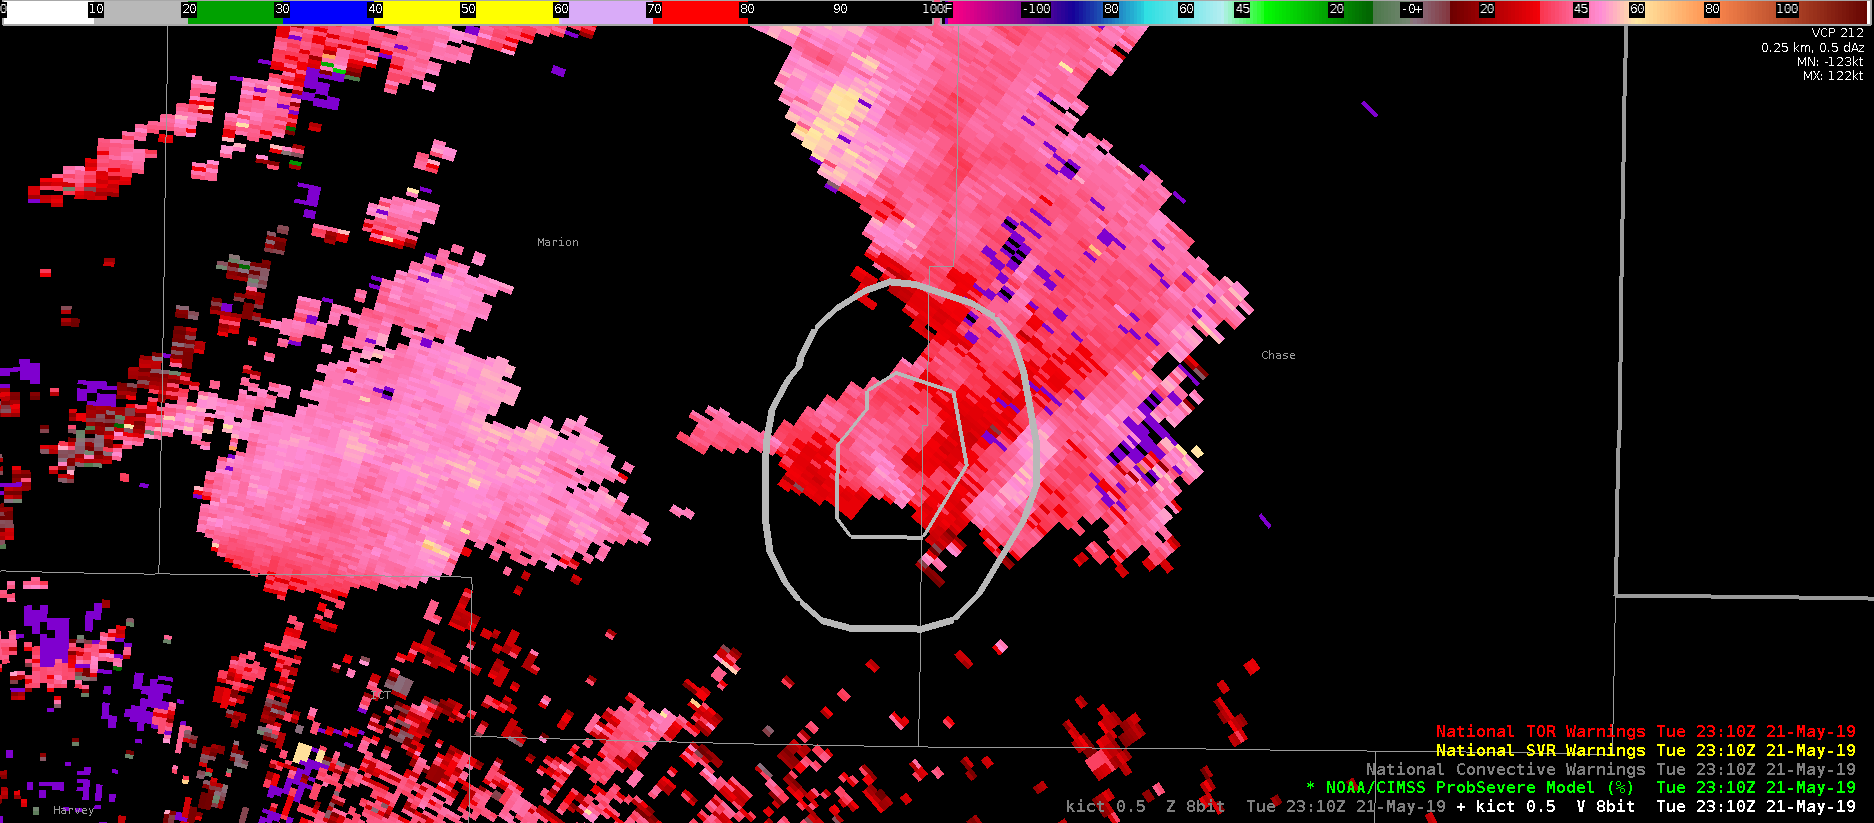
At times, there is some unnatural jumpiness in the Prob Tor Product. See the time series of 0.5 base velocity and Prob Severe/Tor below.
The first image is 2310Z. The storm is not overly impressive, with 5 minute FED max of 3 (not shown). Accordingly, the Prob Hail/Wind/Tor is 4/2/11 % respectively. The base velocity shows some decent winds of 45+ knots at about 3500 ft. above ground.
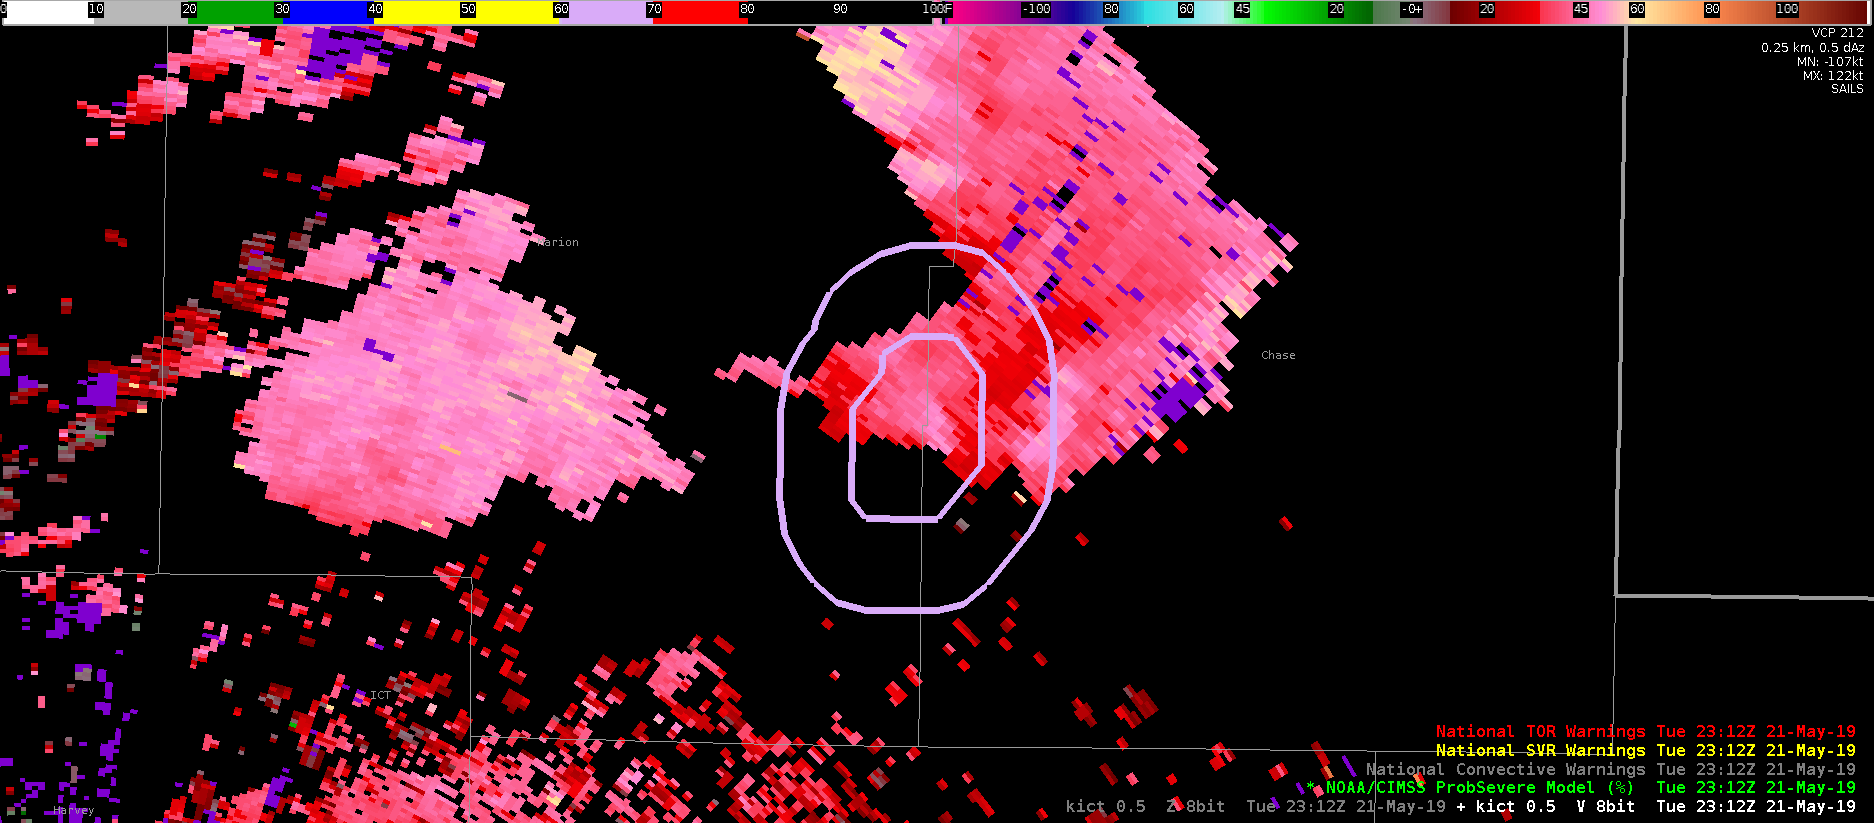
When moving to 2312Z however, the Prob Hail/Wind/Tor are 4/12/61 % respectively. That is a huge jump in Tor Prob, but the velocity does not indicate any substantive change in organization, and the 5 minute FED has not changed.
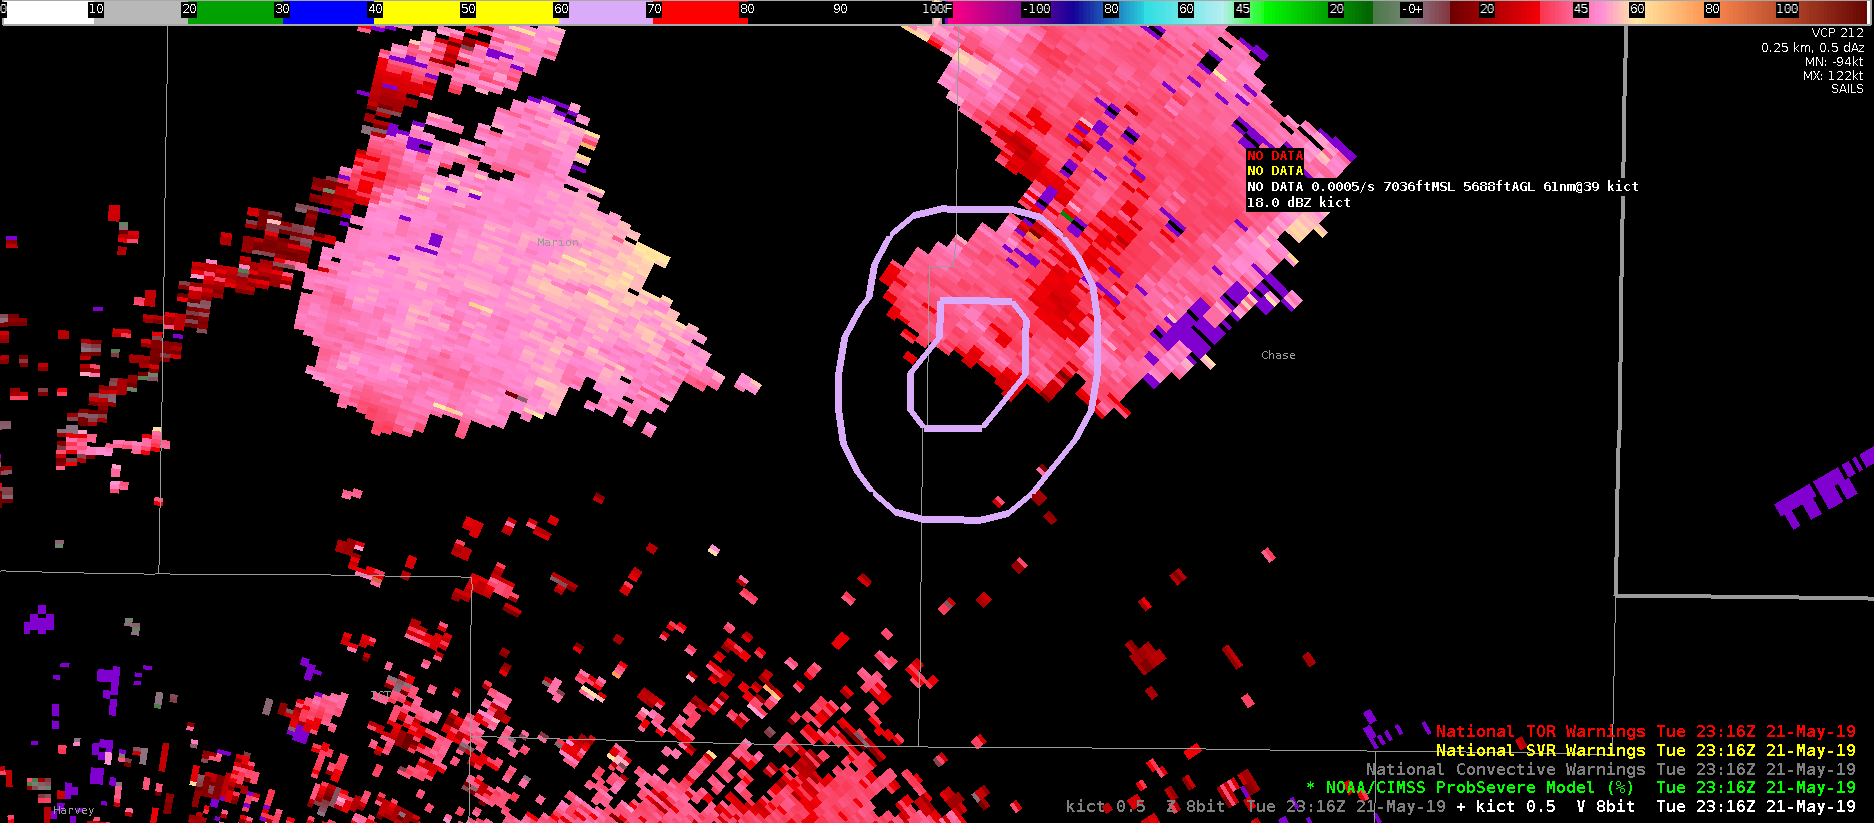
Going ahead to 2316Z, the base velocity looks even less impressive, but the Prob Hail/Wind/Tor are virtually unchanged at 3/12/61 % respectively.
Finally, at 2318Z, the Prob Hail/Wind/Tor drop to 3/2/10 % respectively. These kinds of ups and downs despite any other evidence pointing to a change in organization made the products difficult to use in this case.
The NMDA initially identified a mesocyclone with the embedded supercell at 2253Z, however the storm was exhibiting supercell characteristics for at least 15 to 20 minutes before this time, including a very well defined bounded weak echo region capped off by a 70+ dBz echo above 20 kft. Below is a loop showing the line approaching St Louis with NMDA overlaid.
Below are 4 panel radar images from klsx at approximately 2235z (nearly 20 minutes before the NMDA first identified a mesocyclone), showing the 8.0 (top) 4.0 (middle) and 0.5 (bottom) elevation cuts. A very well defined bounded weak echo region is evident in the reflectivity images in the top left.
A bump in GLM Flash Extent Density (bottom image, top left) was noted at 2020Z, and is coincident with the development of an embedded supercell within the convective line approaching St Louis (top image). This storm had a 60 dBz core extending above 20 kft (middle image) and a notable BWER associated with its updraft.
The MRMS AzShear product produces multiple areas of rotation as it tries to ingest 0.5 degree SAILS scans. The animated gif above is from WFO TOP late Tuesday afternoon as a tornadic circulation moved north of I-70. The AzShear algorithm easily identifies the area of rotation, however during SAILS cuts it breaks the rotation into multiple areas rather than moving the entire circulation forward with each time step. This may be due to only the lowest scan being available for AzShear during SAILS cuts, but it makes the product look disjointed and unrealistic. While this may be easy to ignore in discrete supercell mode, the AzShear output could be confusing if SAILS were deployed in situations that may have numerous areas of weaker rotation and/or shear zones, such as a QLCS/MCS.
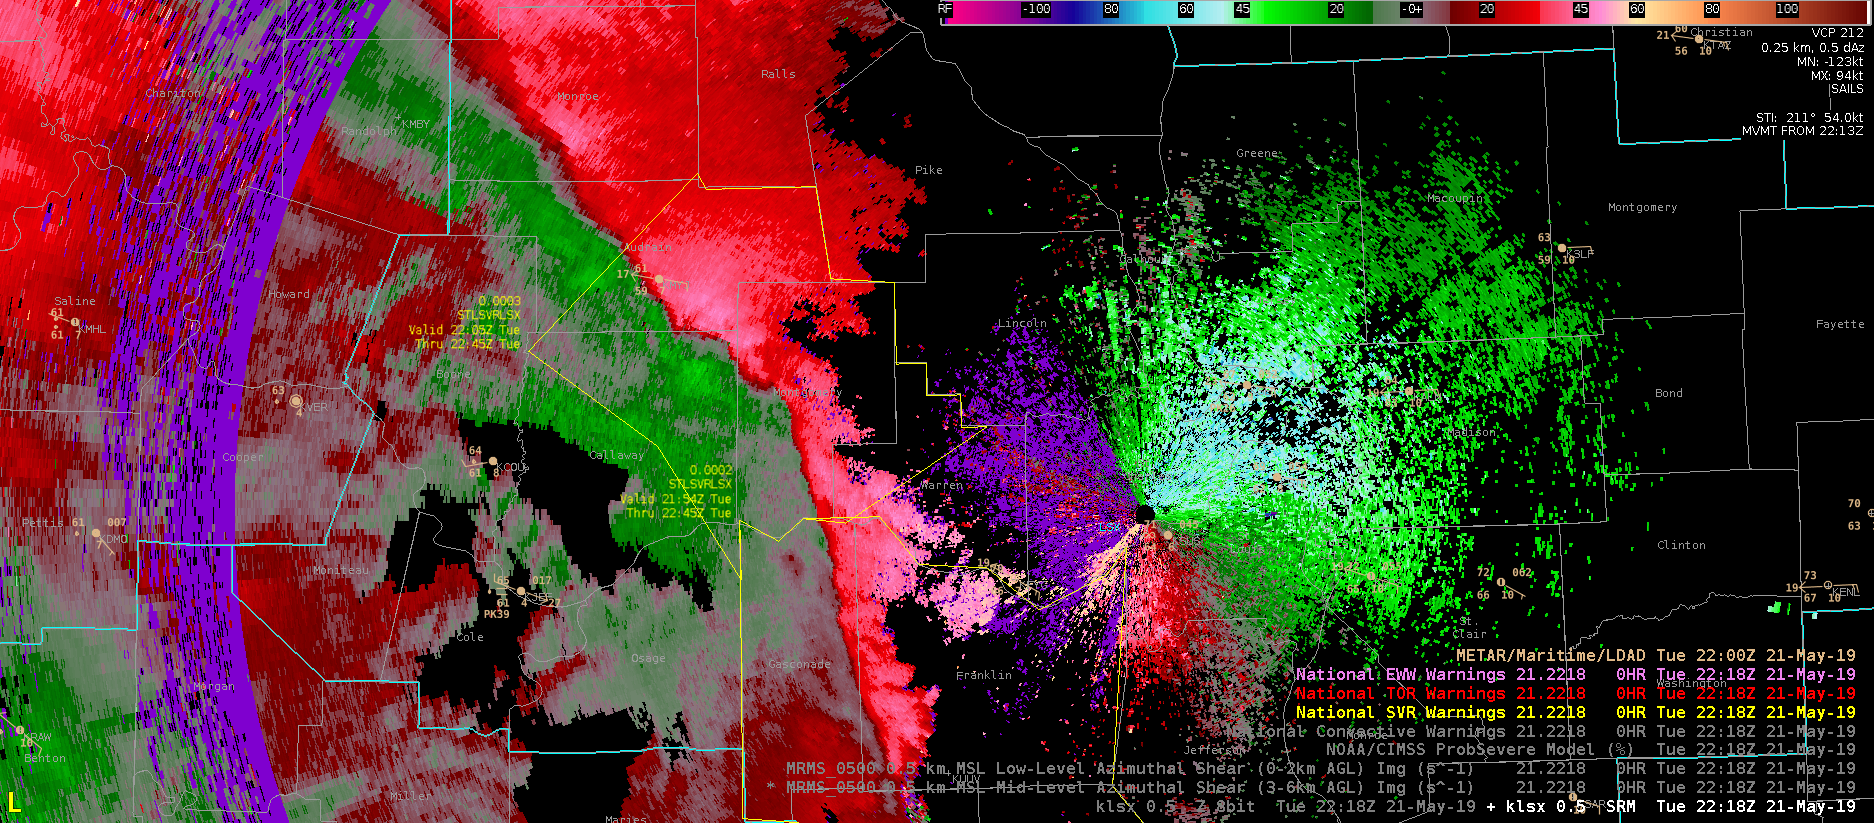
The 0-2km AzShear product is depicting the highest tornado threat along the convective line. There is a maxed-out area of 0-2km AzShear along this line.
This makes sense given extreme low-level shear values in this area with easterly winds at the surface lengthening the hodograph. According to the RAP, 0-1km SRH values are in excess of 400 m here.
On the afternoon of May 21, portions of the Wichita (ICT) and Topeka (TOP) CWAs were under a Severe Thunderstorm Watch. To give one of the new GLM products a run through, I wanted to compare two cells of differing strength to see if GLM trends were helpful in nowcasting the cells. See the loop below.
The first cell of note was in Dickinson County (TOP CWA), and the second was in Rice County (ICT CWA). At the initial time of 2131Z, the storm in Dickinson County was already severe, and the Prob Severe Product supported this assertion with 68% prob wind and 76% prob tor. Meanwhile, the cell in Rice County was much weaker, with 50DbZ topping out below the -20C level (not shown), and prob hail/tor values of 2/1 % respectively.
At that time, the 5 minute flash extent density showed a little enhancement (max of 32), but the total optical energy was actually less (63 fJ) than several other, weaker storms in the area. Meanwhile, the storm in Rice county showed very modest flash density values (max of 9), but more significant TOE (144 fJ).
As the loop continues through the next 40 minutes, the intensity of the Rice County storm steadily increases as it moves northeastward, reaching Prob Hail values of 34% by the end of the loop (prob tor was still very low). meanwhile, the storm originally in Dickinson County remained fairly steady state, with Prob Wind/Tor both at 68%. It’s obviously conjecture at this point, but maybe the TOE product on the Rice County storm was signaling some type of intensification. hard to tell from just this one case, but interesting to note nonetheless.
So, at the map briefing this morning there was a LOT of discussion about yesterday’s event, and the fact that despite the tornadoes that did occur, this was a “bust” of sorts. That is, there wasn’t near the widespread development of supercells that was anticipated. There may be multiple reasons for this, but I thought I’d take an initial look at some data and soundings again from yesterday to see if anything stands out that I happened to miss.
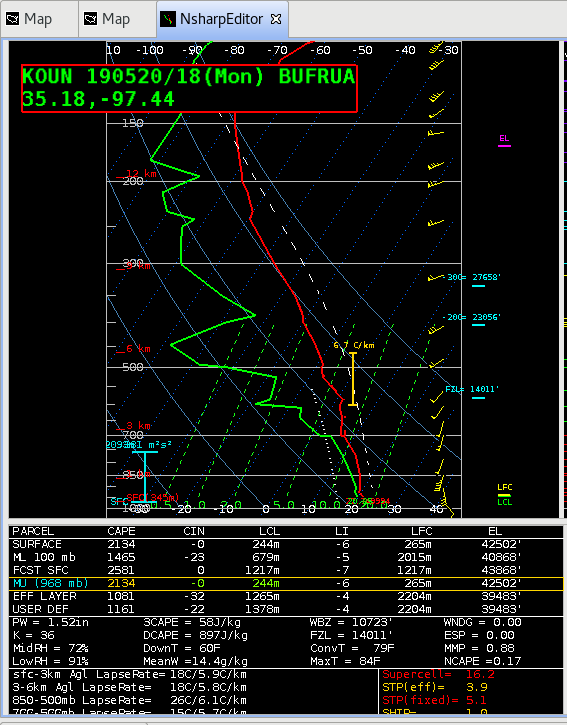
Here’s a sounding (radiosonde) taken from Norman (KOUN) yesterday at 18 UTC 20 May 2019.
KOUN Sounding (radiosonde) from 18 UTC 20 May 2019
Notice that lapse rates were not particularly steep through the sounding, with 850-500 lapse rates around 6 C/km. Also, notice the deep moist layer from the surface up through ~700 mb, which I’m told that this is rather unusual for this area.
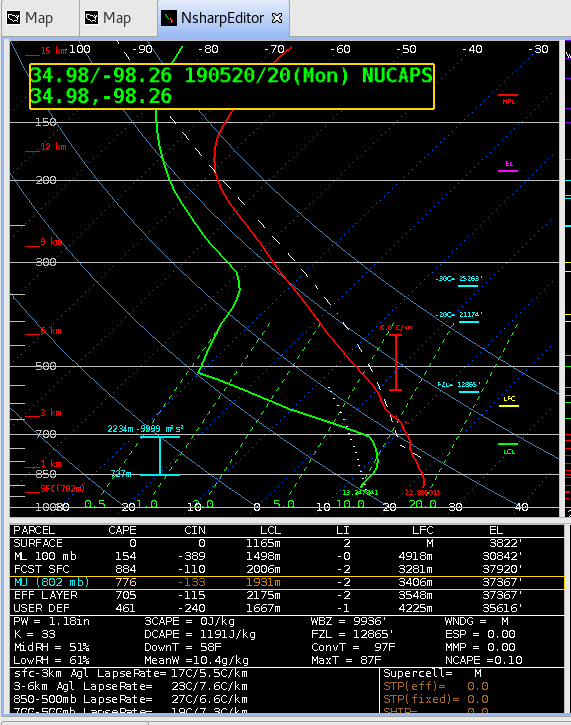
Ok, let’s take a look at a NUCAPS sounding in this proximity taken from the ~20 UTC swath.
NUCAPS Sounding from ~20 UTC 20 May 2019 (“green” sounding south of Norman, 34.98N 98.26W)
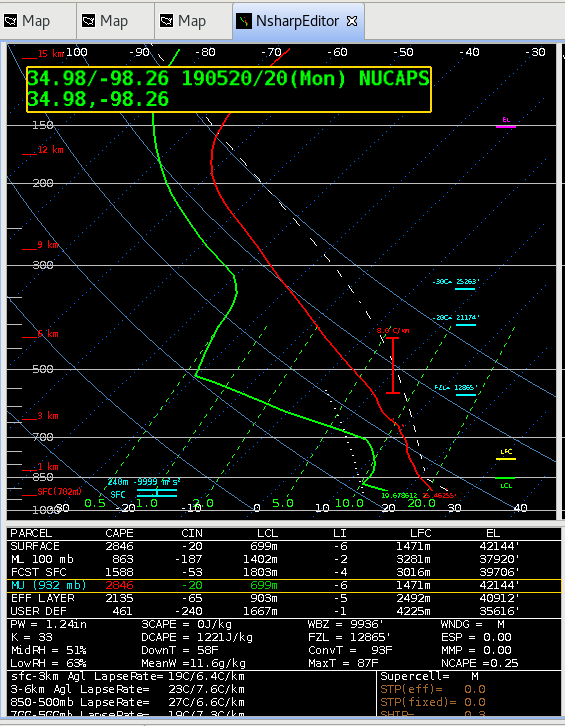
Immediately, I notice that the NUCAPS sounding doesn’t have the deep moist layer that the KOUN sounding showed just about 2 hours earlier. If anything, this layer did not disappear during the 2 hours, it remained, and perhaps even got a bit deeper. The 00 UTC KOUN sounding (not shown) indicated a moist depth up through about 680 mb or so. Ok fine…there’s the limitations with the accuracy of observations in the boundary layer in NUCAPS, but this is still important to capture since many severe weather parameters are derived from the surface or near-surface layers. However, it was noticed that lapse rates aloft were fairly similar, showing lapse rates that were not very steep, about 6.6 C/km in the 850-500 mb layer. The modified sounding (shown next) also didn’t capture the moist boundary layer.
Modified NUCAPS Sounding from S of Norman, 34.98N, 98.26W
I did want to point out again the good characterization of the mid-layers. Granted, while the NUCAPS soundings didn’t capture every squiggle in the dew point temperature aloft, it did capture the overall character of the moisture profile.
Well, I ended up having to give up my workstation, but perhaps this case should be investigated some more. Although not shown here, the lapse rates and theta-e from my memory did appear to show a relatively large W-E gradient across the area from north Texas into S-Central Ok.
The GLMIR imagery is doing a nice job this afternoon pinpointing the most active portion of the line of convection moving into eastern MO, highlighting this area in cyan. It also picked up on a region of lightning which developed within the stratiform region to the north (shaded in purple).
A loop of GLM Flash Extent Density (top left), Event Density (top right), and Total optical Energy (bottom right) shows 4 pulses of electrical activity which spread northward into the stratiform precipitation region across north central Missouri. I thought this was rather interesting. Anvil lightning perhaps?


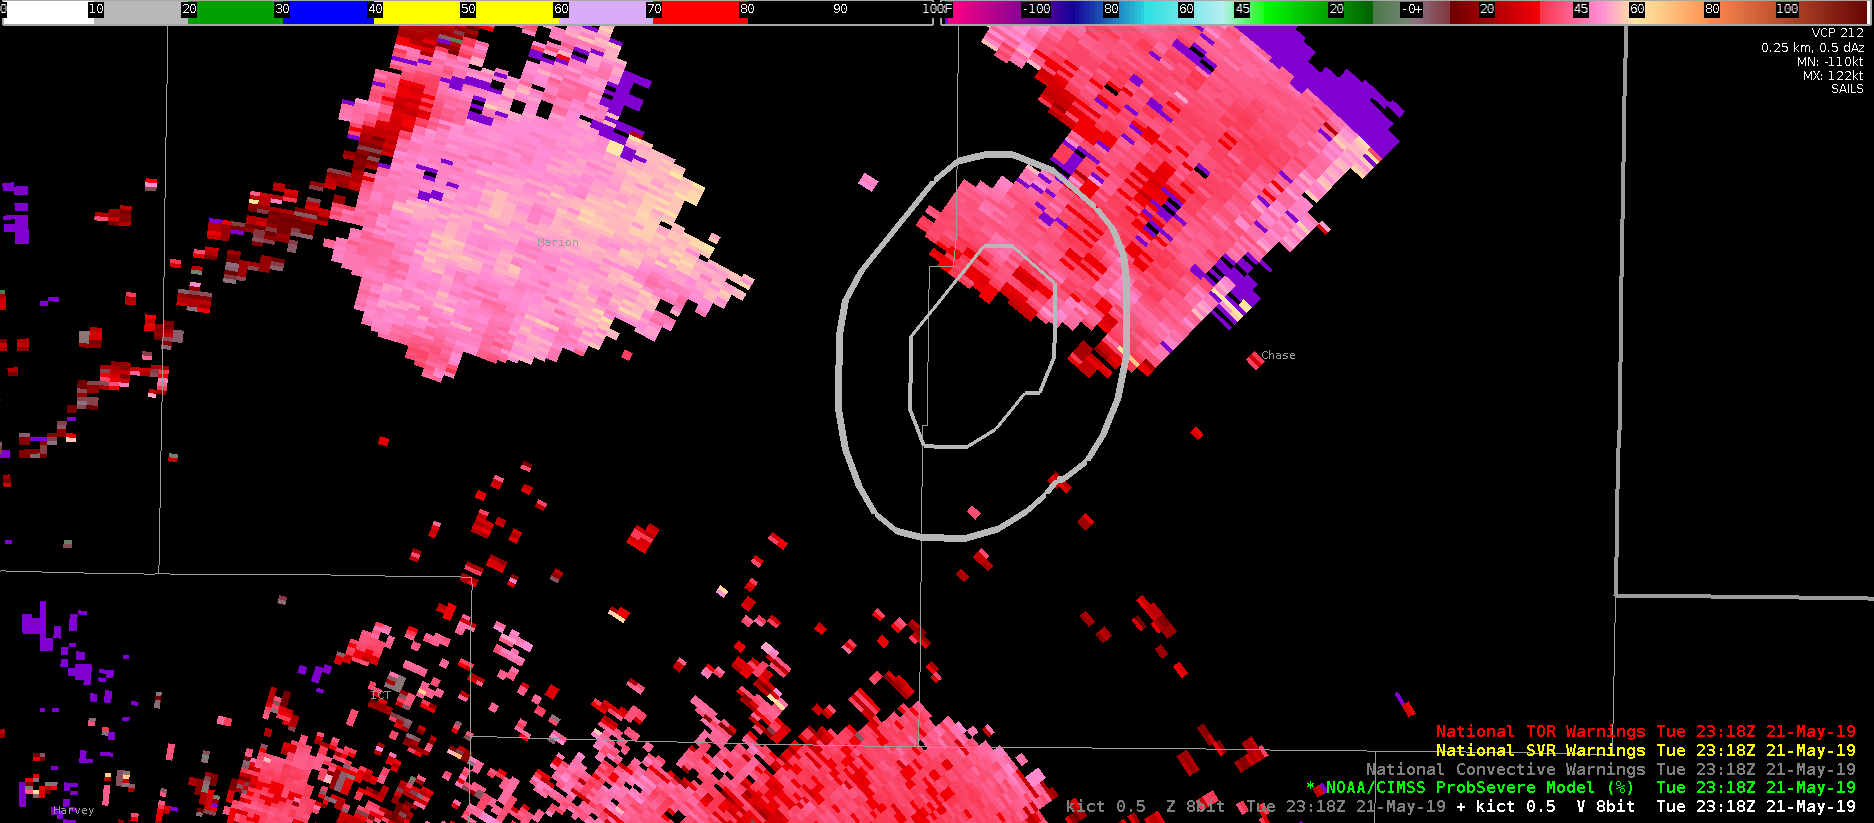


 The MRMS AzShear product produces multiple areas of rotation as it tries to ingest 0.5 degree SAILS scans. The animated gif above is from WFO TOP late Tuesday afternoon as a tornadic circulation moved north of I-70. The AzShear algorithm easily identifies the area of rotation, however during SAILS cuts it breaks the rotation into multiple areas rather than moving the entire circulation forward with each time step. This may be due to only the lowest scan being available for AzShear during SAILS cuts, but it makes the product look disjointed and unrealistic. While this may be easy to ignore in discrete supercell mode, the AzShear output could be confusing if SAILS were deployed in situations that may have numerous areas of weaker rotation and/or shear zones, such as a QLCS/MCS.
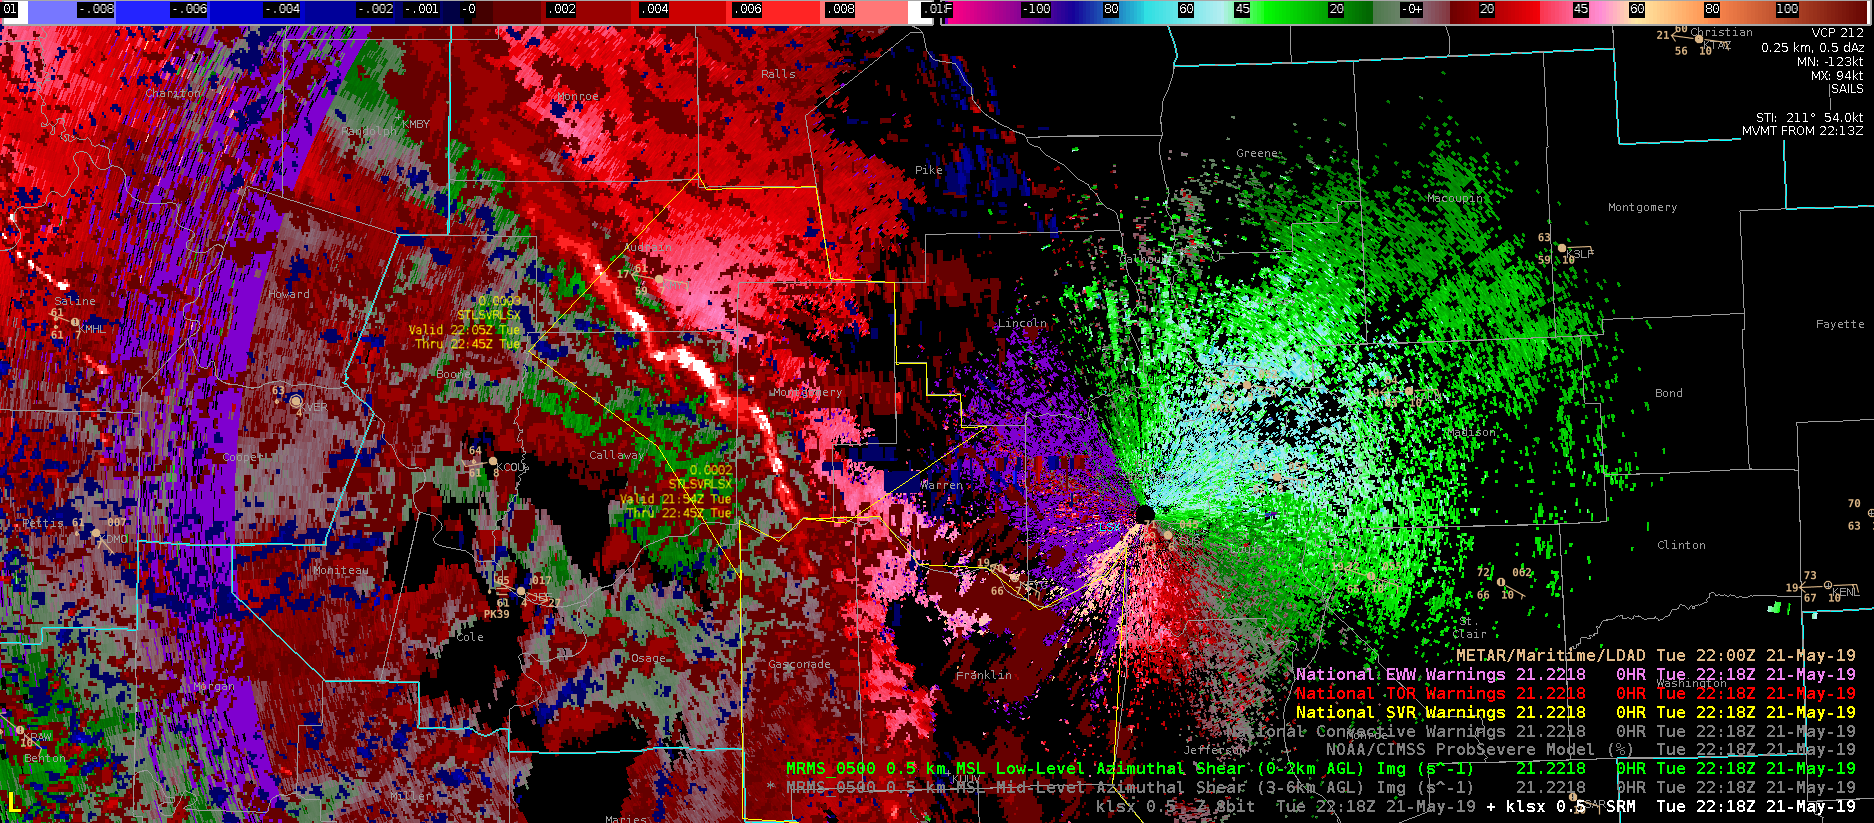
 The first cell of note was in Dickinson County (TOP CWA), and the second was in Rice County (ICT CWA). At the initial time of 2131Z, the storm in Dickinson County was already severe, and the Prob Severe Product supported this assertion with 68% prob wind and 76% prob tor. Meanwhile, the cell in Rice County was much weaker, with 50DbZ topping out below the -20C level (not shown), and prob hail/tor values of 2/1 % respectively.