Daily Summary: Week 2, Day 1

Much of the focus for day one was hands-on training for each of the evaluation products. After some initial familiarization with AWIPS-II, the various PI’s worked with forecasters on how to interpret the products, and what to look for during the week. Forecasters also became familiar with saving images, and posting to the blog. By the end of the day, participants had already made several informative blog posts.

Today we operated in the Davenport and St. Louis CWA’s. Since many of the products being demonstrated have their greatest benefit in the pre-storm environment, forecasters were unable to experience their full potential given the ongoing convection at the beginning of operations. The Prob Severe and Overshooting Top Detection products seemed to have the most utility in this situation. Additionally, forecasters appreciated the availability of the GOES-14 1-minute imagery.

Tomorrow, we will start activities at 12:30 in the Dev Lab for the daily debrief before moving to the HWT for the EFP briefing. Operations will likely take place somewhere in the Ohio Valley region.

– Bill Line, GOES-R SPC/HWT Satellite Liaison and Week 2 EWP Coordinator
Tags: None

Tracking storm development in MO with Theta-e differentials

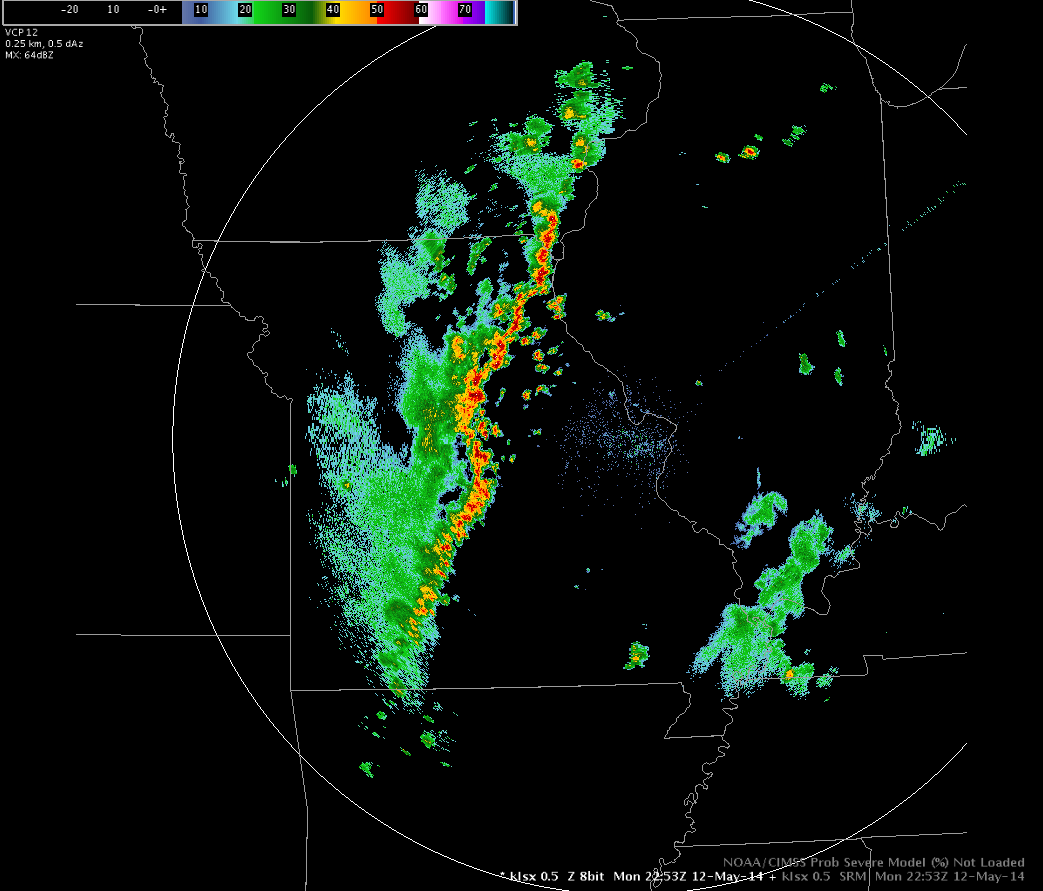
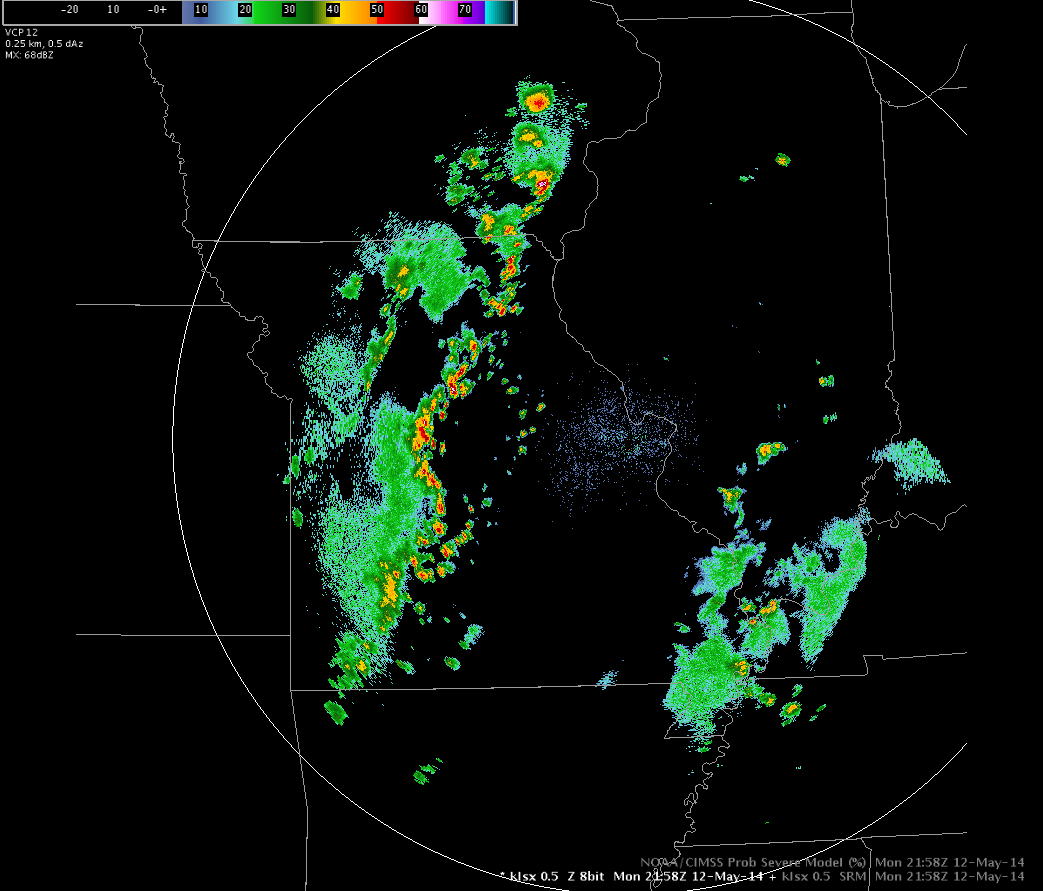
On Monday afternoon, a line of storms developed and propagated eastward, essentially bisecting Missouri by late afternoon. Here’s a look at the base reflectivity for the radar at KLSX (St. Louis) at 22Z (about 4pm):

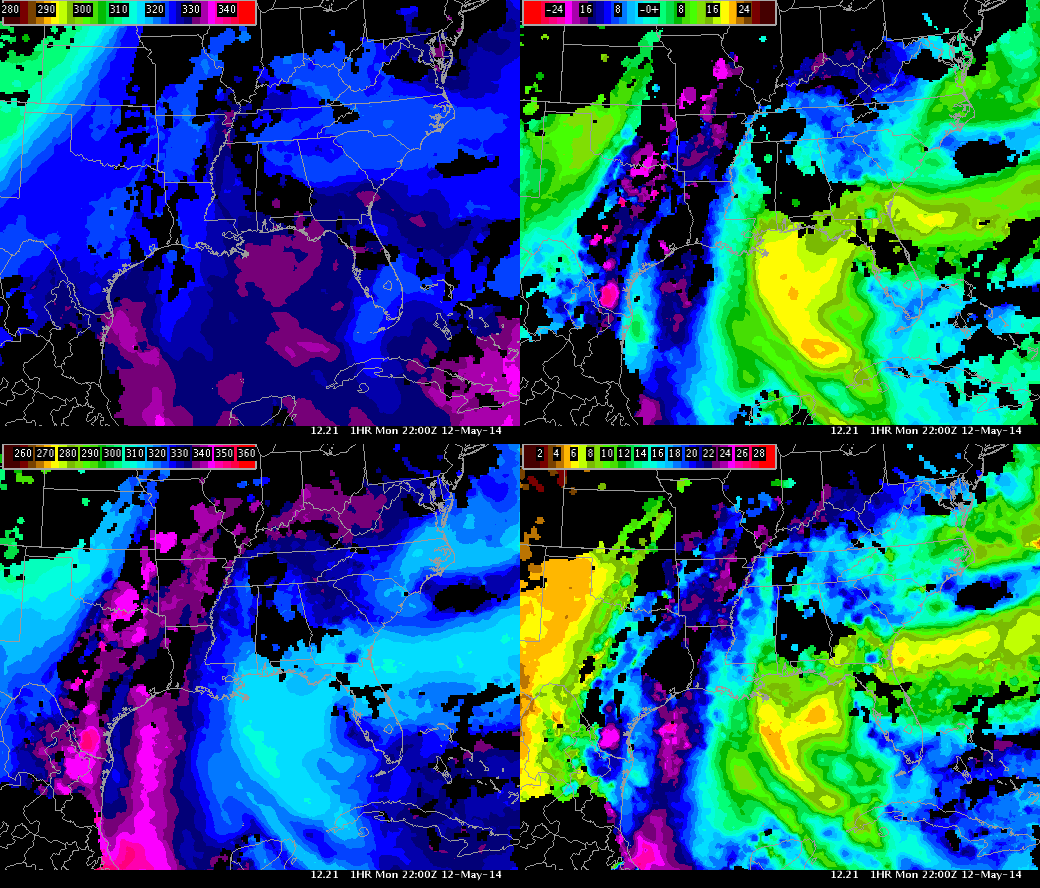
Baseref22ZMay12In the same timeframe, the CIMSS NearCast model was projecting a fairly high Theta-e lapse rate.

Theta_eDifference22ZMay12The box in the top right corner shows this GOES- derived Theta-e difference of around 20-21K in an area west of St. Louis. Interestingly enough, this ΔTheta-e maximum is aligned with the area of convection, seen in the radar imagery above. Will the storm cells continue to propagate eastward and will they actually strengthen as they enter this area of higher instability?

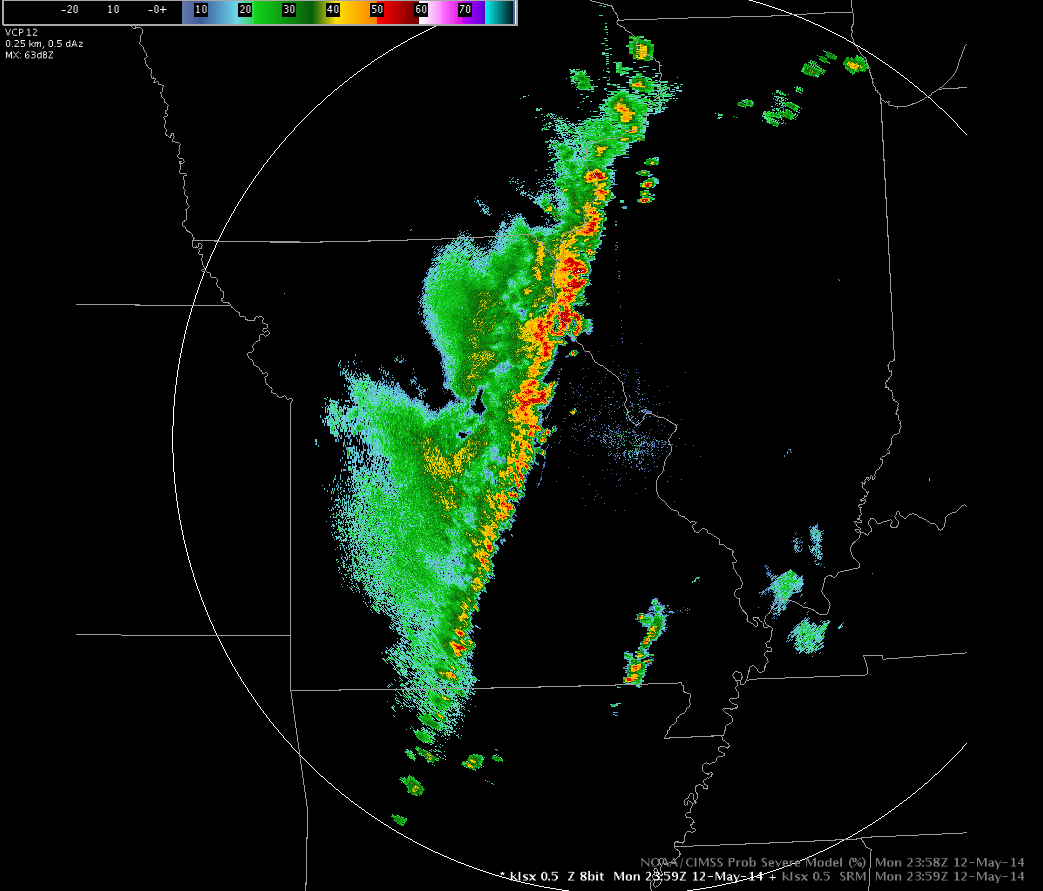
By 23Z, We’re starting to see some individual storm cells develop out ahead of the bow echo.

Baseref23ZMay12This would indicate that the area of high instability on the NearCast model is starting to produce some convectively-driven storms. The highest value I found in this image in the newly-formed cells was 56dBZ. So in the near term, it appears the NearCast is correctly predicting convective initiation through the ΔTheta-e product. How about at 0Z itself?

BaseReflectivity00ZMay13The stronger line behind the pop-up cells has accelerated and swallowed up the smaller individual cells! That is a straight line of storms if I’ve ever seen one. I suppose the ΔTheta-e could be used in this situation to predict that this storm line would evolve in this way. More cases will have to be examined in order to see if this parameter is consistently usable for this purpose!

Tags: None

GOES-R Convection Initiation Product Handles Convection Developing in Northern Illinois 5/12

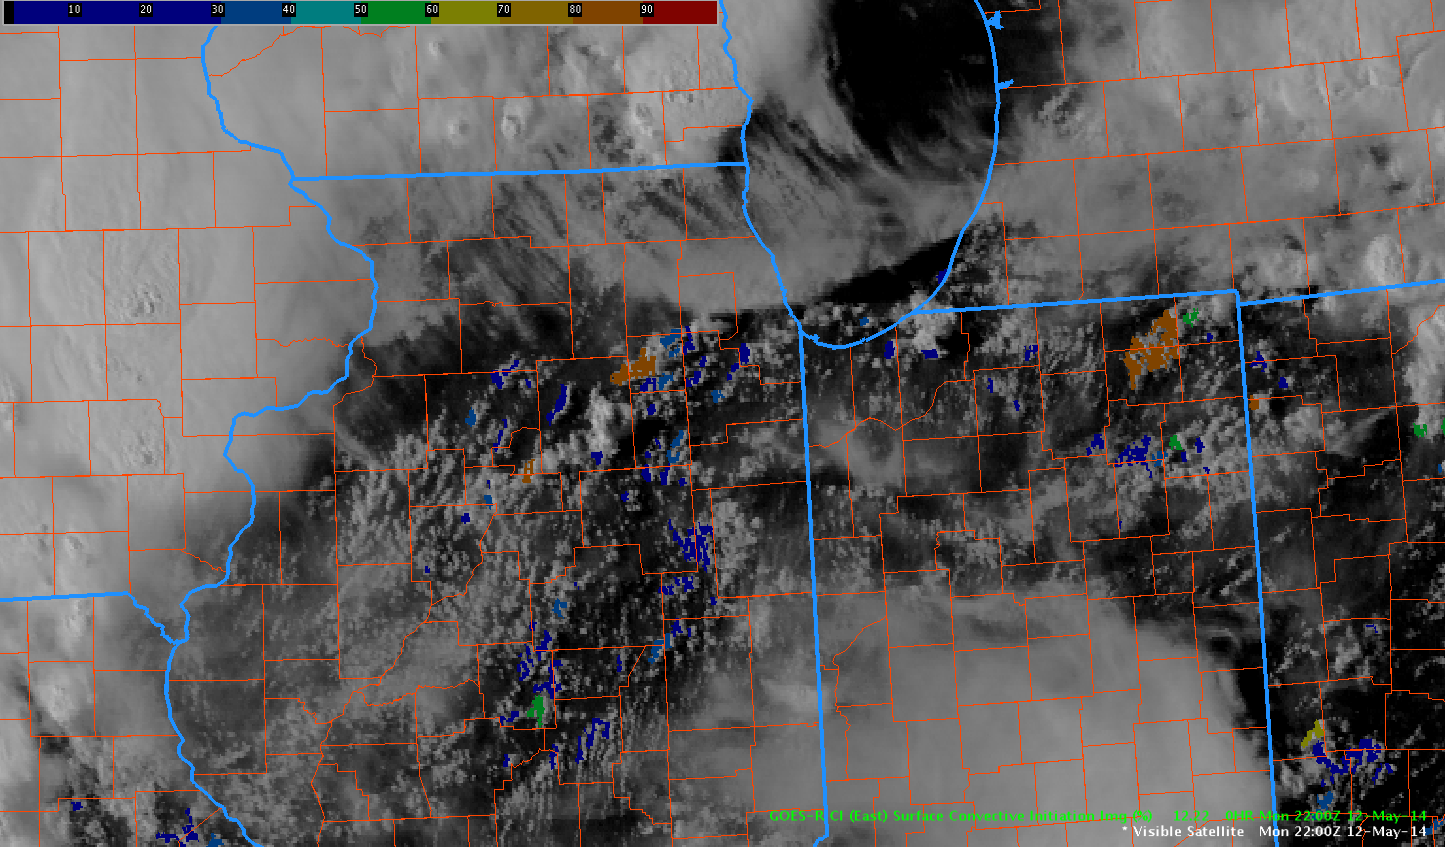
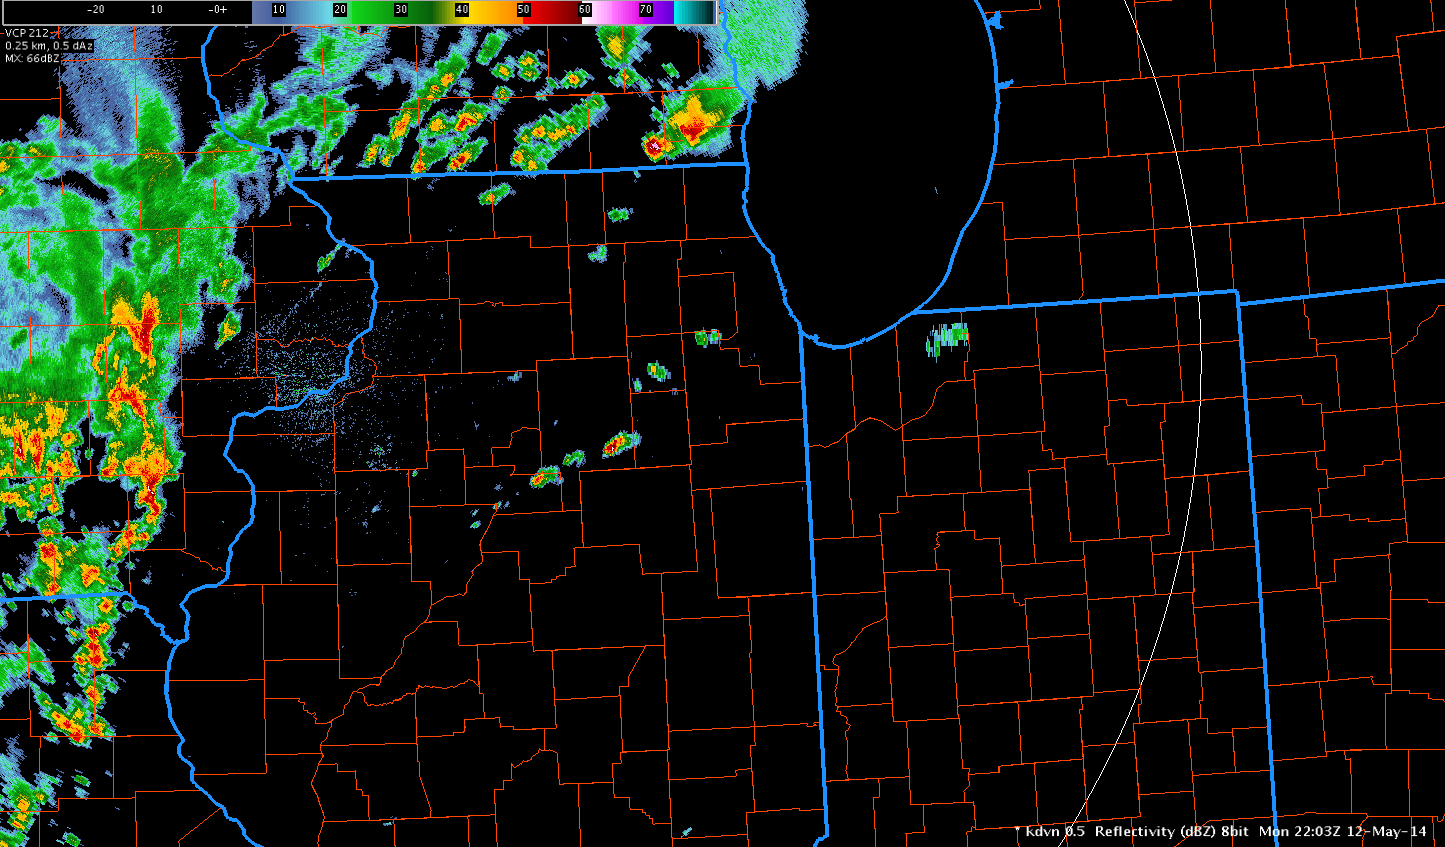
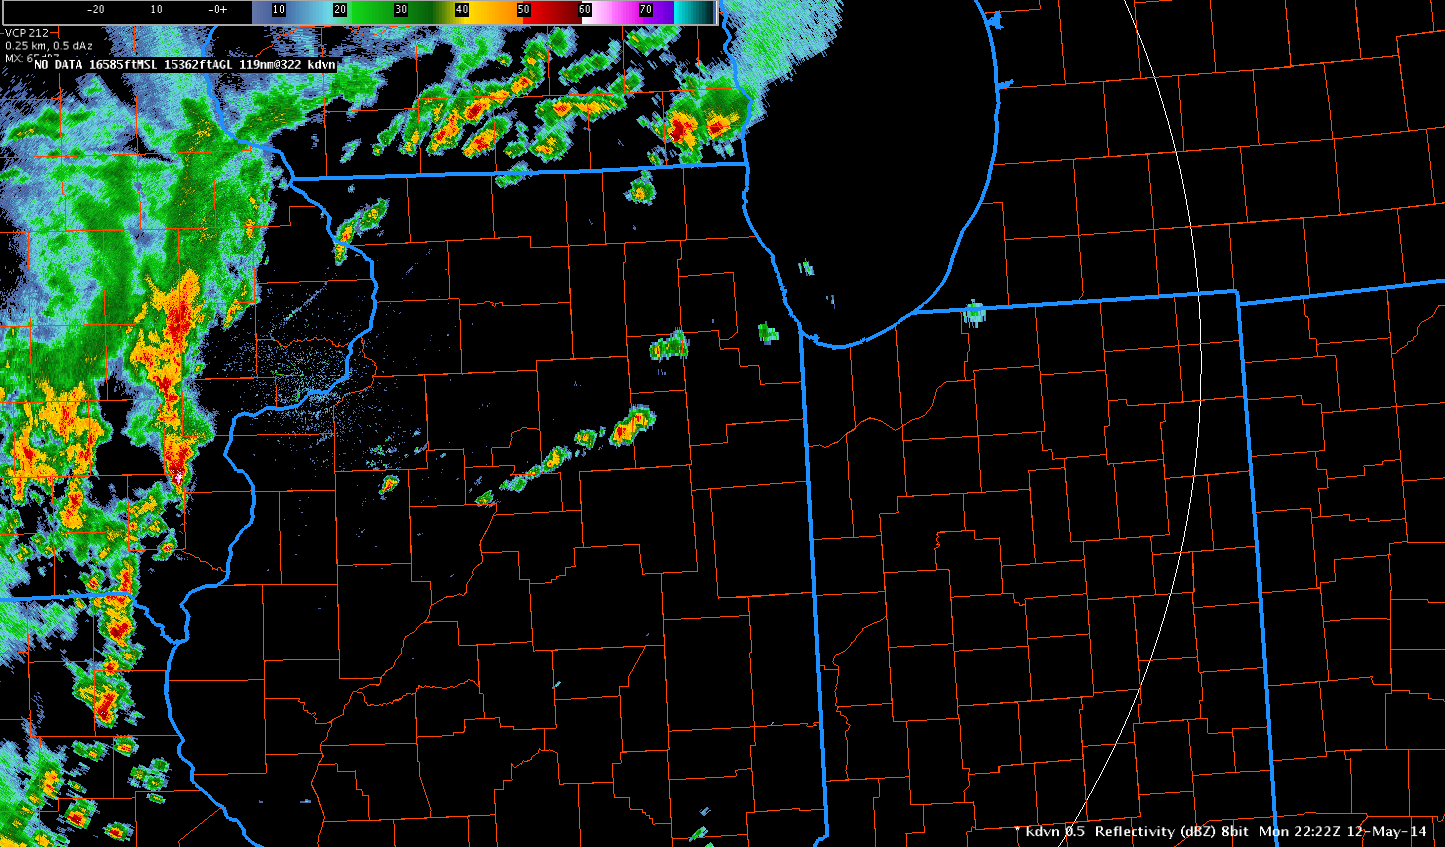
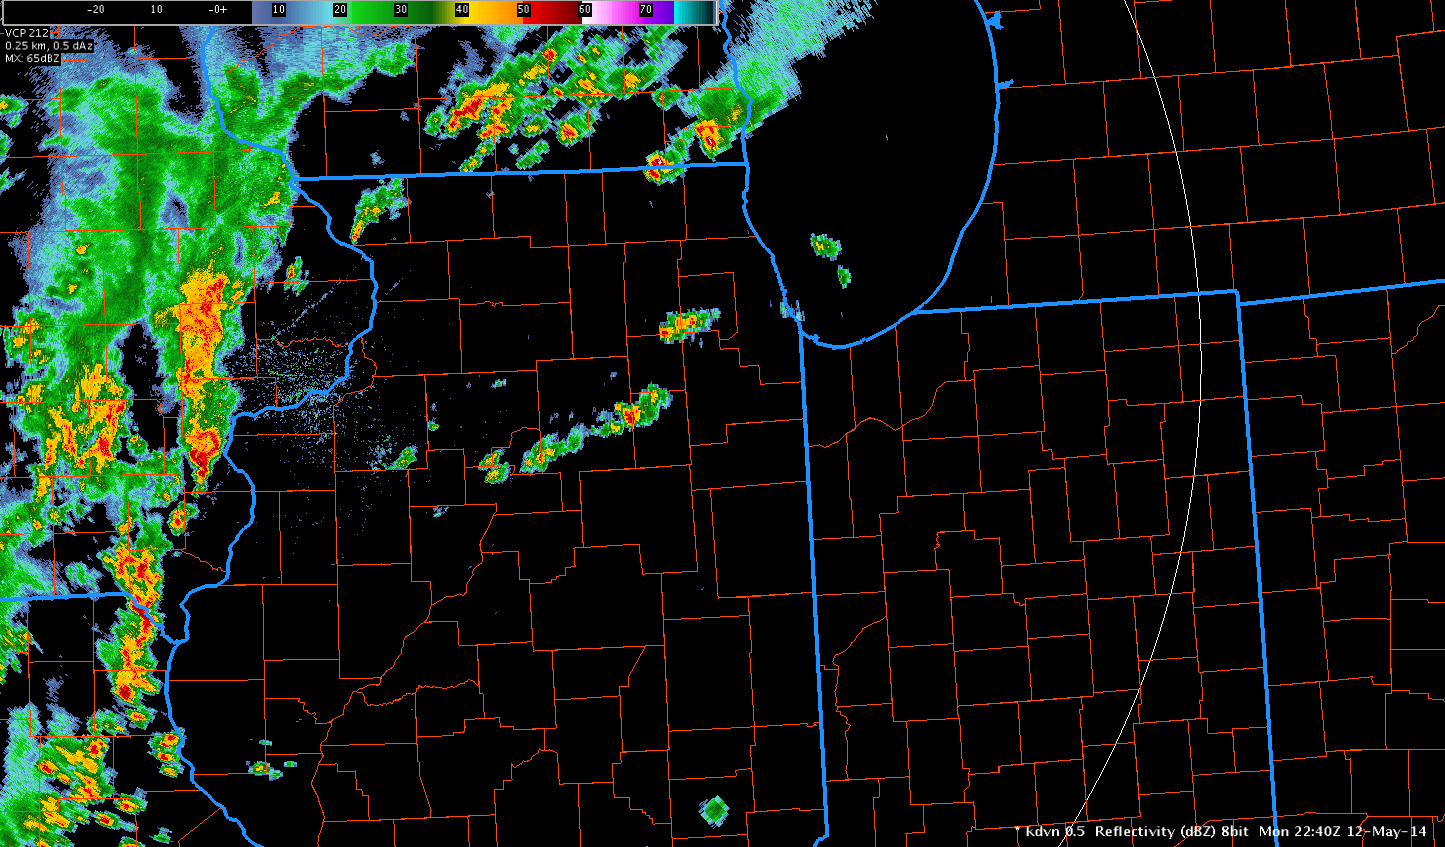
The GOES-R CI product did a fine job depicting convection growing in northern Illinois. The top image at 2145 UTC depicting values around 74% and the second image at 2200 UTC depicting 89%.  The radar images below at 2203, 2222, and 2240 UTC depicted a few developing showers and storms near the CI values below.   The product gave 15-45 minutes of storm lead time.  These storms did not become severe.VisibleCI2145UTC051214VisibleCI22UTC051214

KDVN2203UTC051214 KDVN2222UTC051214 KDVN2240UTC051214Michael Scotten

Tags: None

Value of 1-Minute Satellite Imagery

Monday, May 12, 2014 Mike Smith

Two situations worthy of note:

I “issued” a special weather statement for Winnebago Co. At 2:47pm for 3/4 inch hail and gusts to 40 kts. Using ONLY surface obs and 1-minute satellite data.

At 2:59pm, I issued a severe thunderstorm storm warning for the same county, based on a Fujita U with overshooting then collapsing top in 1-minute data.

NWS issued severe at 2:56pm (unknown to me). Both warnings verified with 1.75” and 2.0” hail reports.

I observed a downburst south of Sullivan, WI and based on the right moving cell, I thought the RFD would intensify at 4:12pm for Walworth Co. Predicted 55 kt and 2” hail. Unknown if it verified.

The right mover got more pronounced and at 4:22pm, I issued a tornado warning for the southeast third of Walworth Co. This was due to the wrapping pattern of the outflow air (into RFD), the 1-minute satellite U and collapsing top, the persistent right movement and high spectrum width in the inflow. NWS issued a tornado warning for the same area at 4:45pm. While a pronounced hook formed, it never quite formed a tight couplet.

satellitePromptedWarning


Tags: None

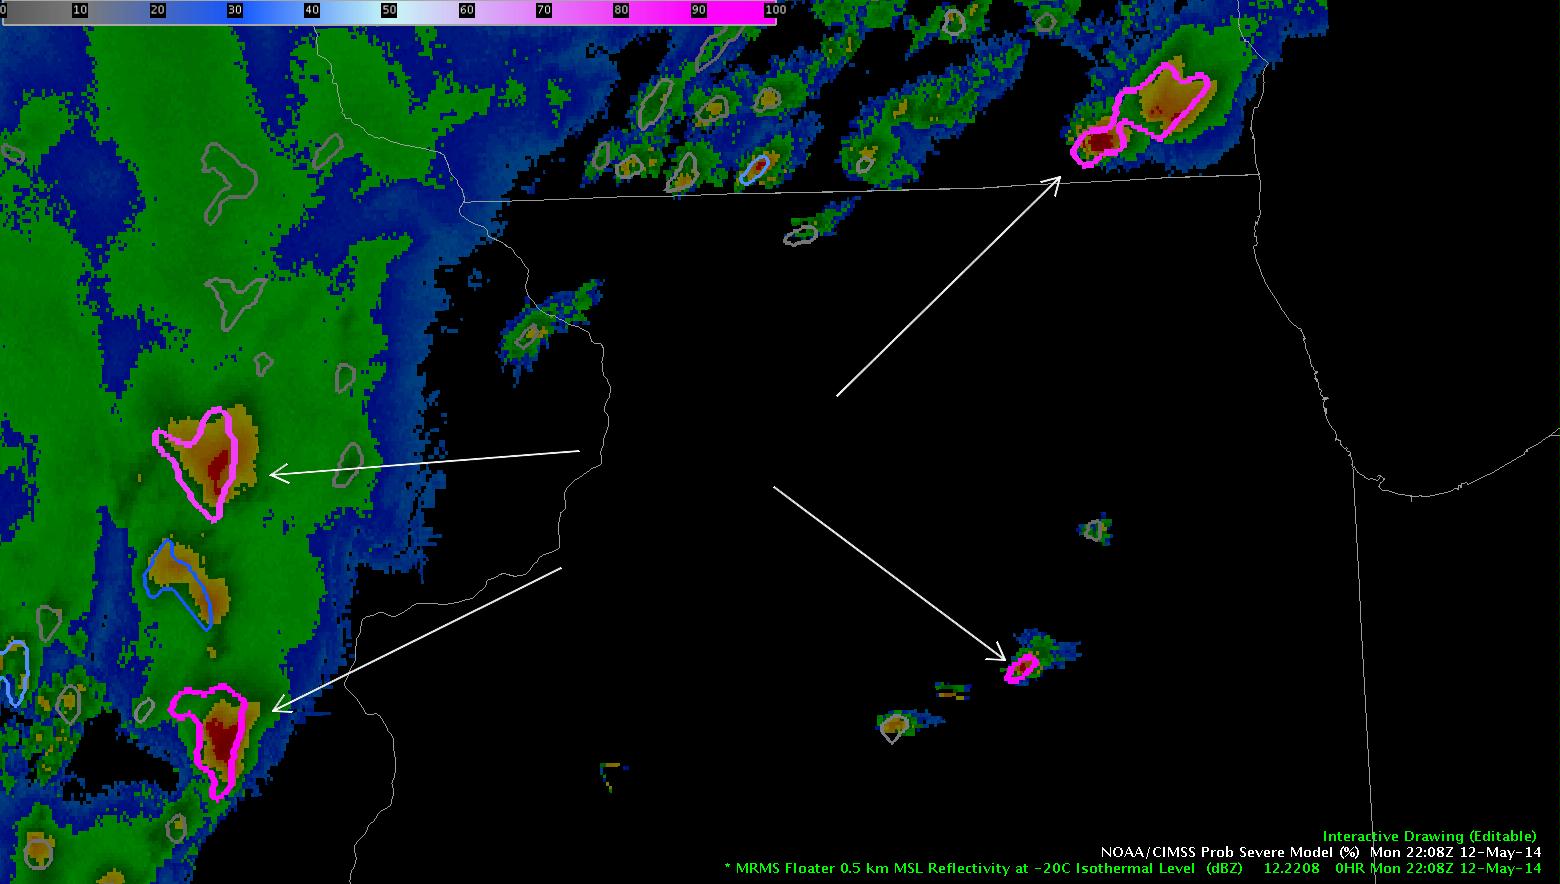
ProbSevere highlights strong cored storms. MRMS MESH seems overdone.

ProbSeverewithMRMSRefat-20cThe ProbSevere Model is doing a great job highlighting the strongest cells. In this image from 2208z the ProbSevere Model is overlaid on top of the MRMS reflectivity above the -20C isothermal level. The cells annotated with an arrow across eastern IA, southern WI, and north-central IL have 50dBz echoes above the -20C isotherm and the model indicates an 80+% prob of severe.

There were hail reports from three of the four cores highlighted. The lower left produced Quarter sized hail in Henry county IA with the MESH indicating 2.5in, The upper left storm produced reported penny sized hail in Johnson county IA with MESH of 0.89in and the upper right storm produced nickel sized hail in Racine county WI with a MESH of 1.13in. The MESH product is overdone in this example.

Shawn Smith


Tags: None

GOES14-SuperHiResVisible Shows Convective Trends 5/12

The Super Hi-Resolution Visible Satellite Imagery below depicted a differential heating boundary over northern Illinois, denoted by the green line.  Very little cumulus was observed north of the green line where cirrus cloud cover was thicker, while enhanced cumulus congestus was occurring south of the green line.  With low level south to southwest flow, cumulus that developed south of this boundary had a tendency to dissipate when moving north of the green line/boundary. A severe storm denoted by the orange circle in southeast Iowa was moving east northeast and seems to be moving along this boundary.  It will be interesting to see if this storm will continue to be severe over the next few hours.

GOES14SRSORVisible2155UTCMichael Scotten


Tags: None

LAPS nearcast for precip is a pretty good match

We worked with the LAPS 800 x 800 grid as it was centered over a portion of the Midwest, which was under a Severe Thunderstorm Watch until 8PM local time. The model’s maximum reflectivity product was pretty well matched up with radar at 19Z on May 12th for the area with a precip shield, and it even had a pretty good match with the areas of heavier intensity. The first image is of the LAPS max reflectivity product from its 18Z run, valid at 19Z:

LAPSmaxreflectivity19ZMay12

And here is the Davenport, IA radar base reflectivity, also at 19Z:

KDVNbaseref19ZMay12

Notice that the spatial coverage of the precipitation is a pretty close match over central and eastern Iowa at this time period. The model also correctly forecast a sort of “dividing line” between the eastern and western areas of precip. However, the intensity of the precip is a bit overdone on LAPS, especially in the cluster of storms on the left side. The heavier rain toward Iowa City did not materialize as of 19Z, though it was forecast by LAPS to have reflectivity above 50 dBZ.

However, as I continued to watch the radar in Iowa, I noticed some more convective cells developed in the region that the LAPS had predicted higher values of max reflectivity. So the timing was a bit off on the forecast of convective initiation and heavier precipitation. We’ll have to continue to watch this product throughout the week as other convective situations arise in order to see if it’s valuable for nowcasting.

Tags: None

ProbSevere Model Good Lead Time NE Missouri/SE Iowa border – Missing SRSOR Images

The ProbSevere Model indicated an 83% probability of a severe storm within an environment of 2968 J/Kg of MUCAPE and 34.6 kts of EBShear at 2020Z. It also indicated MESH of 1.07inch at this time. The following 2-minute resolution updates continued to show 80+% prob and 1 inch+ MESH as the storm tracked northeast from the NE Missouri/SW Iowa border into SW Iowa except for one frame at 2028z where it showed a 64% prob. WFO DMX issued a SVR at 2037z. ProbSevere may have helped give up to 17 minutes additional lead time if the warning was issued once the ProbSevere crossed above 80%. At the time of this post there were not yet any confirmed hail reports.5-12-2014-2020zProbSvr

Visible satellite data started to show a resemblance of an enhanced updraft on this storm at 2015z with a developing anvil and anvil shadowing at 2025z.  SRSOR VIS data was missing between 2011z and 2030z so had to use conventional visible images for the attached screen captures.
2015zvis2025zvisShawn Smith

EDIT: Missing GOES-14 SRSOR images were due to “daily housekeeping” – BL

Tags: None

Expanding Overshooting Tops Increase SVR Lead Time in Southern IA

The following images depicted the expansion in overshooting tops depicted by the CIMMS Auto Overshooting Tops Detection Algorithm 2015 to 2045 UTC May 12 across southern Iowa.

The first image had a small red blob in southwest Davis county at 2015 UTC, which greatly enlarged in area by 2025 UTC in the second image.   By 2030 UTC in the third image, the area split up into three blobs.  By 2037 UTC, the fourth image indicated four blobs with the two blobs to the northeast representing the fastest growth and expansion of the storm.  By 2045 UTC, the last image, three blobs were with this storm, possibly indicated that storm was intensifying or at least maintaining intensity.

A SVR was issued for Van Buren county, on the southeast part of the enclosed circular area, with the overshooting tops blobs at 2037 UTC.  A 60 mph gust along with heavy rainfall and low visibility was observed in the warned area at 2127 UTC. The great expansion and splitting of blobs indicated by the Auto Overshooting Top Detection Algorithm could have increased SVR lead time another 10-30 minutes.

OvershootingTops2015UTC120514


OvershootingTops2025UTC120514 OvershootingTops2030UTC120514 OvershootingTops2037UTC120514 OvershootingTops2045UTC120514

Michael Scotten

Tags: None

vLAPS Slightly Overdone in MO Monday – 20Z

vLAPS Surface Maximum Reflectivity
vLAPS simulated surface reflectivity versus observed radar

While awaiting convection in my CWA (St. Louis), I used the vLAPS model to diagnose the potential for pre-frontal convection across my CWA.  These images depict the model-derived reflectivity versus the observed radar at 21Z Monday May 12th.  The model is quite a bit overdone with the convection in the warm sector in Missouri (although perhaps being on the edge of the model domain may be affecting this to some extent…).


-Deitsch

Tags: None