Simulated satellite imagery did not perform too well today on May 13. The simulated imagery seemed to be too slow with the development of storms over the Great Lakes, and depicted too much convection across the Mid Atlantic states at 2200 UTC (second image). Deep moisture indicated by water vapor satellite moved east faster than simulated.
Convective Initiation Product over eastern West Virginia
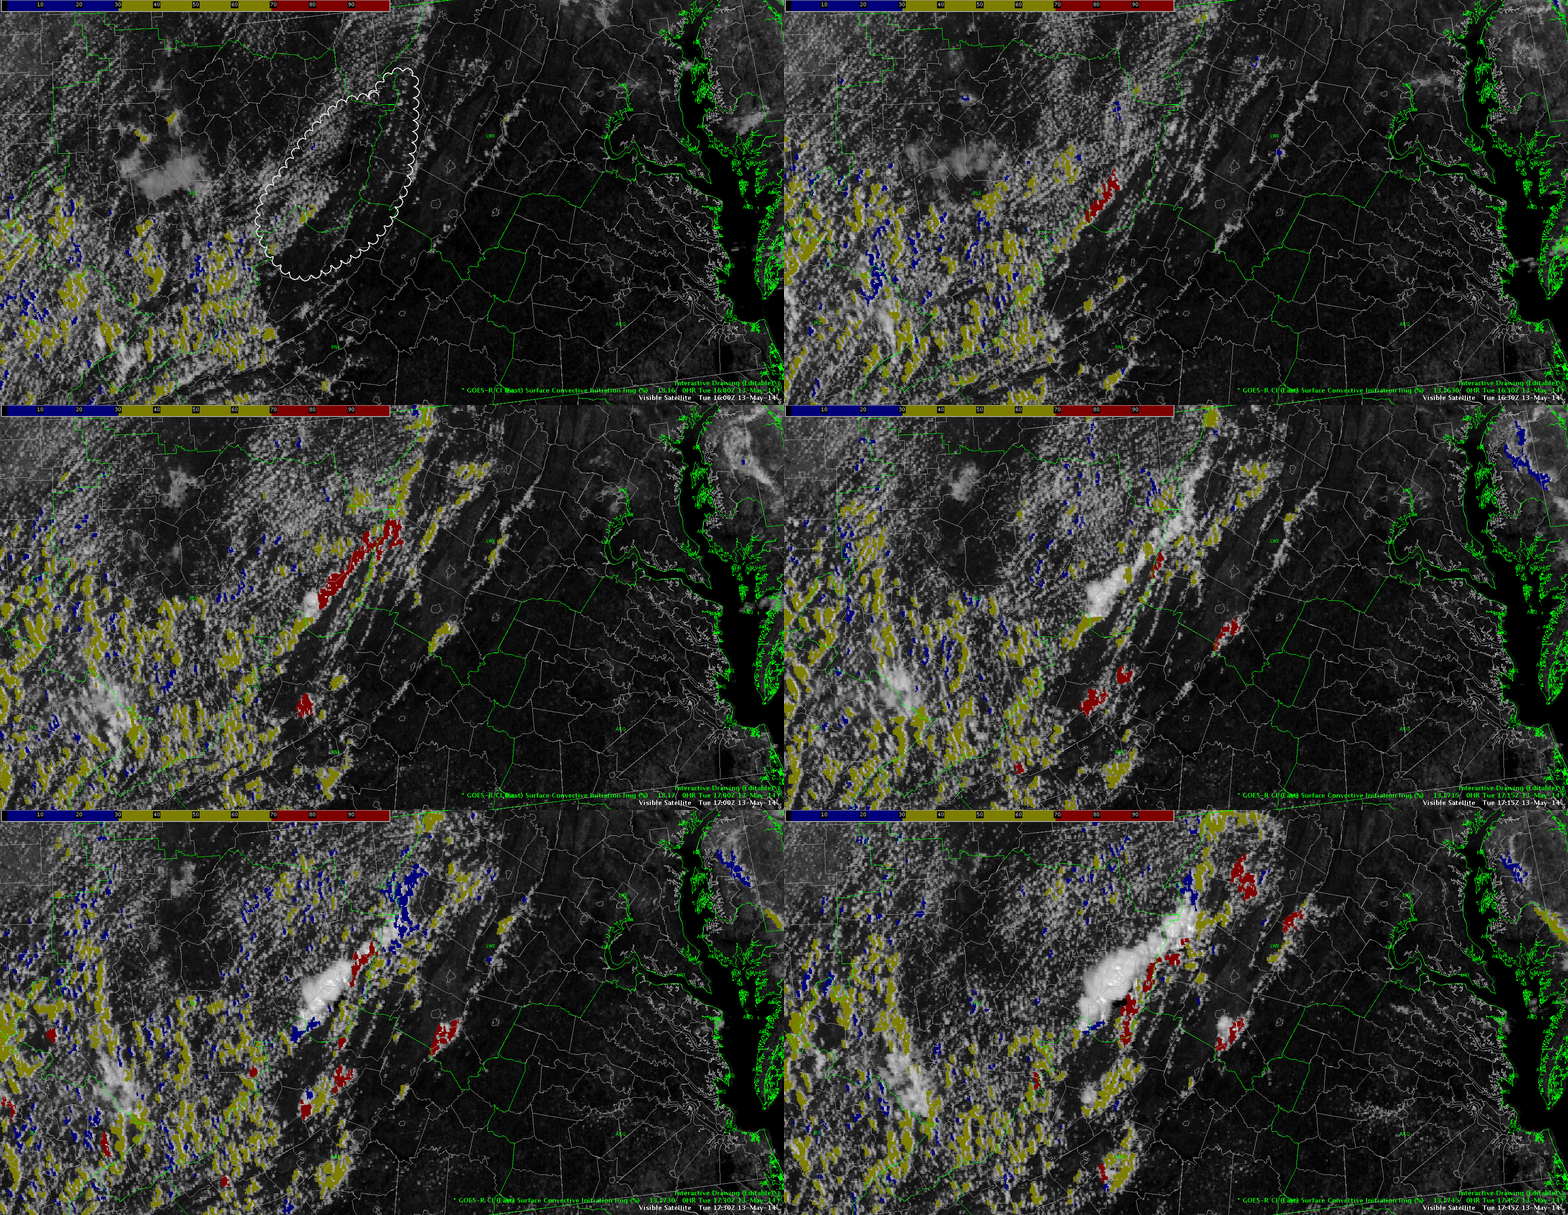
Click the image for an animated loop of GOES East visible imagery between 16z and 1745z along with the Convective Initiation product.
The color scale on the convective initiation product has been adjusted to three colors to simplify identification of the various probabilities. Blue is a 0-30% probability, Yellow is a 31-70% Probability and Red is 70% to 100%. I feel this helps to show increasing probabilities better than the standard multi-color scale. In the looping image notice the outlined area over eastern W. Virginia to the west of the Shenandoah Valley. Watch how the CI product shows increasing probs starting at 1615z along a ridge top 30 to 45 minutes before a line of thunderstorms exploded along the ridgeline. This product also highlighted these storms about 3 hours before a Satellite Precipitation Estimate message was issued by NESDIS. (1907z)
Shawn Smith
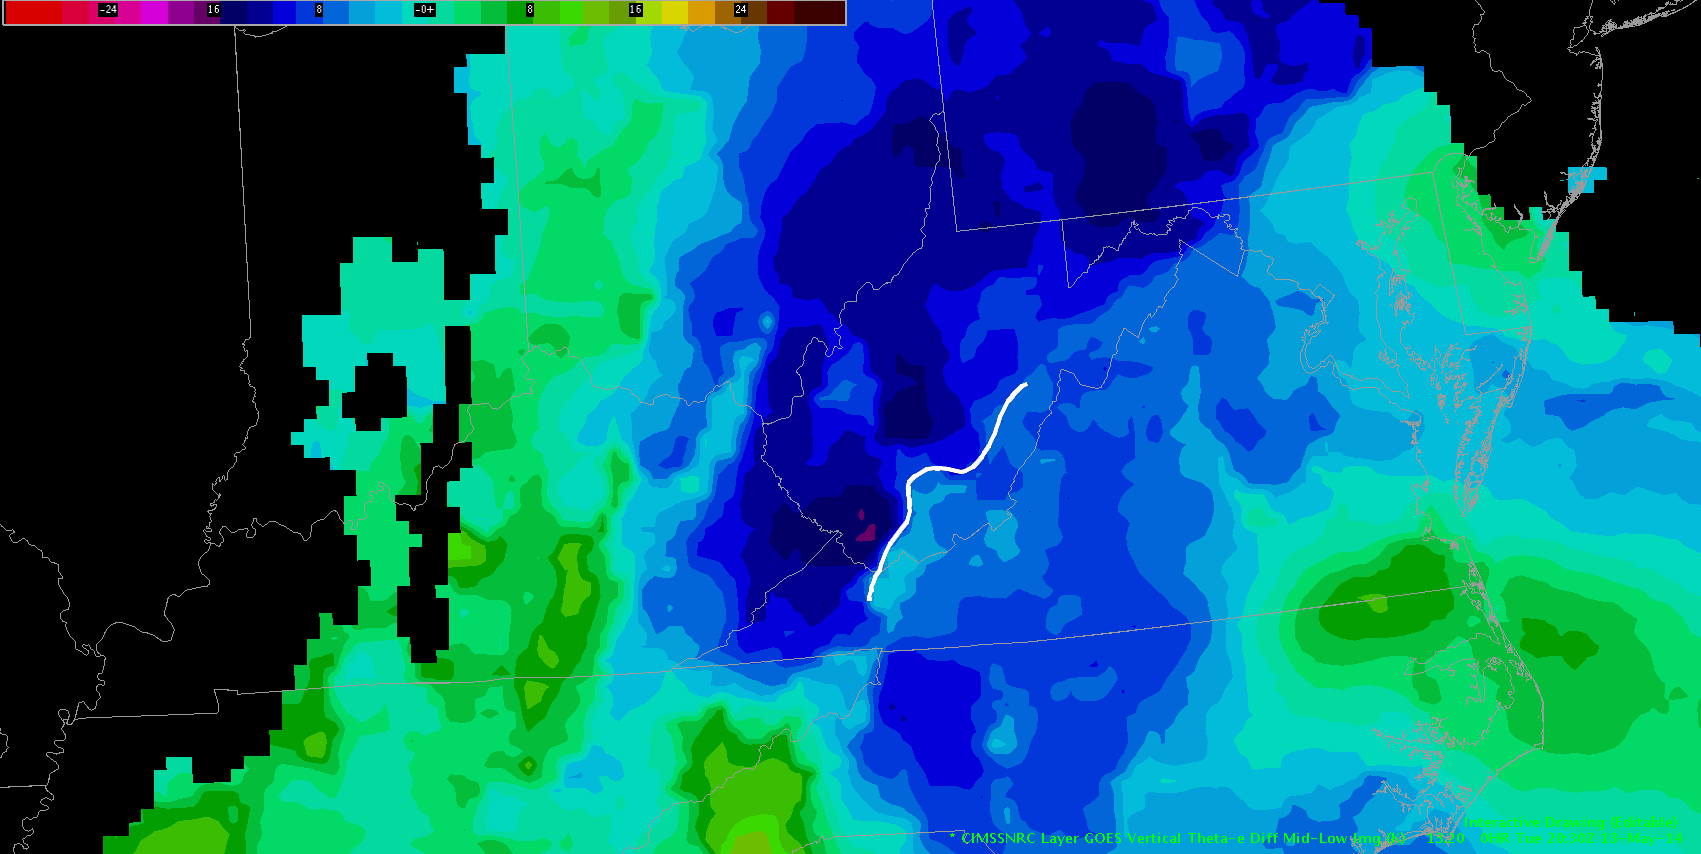
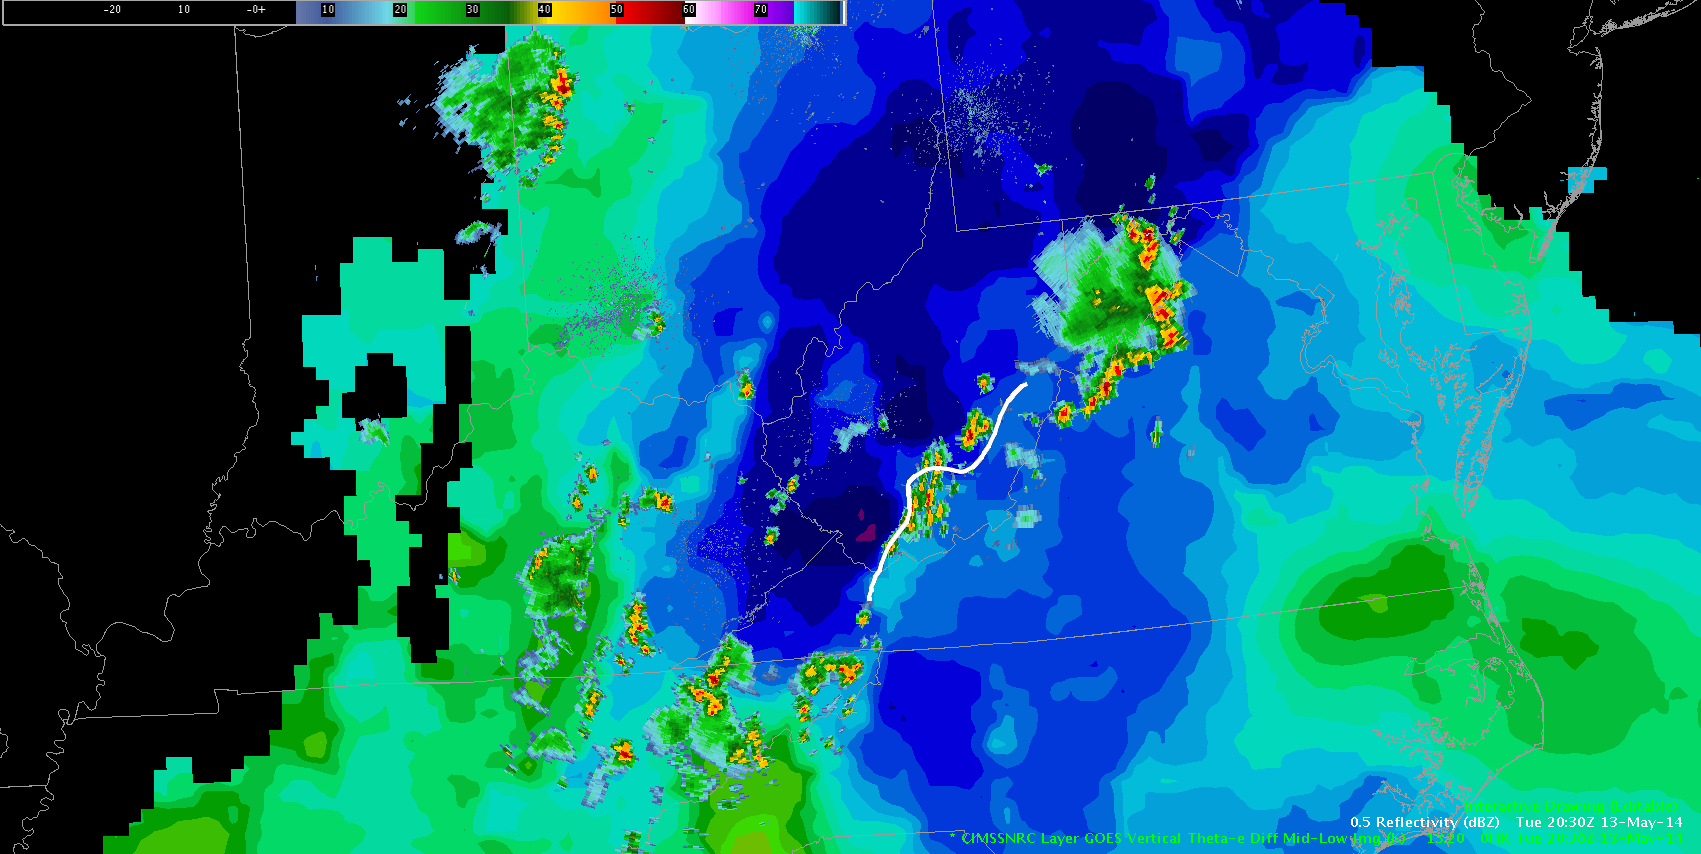
Tuesday 2030Z – NearCast Analysis


This post shows how the Nearcast model did well in depicting a weak north/northwest moving boundary that initiated convection in southwestern WV. In a rather “pulsey” environment, the ability to pick out this boundary aided in confidence as to where convection was going to form. Definitely a good tool to use in conditions where forcing is subtle and there is uncertainty on location on CI.
-Deitsch
NearCast – Decreasing 780 mb Theta E = Weakening Storms in NW OH
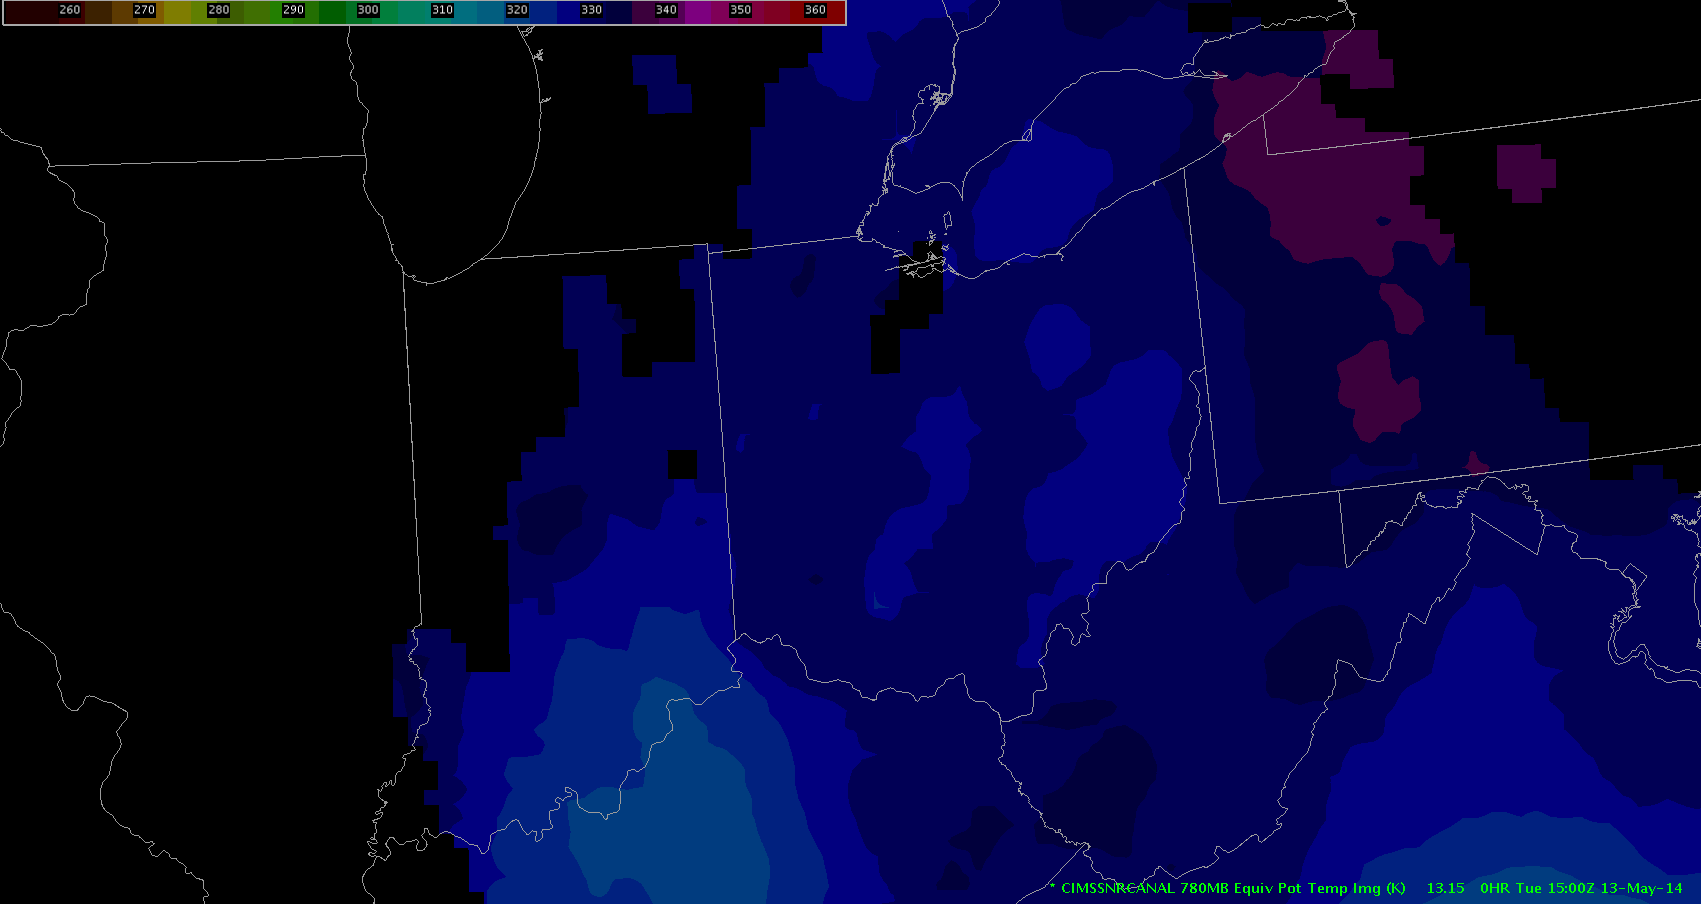
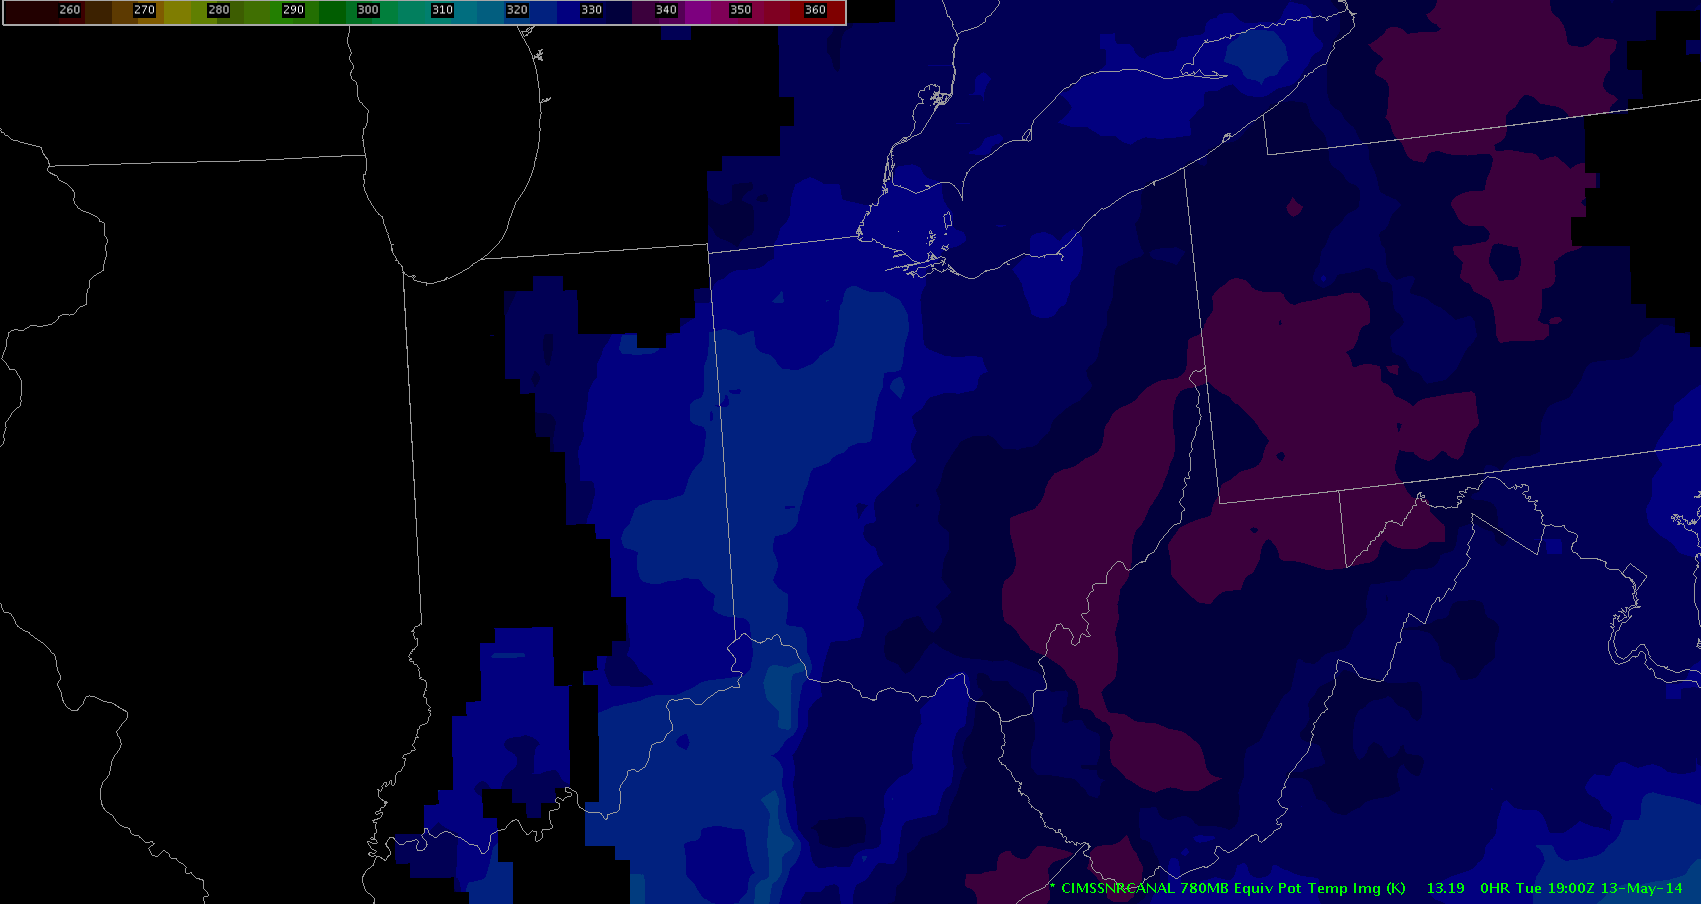
CIMSS NearCast 780mb Theta E product depicted decreasing values from 15 UTC (first image – around 329 K in NW OH) to 19 UTC (second image – around 327 K in NW OH) on May 13. Storms seemed to decrease in coverage and intensity 18-20 UTC in NW OH. The decrease in mid level moisture around 780 mb may have caused the decrease in storm coverage and intensity. The GOES Vertical Theta-e Differential Mid-Low product showed an increase 15 to 19 UTC from -5 K to +1 K, which may have helped to cause the decrease in storm coverage and intensity.
Michael Scotten
GOES-R Convection Initiation NW OH
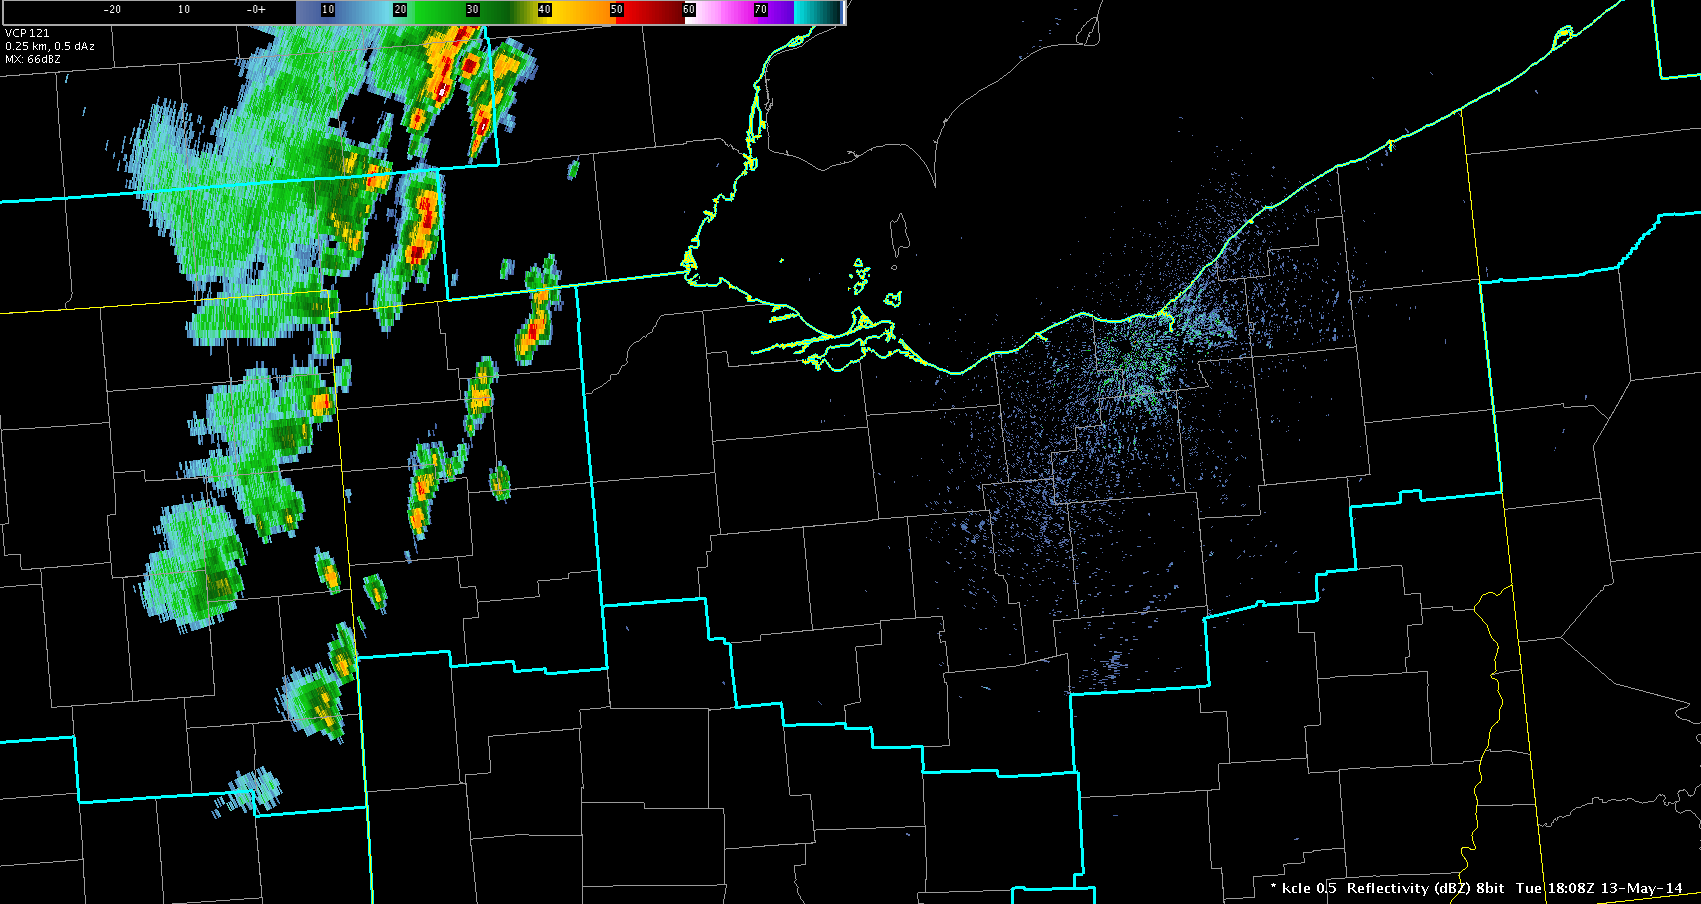
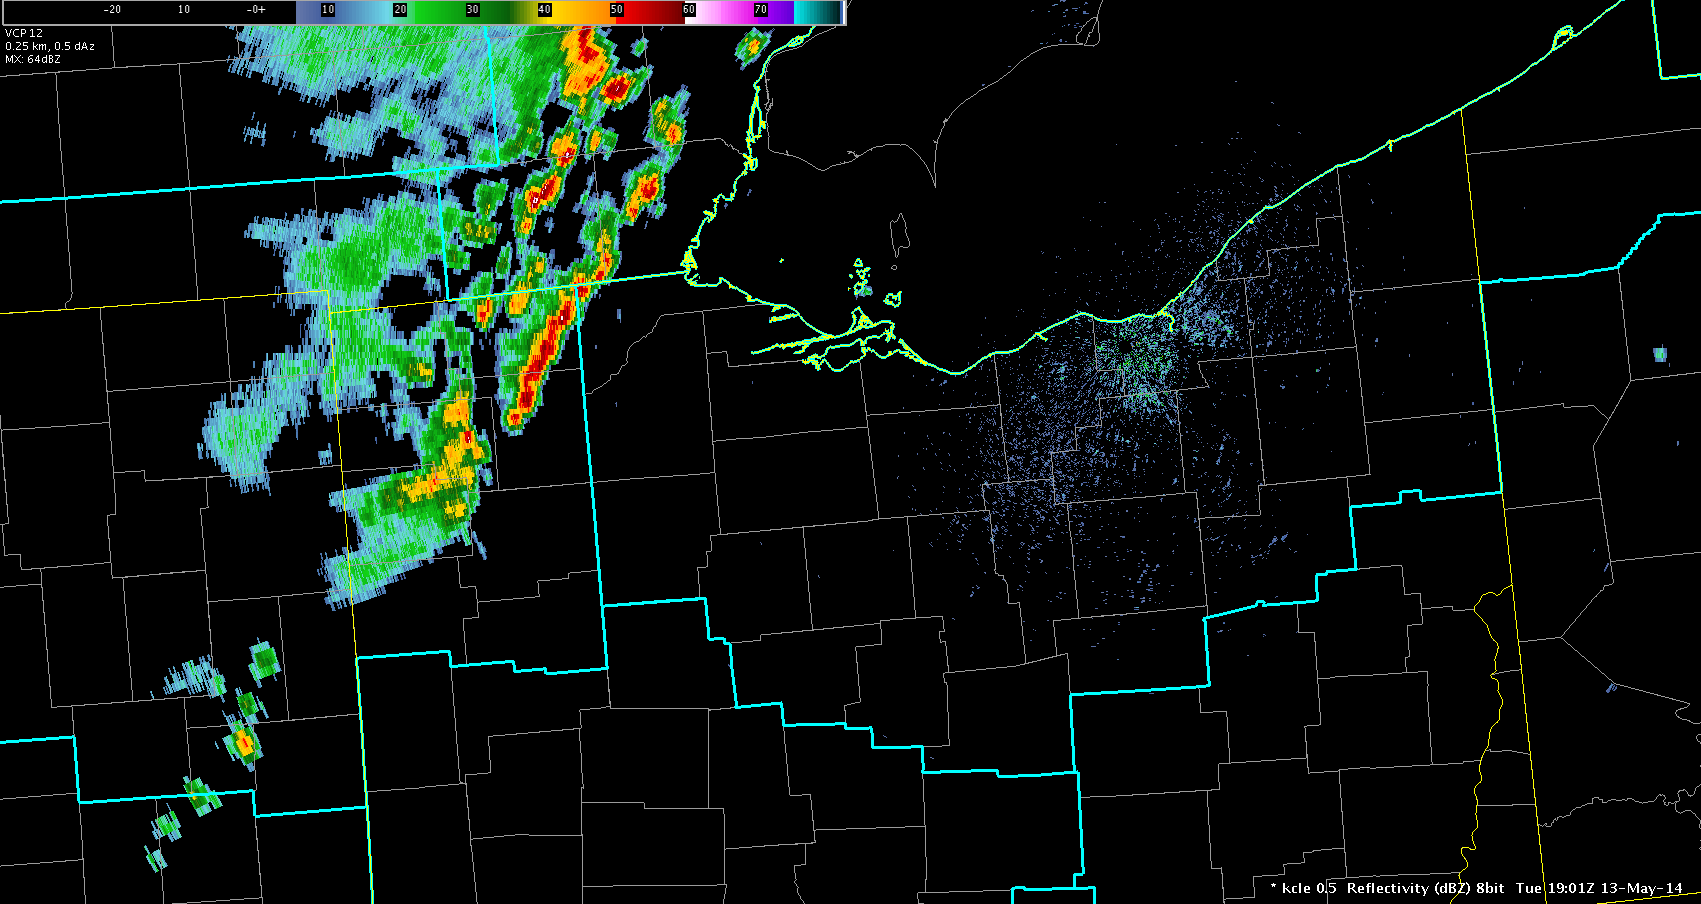
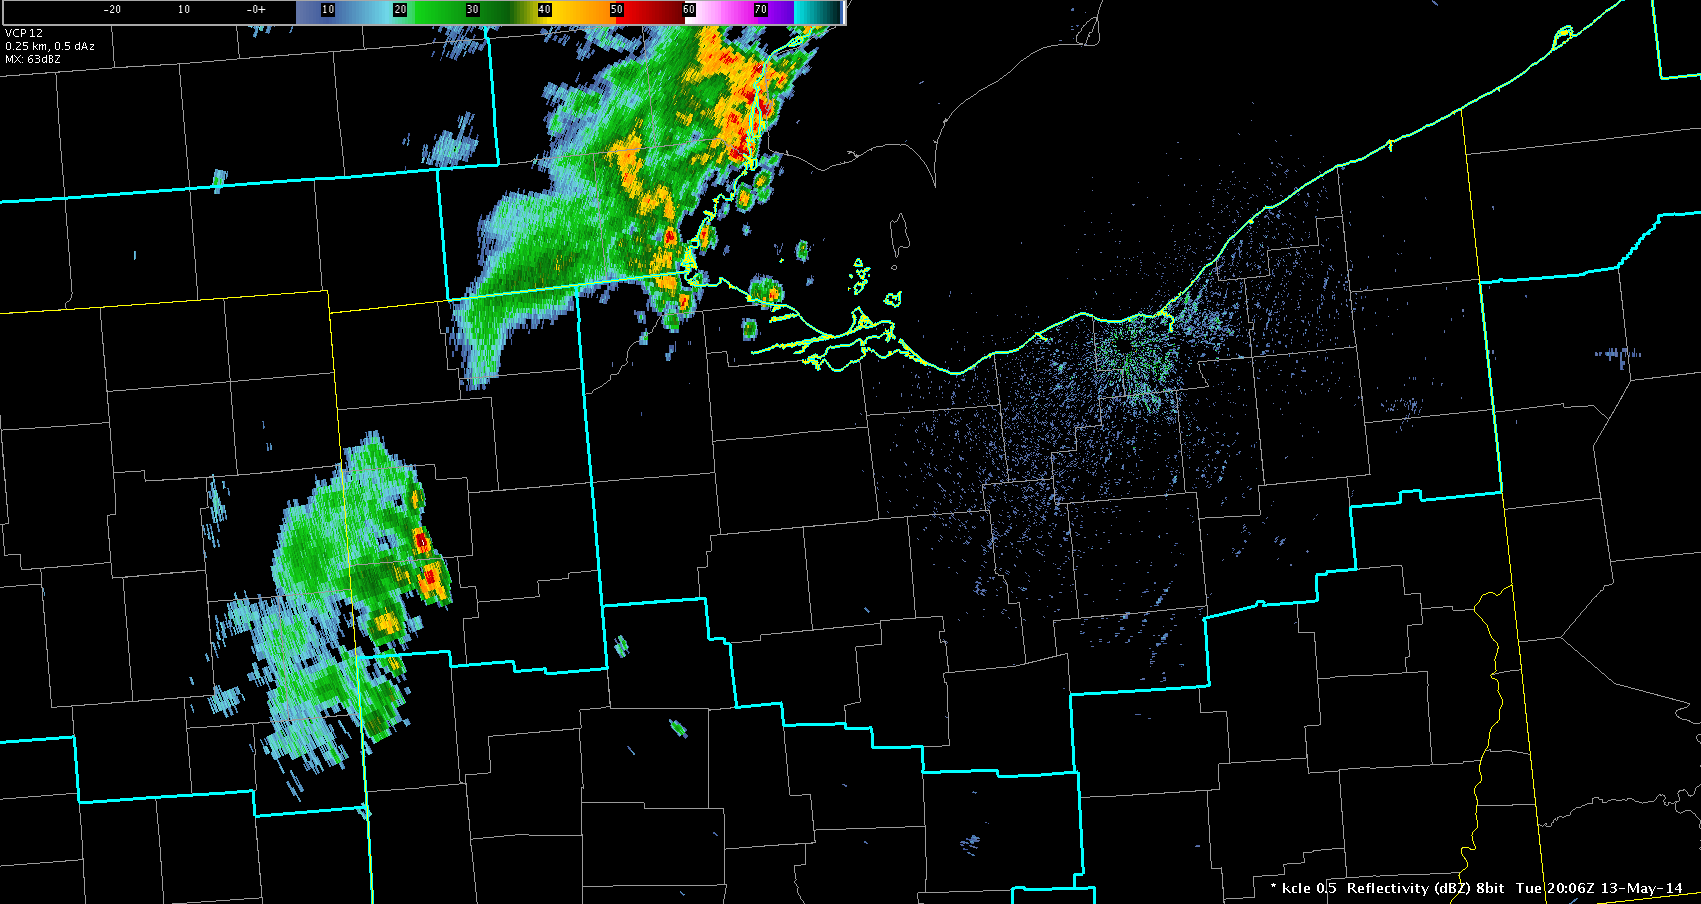
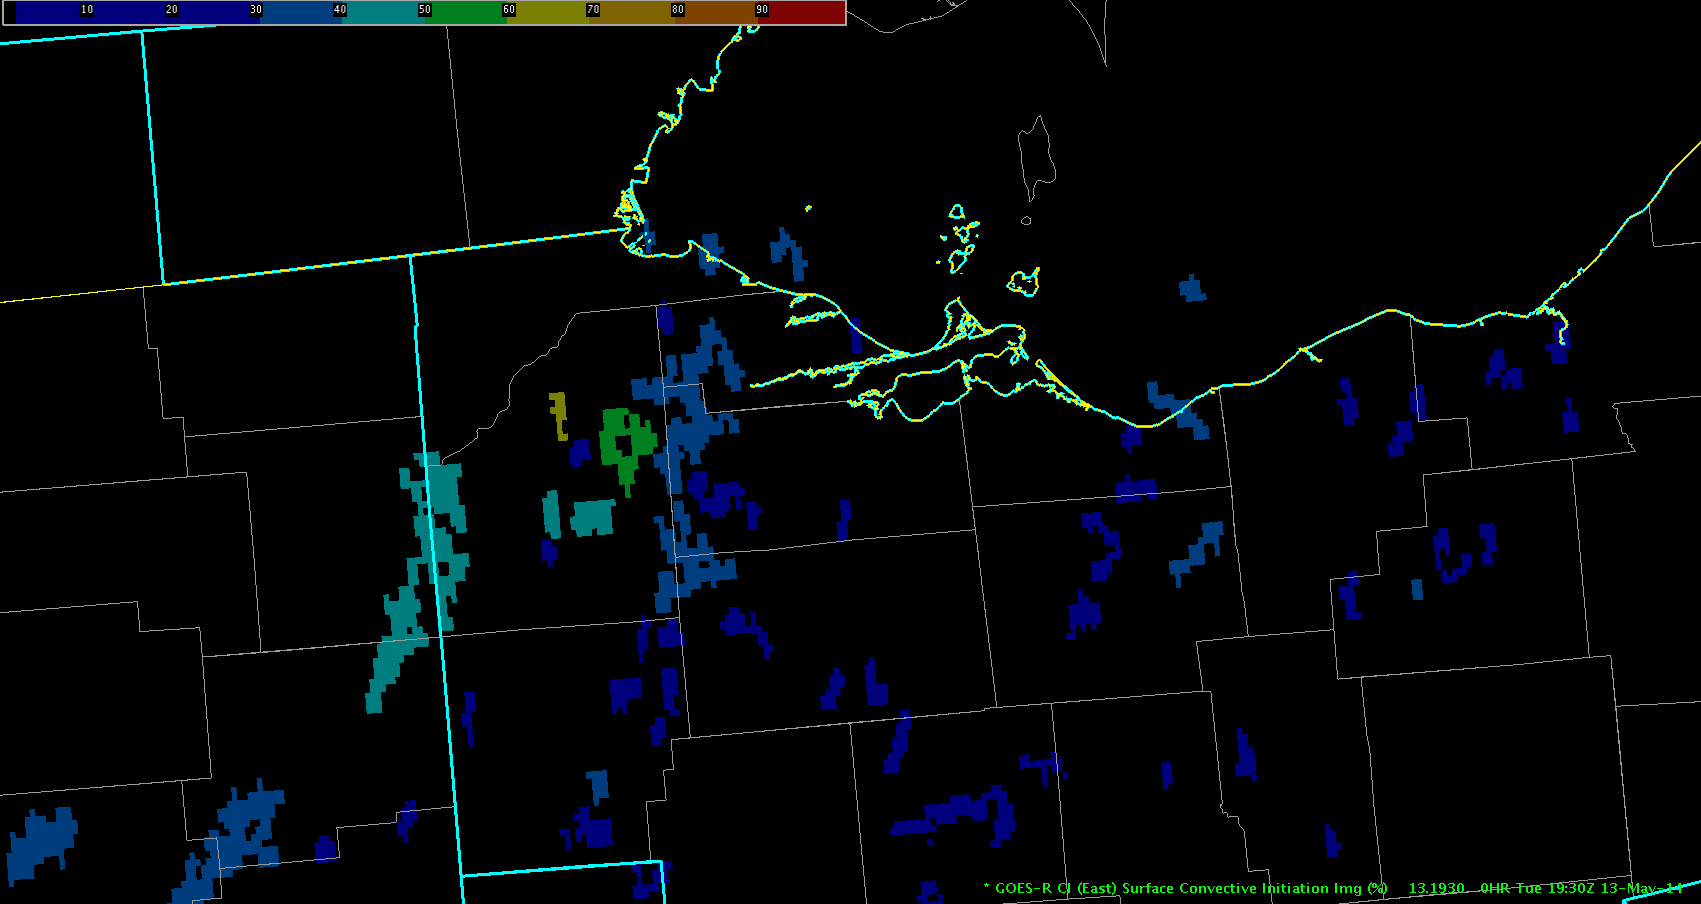
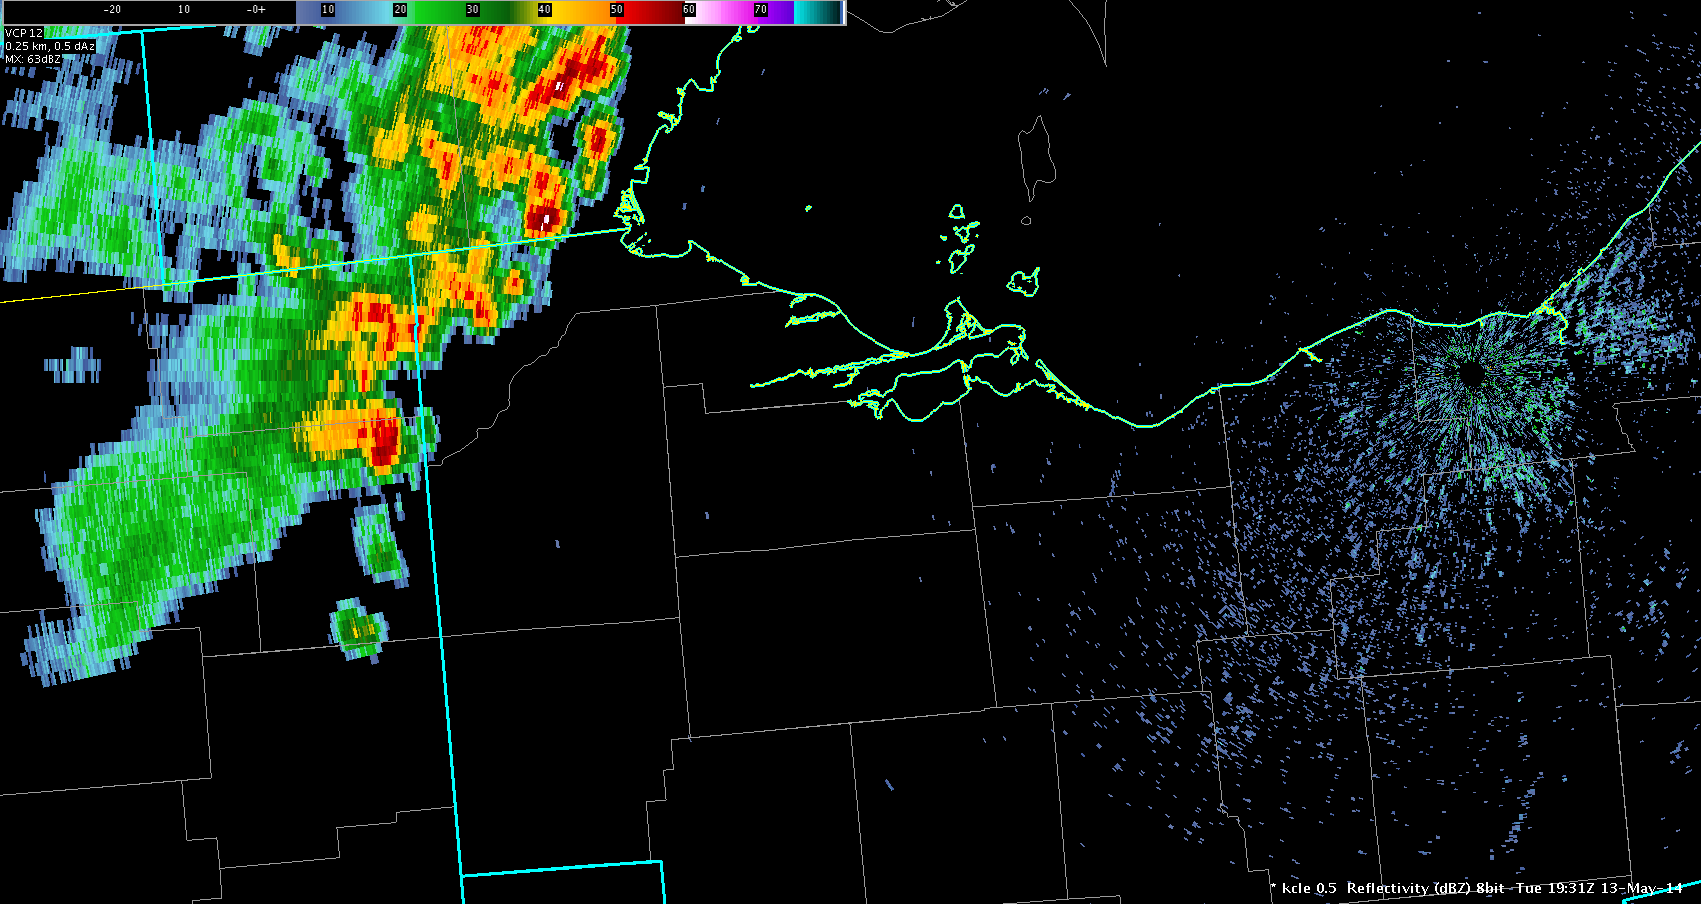
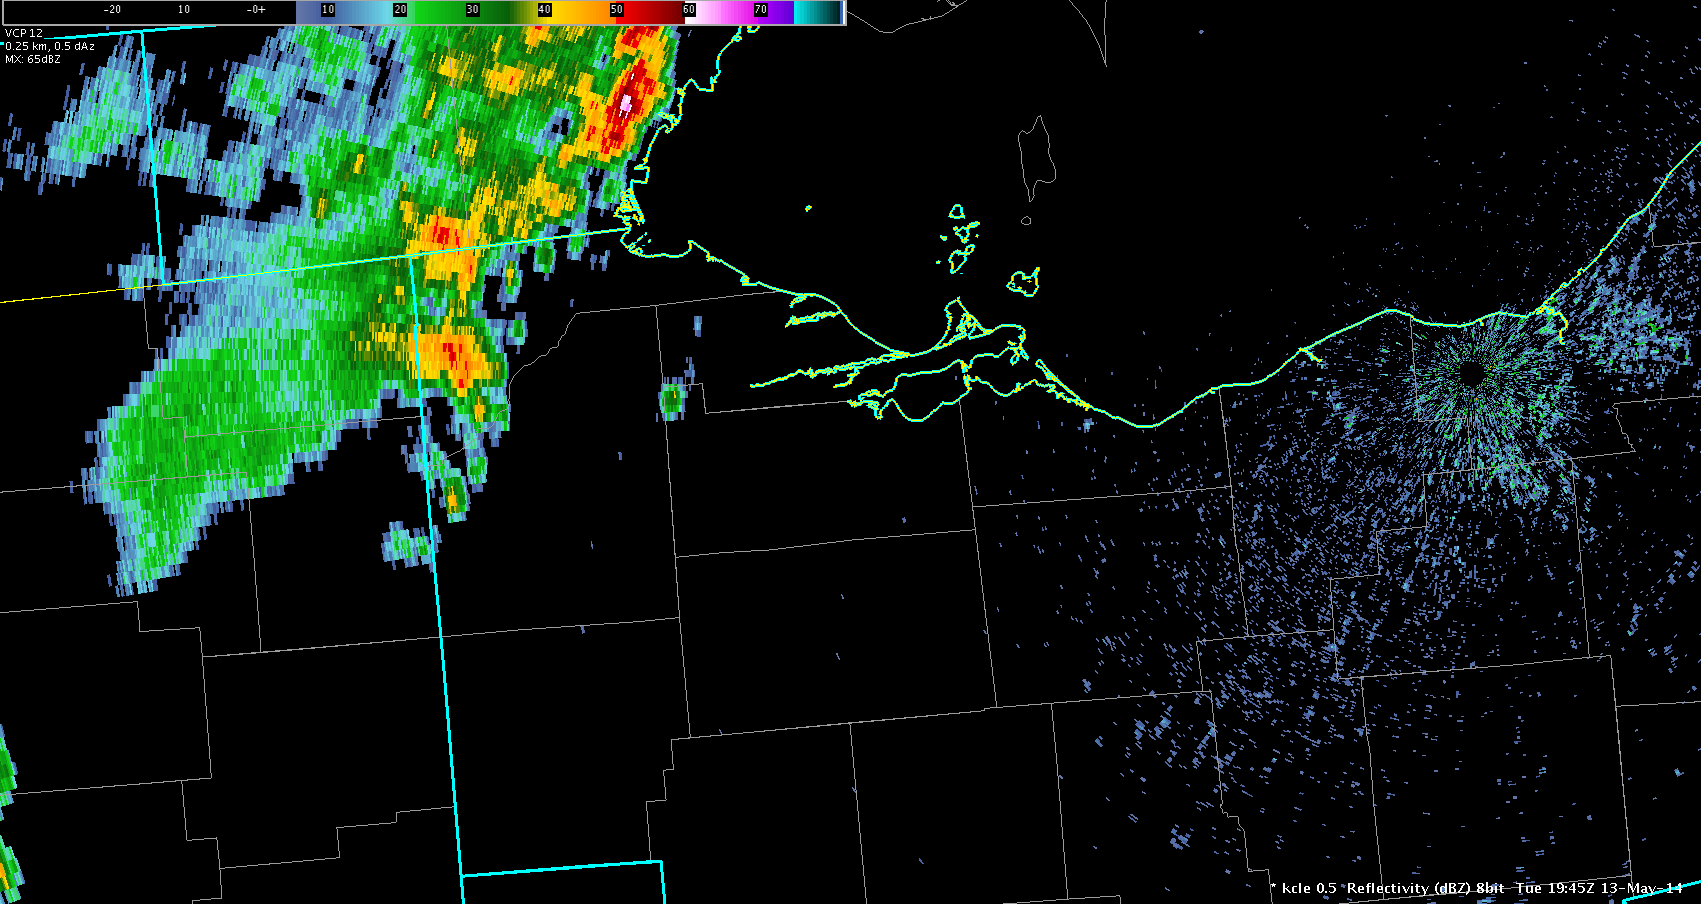
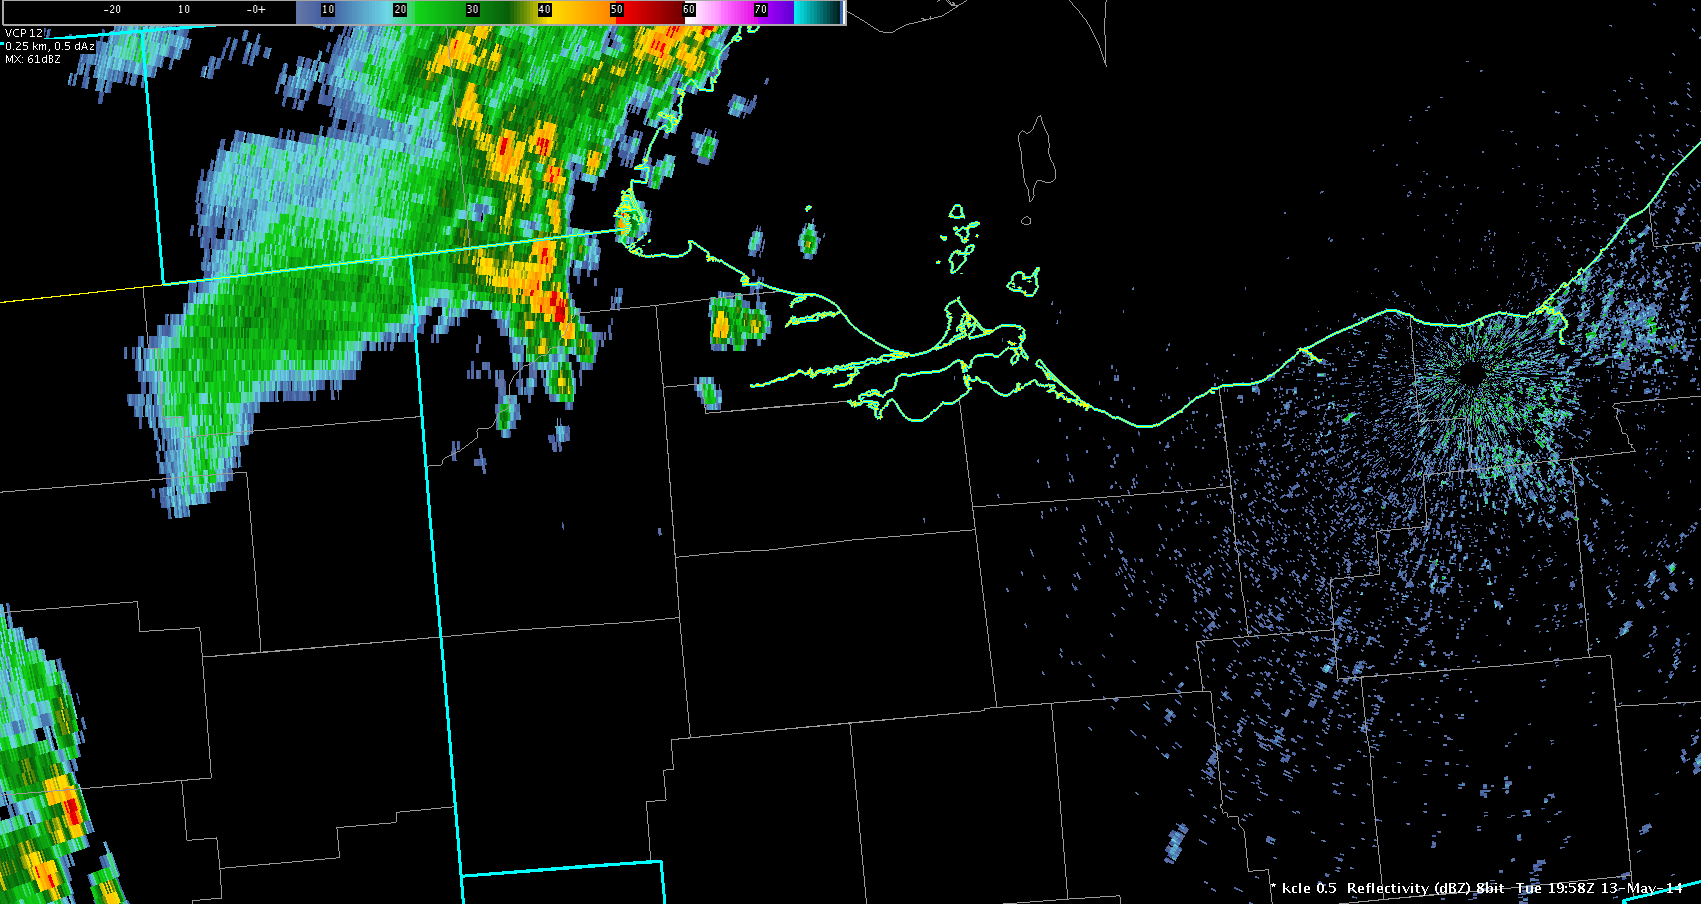
The 1930 UTC GOES-R Convective Initiation image on May 13, 2014 depicted yellow (65%), green (58%), light blue (46%), and several darker blue pixels (less than 40%) across northwest Ohio ahead of a line of storms. There was a small cell that developed near the green pixel at 1945 UTC (third image below) moved northeast at 1958 UTC (fourth image below). A cell developed and moved into the yellow and light blue pixel areas at both the 1945 UTC and 1958 UTC images below.
This product seems to do a good job highlighting higher potential areas for convection initiation (if 50% or greater) compared to lower chances (50% or less).
Tuesday – 1945Z vLAPS Analysis


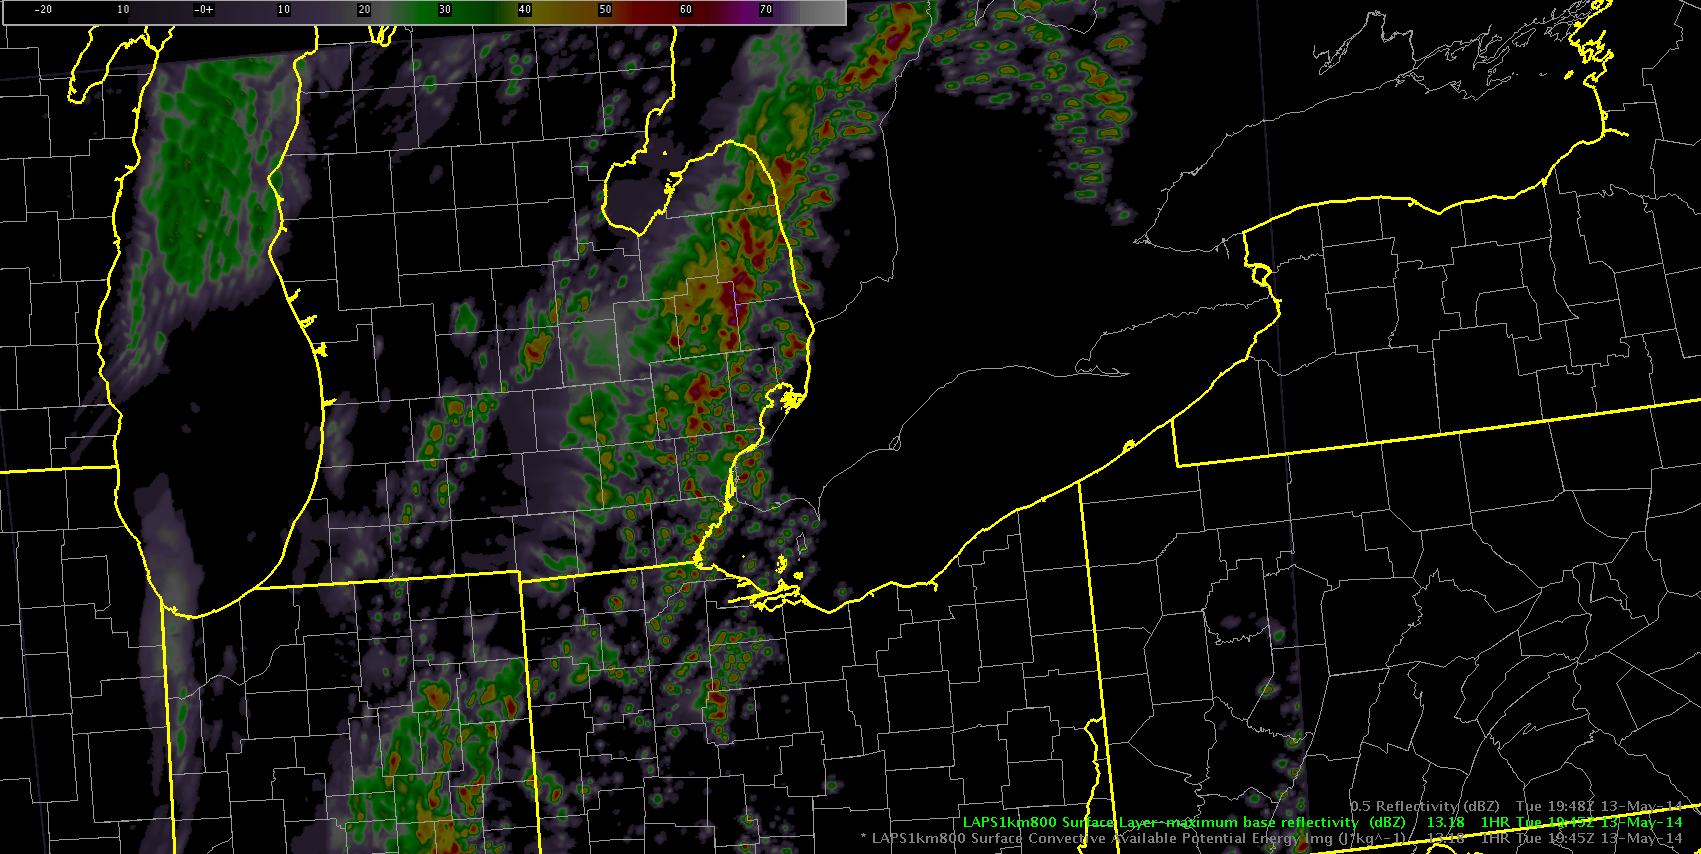
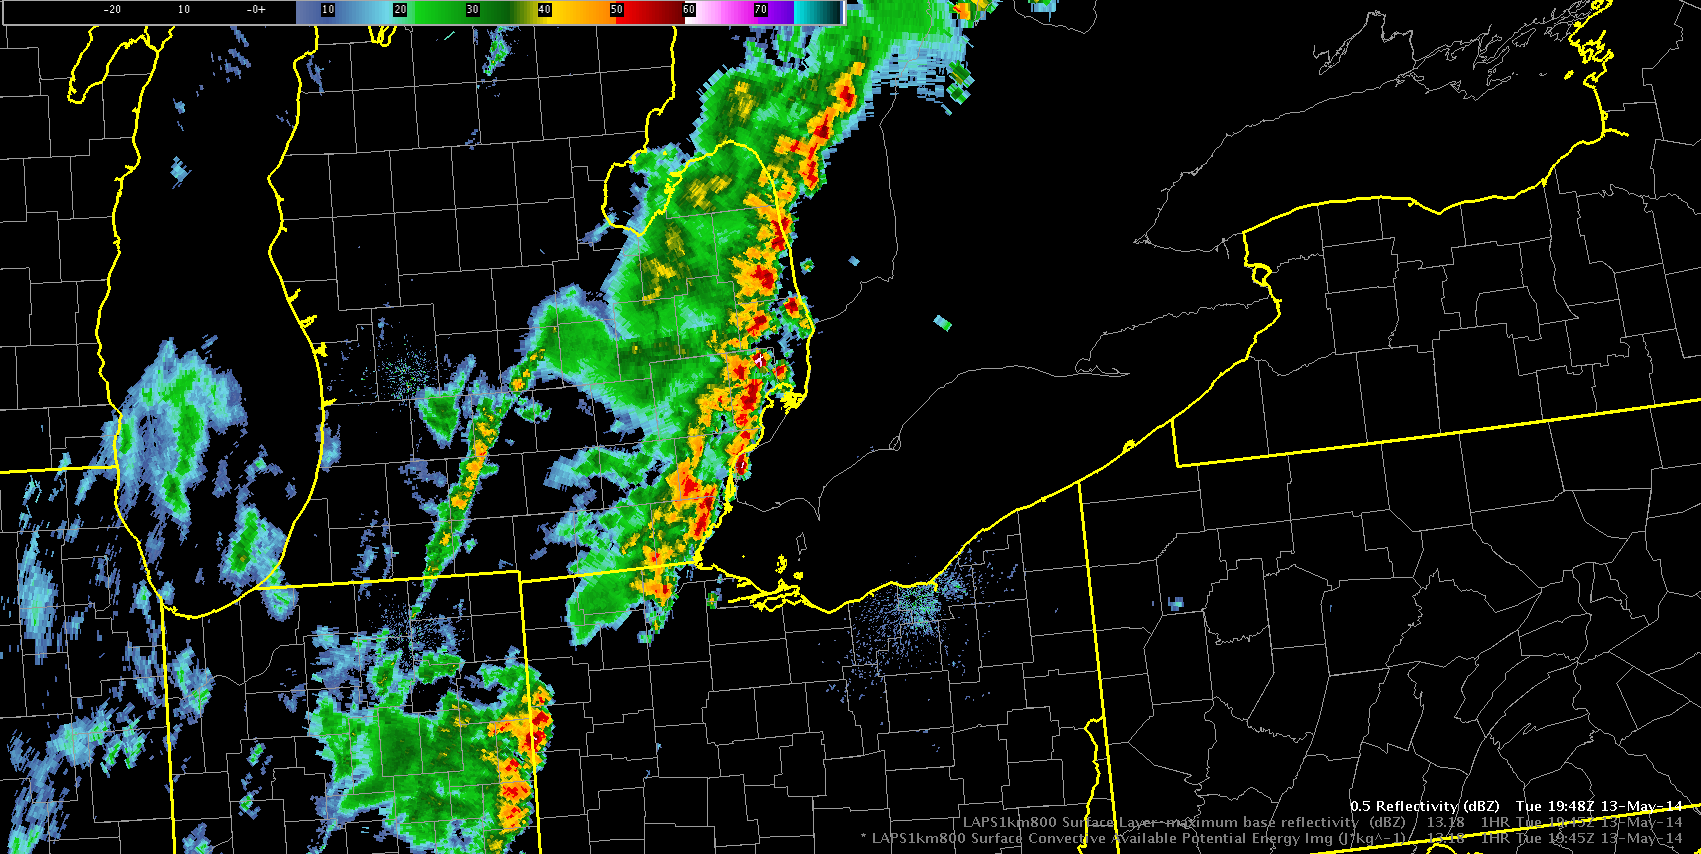
Overall, the vLAPS is performing a bit better today. It’s still a bit too slow with the linear band of convection, again likely not catching the cold pool that has accelerated east with the convection in reality. But it does hint at storm structure, with generally a disorganized line with some embedded bowing structures, some of which have been severe given decent low-level lapse rates and inverted-v soundings. So overall, it’s done pretty well and certainly useful in an operational setting.
Tuesday 19Z – NSSL WRF Simulated Imagery

Just a quick blog update to show how the NSSL simulated satellite imagery is behaving. It is not doing all that well, unfortunately. It seems well overdone across central Indiana, where outflow from earlier storms has undercut convection and largely caused it to die out. In our area of the day (Detroit CWA), the convection is well underdone. We have ongoing strong to locally severe storms, that the model does not have a handle on at all.
-Deitsch
vLAPS/HRRR/Radar Comparison
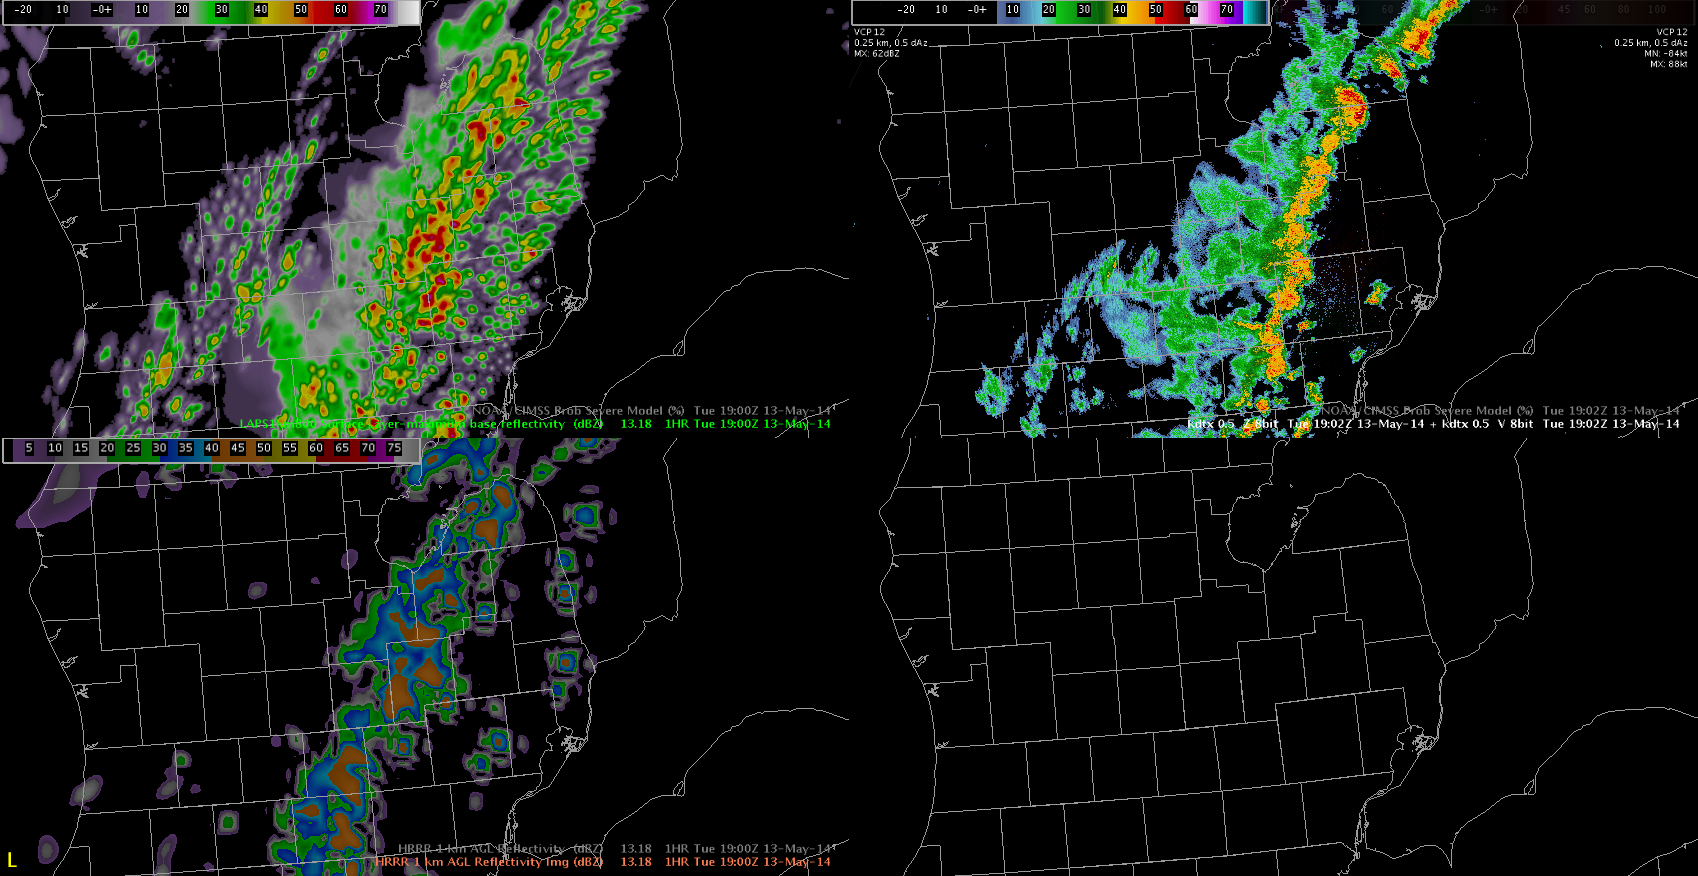
Here is a screen shot from 19z focused on the DTX CWA. In this four-panel the upper left image is the 1 hour forecast from the 18z run of the vLAPS 1km Surface Layer Max Base Reflectivity, lower left is the 1 hour forecast for the 18z HRRR 1km AGL reflectivity and the upper right is 19z observed reflectivity from DTX. Overall the vLAPS is comparable with the HRRR in the placement of the stronger convection along a line extending south across eastern lower Michigan but the vLAPS is quite noisy with developing convection ahead of the main line that was not been observed by DTX Radar.
Shawn Smith
NOAA/CIMSS Prob Severe Model – Idea for Improvement for Linear Storm Modes
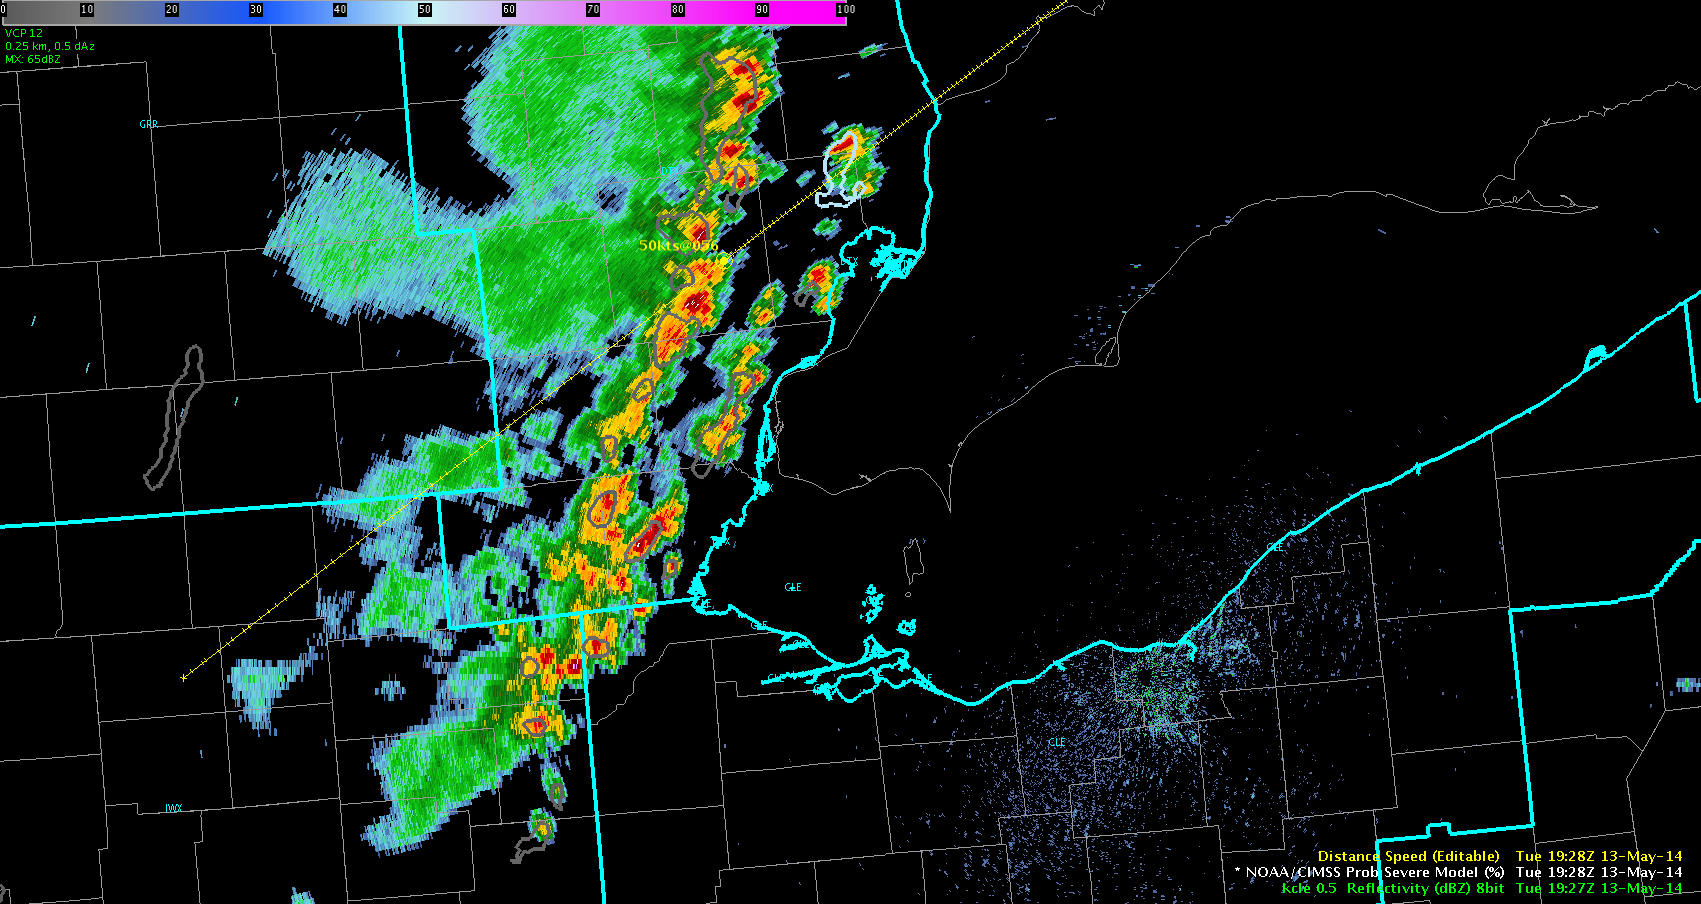
The CIMSS Probability Severe Model indicated low probability for severe storms 5-10% for a fast moving line of storms over eastern Michigan (northern part of line moving 50-60 mph) at 1928 UTC on May 13. It seems to be a good idea to include DCAPE as a displayable variable in addition to MUCAPE, EBShear, MESH, Vertical Growth Rate, and Glaciation Rate and use this variable for calculating SVR PROBs. The low probabilities are likely due to MESH values well below 1 inch (closer to 0.25 to 0.50 inch) as well as EB Shear generally 20-25 kt.
Michael Scotten