
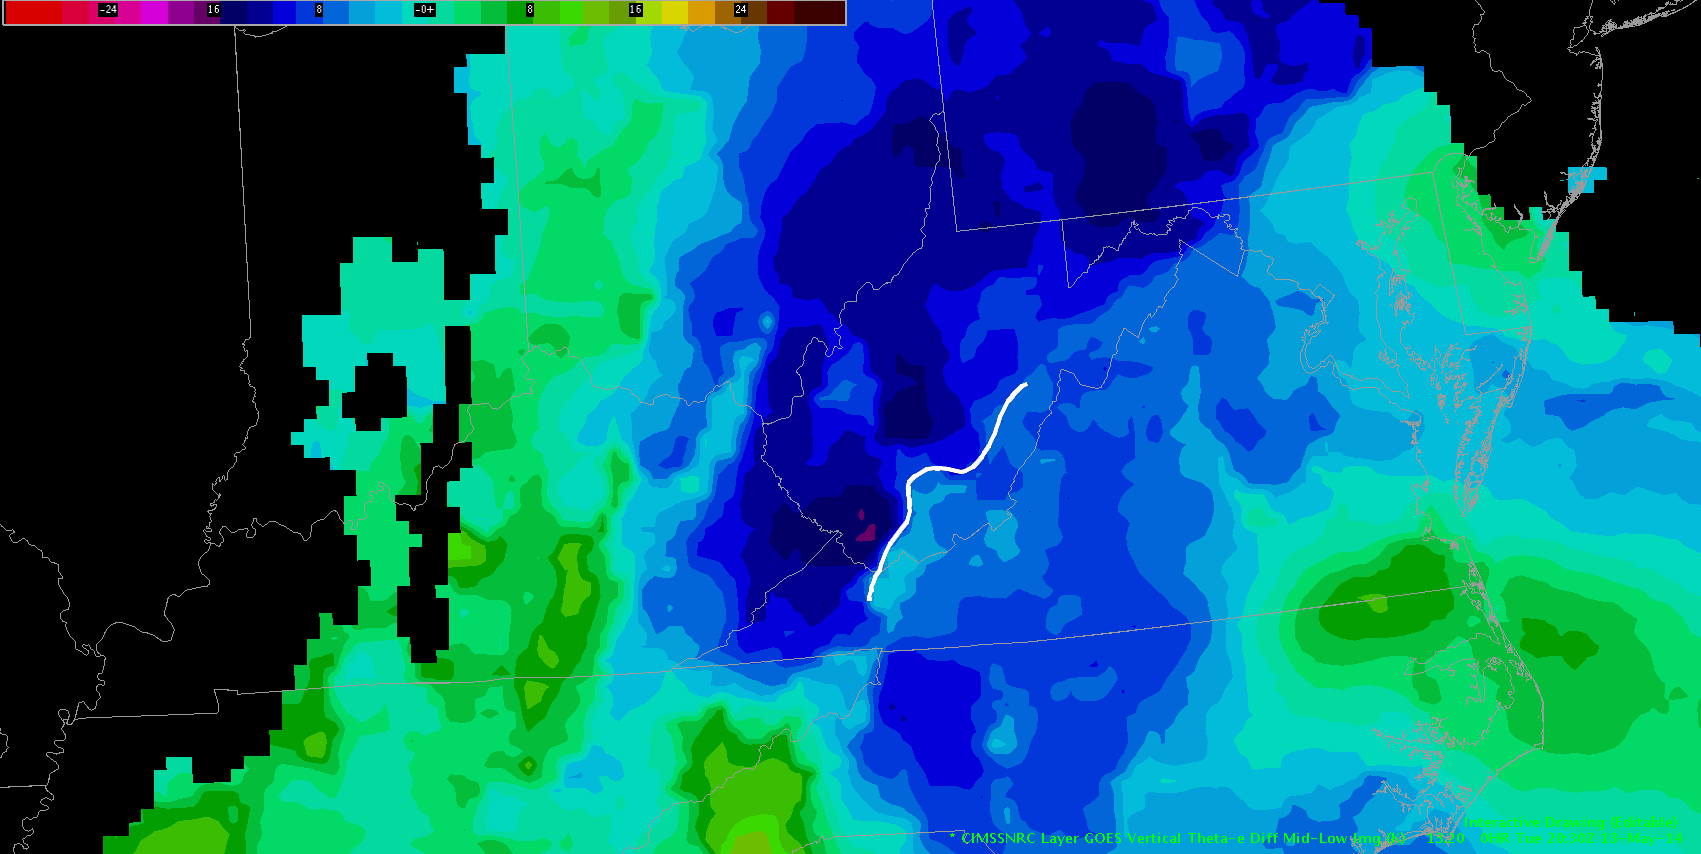
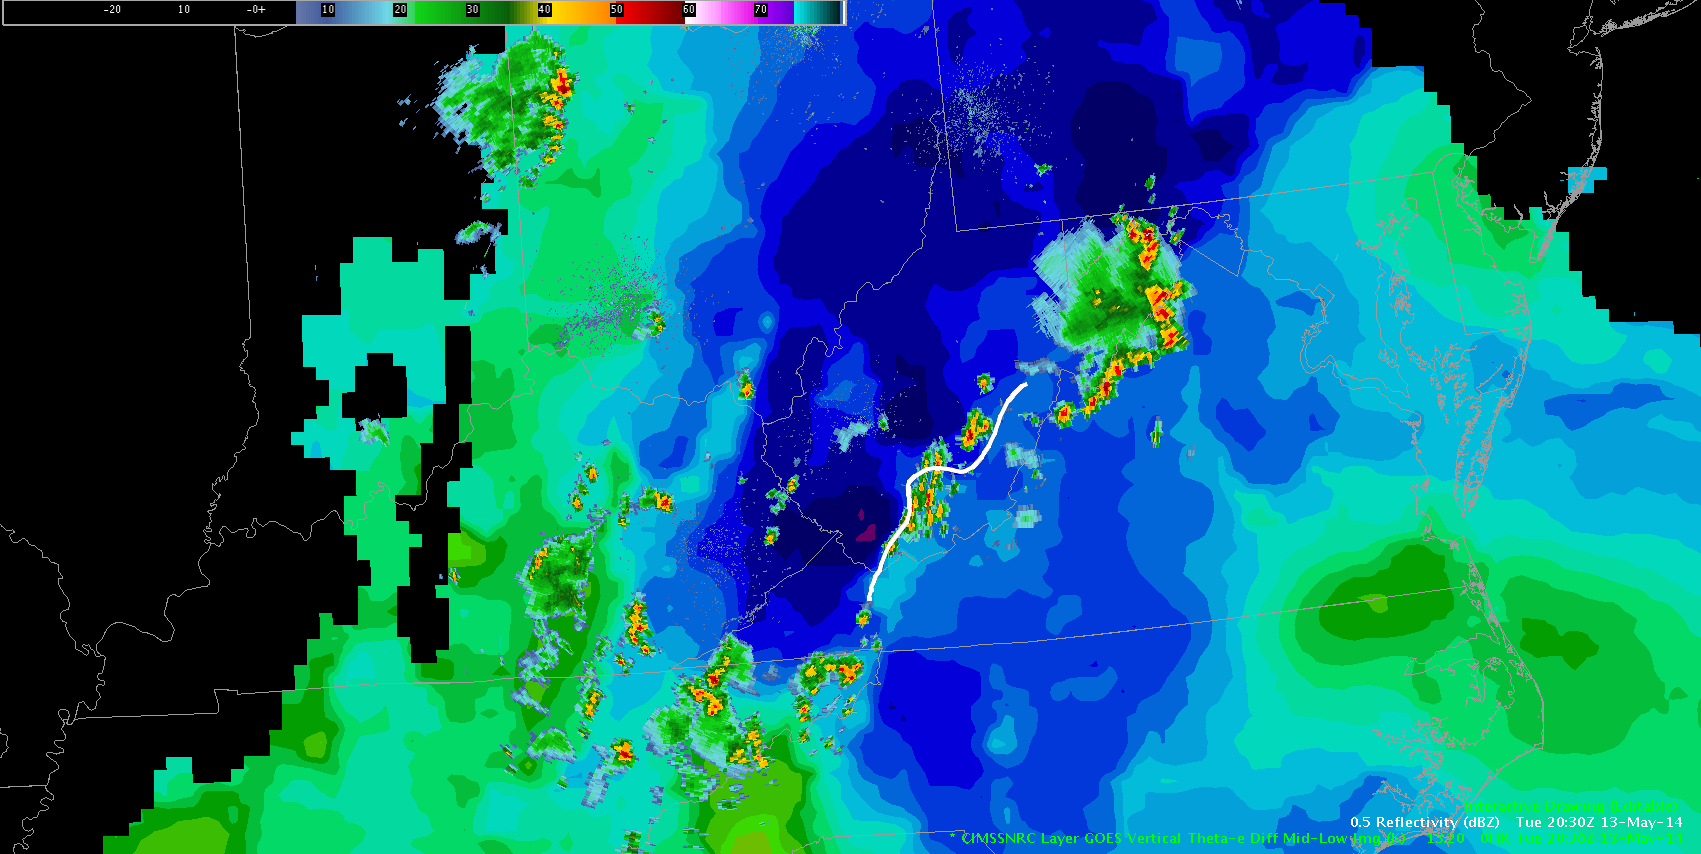
This post shows how the Nearcast model did well in depicting a weak north/northwest moving boundary that initiated convection in southwestern WV. In a rather “pulsey” environment, the ability to pick out this boundary aided in confidence as to where convection was going to form. Definitely a good tool to use in conditions where forcing is subtle and there is uncertainty on location on CI.
-Deitsch